2 Principles of Defibrillation
From Cellular Physiology to Fields and Waveforms
Electrical defibrillation is the only practical means for halting ventricular fibrillation (VF). Although it has been known for more than a century that application of an electric shock directly to the myocardium causes VF, and that the heart can be returned to normal rhythm by subsequent application of a shock of greater magnitude,1–3 knowledge of the mechanisms underlying the process of defibrillation was slow in developing. Only the introduction of novel techniques for the analysis of action potentials and activation sequences has allowed greater insight into the physiology of both fibrillation and defibrillation.4–8 It is hoped that this insight will result in a higher success rate for external defibrillation and improved design of implantable cardioverter-defibrillators (ICDs).
A large part of current research is dedicated to determining the underlying reason for the success or failure of a defibrillating shock. VF is maintained by multiple activation fronts that are constantly moving in a pattern of reentry. Characteristics of the activation pattern and action potential are believed to be important determinants of whether a shock will successfully defibrillate the heart. A successful defibrillating shock is believed to extinguish most of these activation fronts, permitting the resumption of coordinated responsiveness.9–13 For the defibrillating shock to be completely successful, this must be accomplished without creating an environment that promotes susceptibility to reinitiation of fibrillation.9,10 It has been established that successful defibrillation requires that the shock results in adequate distribution of the potential gradient (a surrogate for local current flow) throughout the ventricular myocardium.14–16
Fundamentally, defibrillation is believed to be realized through an electrical pulse that causes an alteration in the transmembrane potential of myocytes. It most likely requires a rapid induction of changes in the transmembrane potential of the myocytes in a critical mass of myocardium (75%-90% of myocardium in dogs).13,14,16 Because this represents a large mass of tissue, depolarization must be achieved at a considerable distance from the stimulating electrode. To gain an understanding of this complex far-field process, various mathematical models have been generated and predictions of computer simulations compared with physiologic findings. Both discontinuities in the anisotropic properties of the extracellular and intracellular domains, as described by the bidomain model,17,18 and highly resistive discontinuities in the intracellular space (e.g., collagenous septa), as described in the secondary source model,19–21 may contribute to the far-field changes in the potential gradient that halt the activation fronts of fibrillation; these are discussed later.
The mechanisms underlying degeneration into fibrillation in failed shocks remain incompletely understood. Residual wandering wavelets,22 nonuniform refractoriness,23 and areas of low potential gradient, in which critical points (centers of reentrant circuits) form,15 may be the sources of propagating wavefronts that can result in fibrillation through reentry. Centrifugal propagation from ectopic foci induced by the defibrillation shock may also play a role, especially in the atrium.10
 Fibrillation
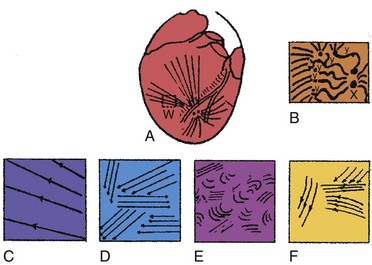
Ventricular fibrillation has been characterized as progressing through four stages, based on high-speed cinematography of electrically induced fibrillation in dog hearts24 (Fig. 2-1). A brief undulatory, or tachysystolic, stage lasting only 1 to 2 seconds occurs first. It is characterized by three to six undulatory contractions that resemble a series of closely occurring systoles and involve the sequential contraction of large areas of the myocardium. This is followed by a second stage of convulsive incoordination (15-45 seconds) during which more frequent waves of contraction sweep over smaller regions of the myocardium. Because the contractions in each region are not in phase, the ventricles are pulled in a convulsive manner. It is during this stage of fibrillation that the ICD shocks are given, about 10 to 20 seconds after the onset of fibrillation. In the third stage of tremulous incoordination, the independently contracting areas of the ventricular surface become even smaller, giving the heart a “trembling” appearance. Tremulous incoordination lasts for 2 to 4 minutes, before the fourth and final stage of atonic fibrillation occurs. Atonic fibrillation develops within 3 to 5 minutes after the onset of fibrillation and is characterized by the slow passage of feeble contraction wavelets over short distances. With time, the number of quiescent areas increases. Ischemia plays a role in the development of the third and fourth stages, because the fibrillating heart remains in the second stage if the coronary arteries are perfused with oxygenated blood.25,26
Driving the mechanical activity of the heart during fibrillation is the electrical activity of the myocardium. The electrical activity of the heart during fibrillation has been studied using both extracellular and optical recordings. Several groups have suggested that fibrillation is maintained by reentry. In most cases, reentry appears to be caused by “wandering wavelets” of activation, activation fronts that follow continually changing pathways from cycle to cycle. In some studies, the activation sequence appears moderately repeatable from cycle to cycle, following approximately the same pathway.27–29 Occasionally, a spiraling pattern of functional reentry emanates from the same region for several cycles. Sometimes, the central core of these spiral waves meanders across the heart.5 At other times, new reentrant activation fronts are generated when one front interacts with another during its vulnerable period.
Study of VF suggests that there is a level of organization to the seemingly random patterns of wandering wavelets. Two competing hypotheses have been proposed to explain this organization. The “mother rotor” hypothesis was first proposed by Lewis30 in 1925 and revived in 1996 by Gray and Jalife.31 This hypothesis proposes that a single, stationary reentrant circuit (or mother rotor), located in the fastest-activating region of the heart, “drives” VF by giving rise to activation fronts that propagate throughout the remainder of the myocardium.29 These wavefronts propagate away from this fast-activating region, encounter areas of unidirectional block, and break up into smaller, slower-moving waveforms that resemble Wiggers’ wandering wavelets. Experiments best demonstrating the “mother” rotor have been performed in small hearts, from guinea pigs or rabbits. Studies of larger hearts have shown areas of faster and slower activation across the heart, but the existence of a single reentrant rotor that drives fibrillation has not been clearly demonstrated.32,33
In contrast to the mother rotor hypothesis is the “restitution” hypothesis. Restitution properties of the heart have been recognized for many years. Restitution in the heart refers to the relationship between the duration of an action potential in a particular cell and the duration of the previous diastolic or resting interval. If the previous diastolic interval (DI) is short, the current action potential duration (APD) will also be short. If the previous DI is long, the current APD will be long. For a regular rhythm, the preceding DI is constant and, therefore, so is the duration of the subsequent APD. The relationship between an APD and the previous DI is often described graphically as a plot of APDn versus DIn-1 (Fig. 2-2). The steepness of the restitution curve is an important characteristic of this curve, especially at short DIs. If this slope is greater than 1, then, at a constant cycle length, a single perturbation in DI will cause the ensuing APDs and DIs to oscillate, with the oscillations progressively increasing until the site is refractory at the time of the next cycle, causing conduction block and VF initiation. During VF, it is hypothesized that, when the slope of the restitution curve is greater than 1, oscillations in DI and APD increase until block occurs and wavefronts break up. Figure 2-2 shows an example of a restitution curve recorded from the right ventricle of a pig. The relationship between a DI and the subsequent APD is well defined during paced rhythm but less well defined during VF.
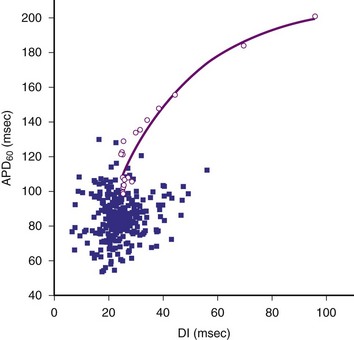
Figure 2-2 Restitution curve recorded from right ventricle of pig.
(From Huang J, Zhou X, Smith WM, Ideker RE: Restitution properties during ventricular fibrillation in the in situ swine heart. Circulation 110:3161-3167, 2004.)
Cellular Action Potential and Excitable Gap During Fibrillation
In the past few years, knowledge of the characteristics of the action potentials during fibrillation has increased greatly. This is a direct result of the introduction of techniques for recording action potentials in whole hearts, either in vivo31 or in perfused, isolated hearts.4–6,10,31 During fibrillation, the action potentials are altered: the APD is decreased; the action potential upstroke is slowed (decreased first-order derivative, dV/dt) and of decreased magnitude; the plateau phase is abbreviated; and DIs are abbreviated or absent (Fig. 2-3). During the first few seconds of VF (or atrial fibrillation), the activation rate is quite rapid; the mean cycle length of VF in patients undergoing defibrillator implantation was 213 ± 27 msec.6 DIs are rarely seen during early fibrillation, and the upstroke of most action potentials occurs before the transmembrane potential has returned to baseline from the previous action potential. The demonstration of an excitable gap in fibrillating atrial tissue,34 as well as evidence of an excitable gap in fibrillating ventricular tissue,35 suggests that there are periods late in the action potential in the fibrillating myocardium during which an electrical stimulus can capture a portion of the fibrillating myocardium. Knowledge of an excitable gap provides an opportunity to stimulate the tissue just in front of a fibrillating wavefront, to cause wavefront block.
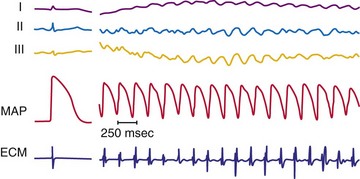
Figure 2-3 Recording during ventricular fibrillation in a human.
(From Swartz JF, Jones JL, Fletcher RD: Characterization of ventricular fibrillation based on monophasic action potential morphology in the human heart. Circulation 87:1907-1914, 1993.)
As described in Chapter 1, the electrical activity of the heart is controlled ultimately by ion channels located in the cell membrane of the myocyte. It has been established that both the voltage-gated fast channels (sodium [Na+]) and slow channels (Na+ and calcium [Ca2+]) are active during the first few seconds of VF.8 The fast-channel activity is indicated by the rapidity of the upstroke of the action potential (phase 0) during early fibrillation and its sensitivity to administration of the Na+ channel blocker, tetrodotoxin. As fibrillation proceeds, the upstrokes of the action potentials become increasingly slower, with a decreased dV/dtmax, but the action potentials remain sensitive to tetrodotoxin until 1 to 5 minutes after initiation of fibrillation. A transition then occurs in which the action potential upstrokes become insensitive to tetrodotoxin. This suggests that the propagation of the action potential is no longer mediated primarily by the fast voltage-gated Na+ channels and may be mediated by slow voltage-gated Ca2+ channel activity in the later stages of fibrillation.4 The activation complexes recorded from the ventricular myocardium remain active only as long as the coronary arteries are perfused with oxygenated blood, suggesting that ischemia may be responsible for the loss of fast-channel activation during prolonged VF.26
 Defibrillation
As previously mentioned, application of a powerful electrical shock to the heart is the only reliable means of stopping fibrillation. Successful defibrillation can reflect either the immediate cessation of all activation fronts or the cessation of activation fronts after two to three cycles,11,36 followed by coordinated beating of the heart. Unsuccessful defibrillation can reflect a failure to inhibit the fibrillating activation fronts or the resumption of fibrillating activation fronts after their initial inhibition.
Waveforms, Current Strength, and Distribution During Defibrillation
The two most common waveform shapes used clinically are the monophasic and biphasic waveforms. In monophasic waveforms, the polarity of the shock is unchanged at each electrode for the entire duration of the electrical shock. In biphasic waveforms, the polarity of the shock reverses at each electrode partway through the defibrillation waveform. Many studies, in both animals and humans, have shown that biphasic waveforms can defibrillate with less current and energy than monophasic waveforms, in both internal and transthoracic defibrillation configurations.37–40 Within each type, waveforms can be described as truncated exponential or damped sinusoidal shapes. ICDs use truncated exponential biphasic waveforms. Most external defibrillators have used damped sinusoidal monophasic waveforms, but because of the inductor necessary to shape the waveform, these defibrillators tend to be large and heavy. More recently, smaller, lighter external defibrillators have been developed that use truncated exponential biphasic waveforms similar to those used in ICDs. Damped sinusoidal biphasic waveforms are used in external defibrillators in Russia; similar to truncated exponential biphasic waveforms, these show improved efficacy over monophasic waveforms.41,42
However, not all biphasic waveforms are superior to monophasic waveforms, For example, if the second phase of the biphasic waveform becomes much longer than the first phase, the energy required for defibrillation increases and can eventually rise to a level greater than the energy required to defibrillate with a monophasic waveform (with duration equal to the first phase of the biphasic waveform).40,43,44 The optimum duration of the two phases of the biphasic waveform depends on the electrode impedance and the defibrillator capacitance.45–48
Several groups have shown that defibrillation efficacy for square waveforms follows a strength-duration relationship similar to that for cardiac stimulation;49,50 as the waveform becomes longer, the average current at the 50% success point (the current when one half of delivered shocks will succeed) becomes progressively less, approaching an asymptote called the rheobase.51 On the basis of this observation, some suggest that cardiac defibrillation can be mathematically modeled using a resistor-capacitor (RC) network to represent the heart45,51–53 (Fig. 2-4). As empirically determined, the time constant for the parallel RC network is 2.5 to 5 msec.45,47,53 In one version of the model,53 a current waveform is applied to the RC network. The voltage across the network is then calculated for each time point during the defibrillation pulse. The relative efficacies of different waveform shapes and durations can be compared by determining the current strength that is necessary to make the voltage across the RC network reach a particular value, called the defibrillation threshold.
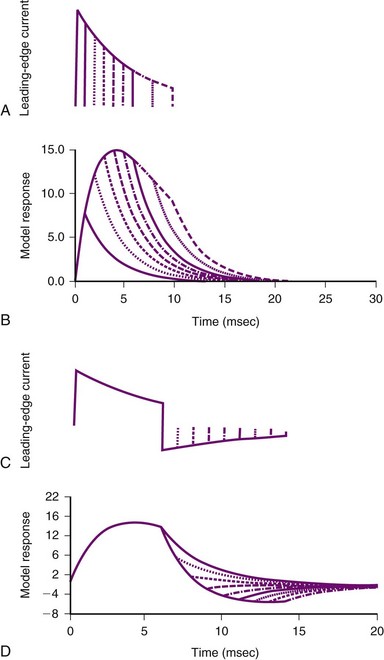
Figure 2-4 Parallel resistor-capacitor (RC) network representation of heart.
(From Walcott GP, Walker RG, Cates AW, et al: Choosing the optimal monophasic and biphasic waveforms for ventricular defibrillation. J Cardiovasc Electrophysiol 6:737-750, 1995.)
Several observations can be made from this model. First, for square waves, as the waveform duration becomes longer, the voltage across the network increases, approaching an asymptote, or rheobase. For truncated exponential waveforms, however, the model voltage rises, reaches a peak, and then, if the waveform is long enough, begins to decrease (see Fig. 2-4). Therefore, the model predicts that monophasic exponential waveforms should be truncated at a time when the peak voltage across the RC network is reached. Current or energy delivered after that point is wasted. In support of this prediction, strength-duration relationships measured in both animals53 and humans54 do not approach an asymptote but rather reach a minimum and remain constant as the waveform lengthens. This minimum occurs over a range of waveform durations and does not extend indefinitely. Schuder et al.55 showed that, if the duration of a waveform becomes too long, defibrillation efficacy decreases.
Second, the model predicts that the heart acts as a low-pass filter.52 Therefore, waveforms that rise gradually should have better efficacy than waveforms that turn on immediately. This prediction has been shown to hold true for external defibrillation,56 internal atrial defibrillation,57 and internal ventricular defibrillation.58 Ascending ramps defibrillate with a greater efficacy than do descending ramps.58,59
Third, several groups have suggested that the optimal first phase of a biphasic waveform is the optimal monophasic waveform.46,53 If so, what does the model predict as the “best” second phase of a biphasic waveform? Empirically, the role of the second phase apparently is to return the model voltage response back to zero as quickly as possible, thereby maximizing the increased efficacy of the biphasic waveform over that of the monophasic waveform with the same duration as phase 1 of the biphasic waveform. If the network voltage does not reach zero, or if it overshoots zero, efficacy is lost. Swerdlow et al.47 showed in humans that the “best” phase 2 of a biphasic waveform returns the model response close to zero.
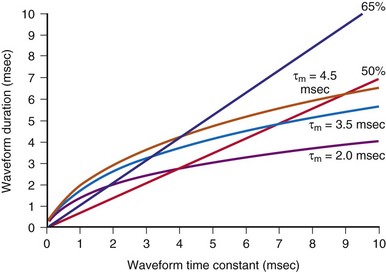
These models can also help in choosing shock parameters, including phase duration for biphasic waveforms. Shock duration should be varied depending on defibrillation lead impedance; patients with low impedance should receive short-duration shocks, whereas patients with high impedance should receive longer-duration shocks. Initially, the concept of “tilt” was used to vary shock phase durations with impedance. Tilt is defined as the quotient of the leading-edge voltage minus the trailing voltage at the end of the shock divided by the voltage at the beginning of the shock, expressed as a percentage. For example, a shock with starting voltage of 500 V and ending voltage of 100 V has a tilt of 80%. If tilt is held constant, shock duration varies linearly with shock impedance. Compared with model predictions (Fig. 2-5), fixed-tilt waveforms are too short for patients with low impedance and too long for patients with higher impedance. One defibrillator manufacturer has developed a reference table that gives waveform phase durations as a function of patient impedance using a model similar to the one previously presented.60,61 Their model uses “model time constants” of 2.5, 3.5, and 4.5 msec. It is recommended that the 3.5-msec constant be used first. If the defibrillation threshold for the 3.5-msec waveform is unsatisfactory, using the 4.5-msec constant is likely to be more effective than 2.5 msec. Waveforms that are too short tend to fail; waveforms that are too long tend to waste shock energy yet still defibrillate.
The location of the defibrillation electrodes affects the magnitude of the shock necessary to defibrillate the heart. Typically, 200 to 360 J of energy are necessary for successful defibrillation, with the defibrillation electrodes located on the body surface, during transthoracic defibrillation with a damped sinusoidal monophasic waveform. Although less energy is required for a truncated exponential biphasic waveform,62 only about 4% to 20% of the current that is delivered to transthoracic defibrillation electrodes ever reaches the heart.63,64 Indeed, when the defibrillation electrodes are placed in the heart itself, usually only 20 to 34 J of energy is required, and the requirement may be as low as only a few joules when large, contoured epicardial electrodes are used.40,65 The strength of the shock also varies for different locations on or in the heart; epicardial patches defibrillate with a lower shock energy than transvenous electrode configurations.66
Although defibrillation efficacy is usually described by some measure of defibrillation shock “strength” (energy, voltage, or current), little insight into the mechanisms of defibrillation can be obtained from these measures. Knowing how the current (or voltage) of a defibrillation shock is distributed over the heart allows greater understanding of how defibrillation occurs. Several studies have measured the potential gradient distribution throughout the heart during a defibrillation shock.14,67,68 The potential gradient is a measure of the spatial variation of shock voltage across the heart. The potential gradient is measured in volts per centimeter (V/cm) of tissue. In a region with a high potential gradient, the difference in voltage between a given point and an area 1 cm distant from that point is high. Regions of low potential gradient have a measured voltage that is similar to that of nearby points. These studies show an uneven potential distribution for most electrode configurations, with areas of high potential gradient near the defibrillation electrodes and areas of low potential gradient in regions distant from the defibrillating electrodes. It has been hypothesized that a minimum potential gradient must be attained for successful defibrillation to occur, and that this requirement is independent of the current applied or the electrode configuration.15,16 After a shock that fails to defibrillate VF, the site of earliest activation immediately after the shock can be mapped and related to the electric field that was produced by the shock. For shocks near the defibrillation threshold, the sites of earliest activation after a failed shock occur in the areas of lowest potential gradient.
The minimum potential gradient required for defibrillation is lower for biphasic than for monophasic waveforms (4 vs. 6 V/cm). A minimum potential gradient of 6 V/cm was required for successful defibrillation using a 10-msec truncated exponential monophasic waveform in the open-chest dog model.16 Similar findings were observed using a 14-msec truncated exponential monophasic waveform and multiple electrode configurations.15 In contrast, a minimum potential gradient of 4 V/cm was required for successful defibrillation using a truncated exponential biphasic waveform. Because higher shock strengths are required to induce a higher potential gradient, biphasic shocks successfully defibrillate with lower energy than monophasic shocks (i.e., a lower-voltage gradient is required).
The requirement for a minimum potential gradient may reflect the need for a shock to prevent the generation of new activation fronts that can result in reinitiation of fibrillation.69 Examination of activation patterns after failed defibrillation for progressively larger shock strengths indicate that postshock activation occurs at numerous sites throughout the ventricle, and that reentry is common when the shock strength is much lower than that needed for defibrillation70 (Fig. 2-6). At shock strengths just lower than those required for defibrillation, postshock activation arises in a limited number of myocardial regions. The activation fronts then propagate to activate other regions of the myocardium for a few cycles before reentry occurs; activation becomes disorganized; and fibrillation is reinitiated. Although postshock activation sites can still arise in regions of lowest potential gradient after a shock slightly greater than that required for defibrillation, the cycles of activation that originate from these sites are slower. These activations terminate after a few cycles without reinitiating fibrillation.69–71
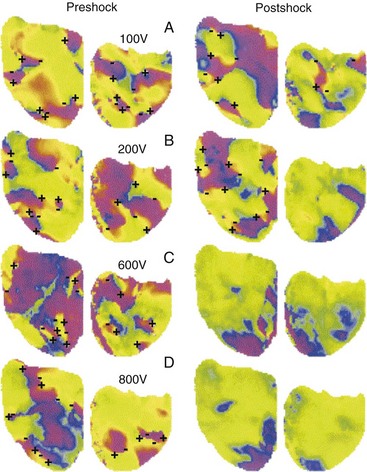
Figure 2-6 Phase maps of single rabbit heart.
(From Chattipakorn N, Banville I, Gray RA, Ideker RE: Effects of shock strengths on ventricular defibrillation failure. Cardiovasc Res 61:39-44, 2004.)
At least two inferences can be drawn from the model that the lowest potential gradient region determines whether or not a shock will halt fibrillation. First, different shock electrode configurations with the same defibrillation threshold (DFT) have the same lowest potential gradient value, but in different regions of the heart. Single-coil versus dual-coil defibrillator systems have similar DFTs. Mapping of postshock activations shows that the earliest recorded activity after the shock is the anterior left ventricle for dual-coil shocks but the posterior area for single-coil shocks.72 Thus the low gradient region presumably is anterior for dual-coil shocks and posterior for single-coil shocks, although this inference needs to be confirmed experimentally. Crossley et al.73 measured DFTs for shocks from either an electrode in the right ventricular (RV) apex or RV outflow tract to the pulse generator can and showed that DFTs were not significantly different for the two configurations. We can infer that the lowest potential gradient level was the same for each configuration, but likely in a different location.
Second, high DFTs occur in some patients because either (1) the geometry of their heart is such that the low potential gradient region has a lower potential gradient than in most patients, or (2) these patients require a higher gradient level in the low gradient region to defibrillate. In either case, unusual lead configurations may help in these patients. A subcutaneous array can lower high DFTs,74 most likely by directing current to the left ventricular free wall. Likewise, an azygos vein electrode can be useful in lowering high thresholds,75 likely by directing current to the posterior portion of the heart.
The previous discussion shows how defibrillation can fail because a shock is of insufficient strength. Another issue involves the defibrillation shock that becomes extremely large. At high shock strengths, the probability of defibrillation success again begins to decrease. It is believed that, at large strengths, defibrillation shocks can have detrimental effects on the heart. Increasing the shock strength to very high levels (>1000 V with transvenous electrodes) can result in activation fronts arising from regions of high potential gradient that reinduce VF.76 Cates et al.77 showed that, for both monophasic and biphasic shocks, increasing shock strength does not always improve the probability of successful defibrillation and may even increase the incidence of postshock arrhythmias. Chapman et al.78 showed in dogs that the time required for the heart to recover hemodynamically after a defibrillation episode was shorter for biphasic than for monophasic shocks. Further, they showed that hemodynamic recovery took longer after high-energy shocks than after low-energy shocks. Reddy et al.79 showed that transthoracic defibrillation with biphasic shocks resulted in less postshock electrocardiographic evidence of myocardial dysfunction (injury or ischemia) than standard monophasic damped sinusoidal waveforms, and without compromise of defibrillation efficacy.
One mechanism implicated in the means by which shocks cause damage to the myocardium is electroporation, the formation of holes or pores in the cell membrane. Electroporation may occur in regions where the shock potential gradient is high (>50 to 70 V/cm) and may even occur in regions where the potential gradient is much less than 50 V/cm.80 The very high voltage can result in disruption of the phospholipid membrane bilayer and in the formation of pores that permit the free influx and efflux of ions and micromolecules. Electroporation can cause the transmembrane potential to change temporarily to a value almost equal that of the plateau of the action potential. At this transmembrane potential, the cell is paralyzed electrically, being both unresponsive and unable to conduct an action potential. Exposure of the myocardium to yet higher potential gradients, probably greater than 150 V/cm, results in arrhythmic beating, and at extremely high potential gradients, necrosis may occur.81
The shape of the waveform alters the strength of the shock at which these detrimental effects occur. Use of a 10-msec, truncated exponential monophasic waveform for VF in dogs resulted in conduction block in regions where the potential gradient was greater than 64 ± 4 V/cm.82 Shocks that created even higher potential gradients in the myocardium (71 ± 6 V/cm) were required for conduction block when a 5-msec/5-msec, truncated exponential biphasic shock was used. Adding a second phase to a monophasic waveform, thereby making it a biphasic waveform, reduced the damage sustained by cultured chick myocytes compared with that induced by the monophasic waveform alone.83 Therefore, biphasic waveforms are less likely to cause damage or dysfunction in high-gradient regions than monophasic waveforms.
Models Proposed to Explain Induction of Changes in Transmembrane Potential throughout Heart during Defibrillation Shock
A shock in the form of a square wave given across the defibrillation electrodes appears almost immediately as a square wave in the extracellular space of the heart. There is no significant distortion, because the extracellular space throughout the body is primarily resistive, with little reactive component. Phase delays and alterations of the appearance of the shock wave occur in the transmembrane potential, however, because of the capacitance and ion channels of the myocyte membrane.84 Consequently, a square-wave shock can elicit an exponential change with time in the transmembrane potential (Fig. 2-7).
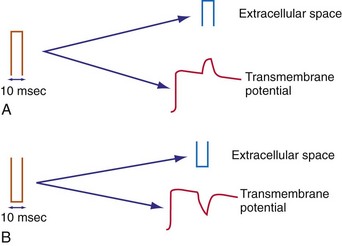
Figure 2-7 Effect of square-wave shock on extracellular potential and transmembrane potential.
(From Walcott GP, Knisley SB, Zhou X, et al: On the mechanism of ventricular defibrillation. Pacing Clin Electrophysiol 20:422-431, 1997.)
The nonlinear behavior of the membrane caused by the ion channels also affects the outcome of reversing the polarity of the defibrillation shock. Reversing the polarity may reverse the sign of the change in the transmembrane potential in some regions of the myocardium, and the nonlinear behavior of the membrane can alter the magnitude and the time course of this change. As discussed previously, reversing the polarity of the shock may not reverse the sign of the change in the transmembrane potential in all regions of the heart; some areas may be hyperpolarized with both shock polarities.85 This may reflect the nonlinear behavior of the membrane ion channels.
Several models have been formulated in an attempt to explain the mechanisms by which the defibrillation shock is distributed throughout the myocardium to restore coordinated, effective action potentials. As yet, none of the models adequately describes all the experimental findings on the action potential changes during defibrillation. It is well established experimentally that changes occur many centimeters from the defibrillating shock electrodes. These changes in transmembrane potential can result in new action potentials or prolongation of the action potential as described previously.23,86 Direct excitation can be observed,23 even far from the electrode (>30 mm),87 as well as across the entire heart.88
Although the one-dimensional cable model described in Chapter 1 adequately describes the generation of self-propagating action potentials close to an electrode as required for pacing, it fails to account for the far-field changes observed during defibrillation. During stimulation or defibrillation, this model predicts that the tissue near the anode should be hyperpolarized, whereas the tissue near the cathode should be depolarized.89 The magnitude of the hyperpolarization or depolarization decreases exponentially with the distance from the electrodes according to the membrane space constant, the distance at which the hyperpolarization or depolarization has decreased by 63%. For cardiac tissue, the space constant is only 0.5 to 1 mm.89,90 Therefore, the one-dimensional cable equations predict that tissue more than 10 space constants (~1 cm) distant from the defibrillation electrodes should not directly undergo changes in transmembrane potential because of the shock field. That is, new action potentials should not arise by direct excitation at distances greater than 1 cm from the electrodes. This model fails to describe the experimentally observed global distribution of action potentials during defibrillation.
Therefore, several additional mathematical formulations have been proposed, including the sawtooth model,21,91–93 the formation of secondary sources at barriers in the myocardium,20,94 and the bidomain model,95 to explain how a defibrillation shock affects the transmembrane potential a long distance from the shocking electrodes. In the simplest formulation of these models, the extracellular and intracellular spaces are considered to be low-resistance media and the membrane to be a high-resistance medium in parallel with capacitance. The simple case models incorporate only passive myocardial properties. The models have been rendered more realistic by the addition of active components to represent the ion channels in the membrane, gap junctions, and membrane discontinuities.96,97 By convention, the current is defined as the flow of positive ions from the anode to the cathode.
Sawtooth Model
The one-dimensional cable model positions two low-resistance continuous spaces that conduct current from the shock, the intracellular space and the extracellular space, separated by a high-resistance cell membrane. In the sawtooth model the intracellular space is divided by a series of high-resistance barriers, the gap junctions. Because of these high-resistance barriers, current moving in the intracellular space is forced to exit into the extracellular space and reenter the cell on the other side of the barrier. Exit and reentry of the current from the intracellular domain results in hyperpolarization near the end of the cell closest to the anode and depolarization near the end of the cell closest to the cathode. A tracing of the changes in transmembrane potential along a fiber during the shock should therefore resemble the teeth of a saw, with each tooth corresponding to an individual cell21,91–93 (Fig. 2-8). Increases in the junctional resistances are predicted to increase the magnitude of the potential changes at the ends of the cell.21 Although gap junctions are of low resistivity, they can present significant junctional resistance under certain conditions, such as hypoxia98,99 and calcium depletion.100 As the resistance of the gap junctions increases, it is predicted that a greater fraction of current passes preferentially across the cell membrane rather than along the cell.
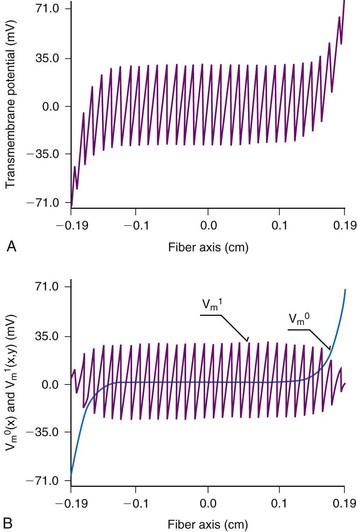
Figure 2-8 Sawtooth model of transmembrane potential during a shock.
(Modified from Krassowska W, Pilkington TC, Ideker RE: Periodic conductivity as a mechanism for cardiac stimulation and defibrillation. IEEE Trans Biomed Eng 34:555-560, 1987.)
The sawtooth model adequately describes the requirement for a minimum potential gradient, because the magnitudes of the hyperpolarization and polarization at the ends of the cells are directly proportional to the strength of the stimulus. It also adequately describes the generation of action potentials at a distance from the electrodes and the differences in threshold stimuli between cathodal and anodal stimulation. Sawtooth changes in transmembrane potential have been observed in preparations of isolated cardiomyocytes;101,102 however, such a pattern in isolated cells would be consistent with the cable model. This pattern has not been observed in a syncytium of cardiac cells.20,103,104
Secondary Source Model
Although the resistivity of the gap junctions at the boundaries between the cells may not adequately explain the physiologic effects of defibrillation, the resistivity of other intracellular discontinuities and interruptions may well play a role. Most theories concerning the generation of action potentials and their propagation across the ventricle, such as the bidomain theory described later, consider the myocardium to be a uniform electrical continuum. This assumption does not take into account the discontinuities of the intracellular domain, where the myocardium is interrupted by barriers such as connective tissue septa, blood vessels, and scar tissue. As described previously for the sawtooth model, the intracellular current, on encountering such a barrier, must leave the intracellular space, cross the barrier, and reenter the intracellular domain on the other side. Depolarization should occur on one side of the barrier and hyperpolarization on the other side. Therefore, the barrier acts as a set of electrodes during the shock, becoming a secondary source of action potentials (Fig. 2-9). These secondary sources are important causes of depolarization and hyperpolarization throughout the myocardial tissues during a shock.20 The resistive barriers act in a manner similar to that described for the sawtooth model. In this case, however, the resistive barriers represent larger discontinuities, which tend to increase with age and cardiac hypertrophy.105
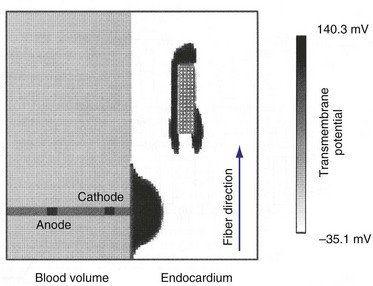
Figure 2-9 Computer model of secondary sources adjacent to scar elicited by single, large, pacing pulse.
(From Street AM: Effects of connective tissue embedded in viable cardiac tissue on propagation and pacing: implications for arrhythmias. Durham, NC, 1996, Department of Biomedical Engineering, Duke University, p 134.)
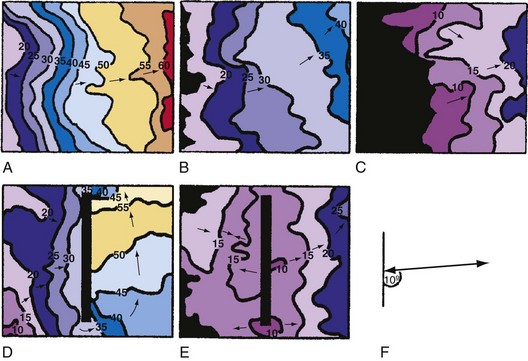
Computer simulations have shown that the cathodal stimulation delivered to the myocardium near an oval scar results in three distinct activation fronts: the primary activation front and secondary fronts at the distal and proximal edges, which are generated by the exit and reentry of current from the intracellular and extracellular spaces106 (see Fig. 2-8). Optical techniques have directly recorded changes in transmembrane potentials throughout a monolayer of ventricular myocytes.20 Localized regions of depolarization and hyperpolarization coincided with discontinuities in the monolayer, resulting in slow conductance. Microscopic regions of depolarization and hyperpolarization have also been observed in isolated slabs of left ventricle, although their correlation with anatomic structures was not possible using optical mapping techniques because of the light-scattering properties of myocardium.107 The significance of secondary sources was demonstrated in whole hearts by mapping of action potentials and determination of shock thresholds before and after the generation of a transmural lesion in the myocardial walls of dogs.94 Generation of the lesion resulted in the development of a region of direct activation in the area of the lesion, in addition to the region of direct activation resulting from the stimulating electrode observed before the lesion. Furthermore, the strength of the shock required to cause direct activation in the area of the lesion was less than one half of that required before generation of the lesion (Fig. 2-10).
Bidomain Model
The bidomain model is an extension of the one-dimensional cable model into two or three dimensions. That is, the extracellular and intracellular spaces are represented as single, continuous domains that extend in two or three dimensions and are separated by the highly resistive cell membrane95 (Fig. 2-11). If the conductivities of the intracellular and extracellular spaces are constant in all directions, the model collapses to the one-dimensional cable model. Anisotropy refers to the manner in which conductivities change with the direction of myocardial fiber orientation. Clerc108 showed that conductivity is higher in the direction parallel to the long axis of myocardial fibers (longitudinal) than in the direction perpendicular to the fibers (transverse) for both the intracellular and extracellular spaces. If conductivities change with direction but change the same for the intracellular and extracellular spaces, the bidomain model collapses to the one-dimensional cable model.
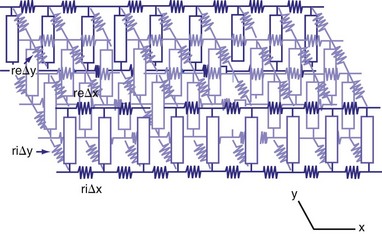
Studies have shown that the anisotropy ratio in ventricle is about 3 : 1 in the extracellular space and 10 : 1 in the intracellular space. When anisotropy ratios are used, the bidomain model begins to give new insights into how shocks change the transmembrane potential. Similar to the one-dimensional cable model, the bidomain model predicts that hyperpolarization occurs in tissue that lies under the extracellular anodal electrode. Likewise, depolarization occurs in tissue under the extracellular cathodal electrode. Unlike the one-dimensional cable model, the bidomain model also predicts that depolarization occurs along the long axis of the myocardial fibers at distances just a few millimeters from the anode. A similar effect is predicted to occur at the cathode, with hyperpolarization at distances of a few millimeters.109 Therefore, the effect on the transmembrane potential near the shocking electrode is predicted to be much more complicated by the bidomain model than by the one-dimensional cable model.
The power of the bidomain model, however, is that it hypothesizes that there should be changes in the transmembrane potential, either hyperpolarization or depolarization, across the entire heart. In this model, the change in transmembrane potential elicited by the shock depends on the distribution of intracellular and extracellular current, which is affected by the change in potential gradient with distance, the distance from the electrode, and the orientation of the myocardial fibers. Experimental studies show a complex pattern of transmembrane potential changes during the delivery of a defibrillation shock, similar to those predicted by the bidomain model.85,110,111
The transmembrane potential changes that occur during the delivery of a defibrillation shock can lead to the initiation of reentry and subsequent reinitiation of fibrillation after the shock. Reentrant circuits can be described by the mathematical concept of a phase singularity.112 Phase can be used to describe the cardiac action potential, with 0 phase assigned to the upstroke of the action potential and 2Π phase assigned to the end of the action potential. A reentrant circuit can be thought of as a circle of phase starting at 0 (excitation) and continuing to 2Π (recovery). The reentrant circuit moves around a central point, called a phase singularity. Efimov et al.110 showed that a defibrillation shock can impose changes on the transmembrane potential extending from 0 phase through 2Π phase (Fig. 2-12). Thus, a reentrant circuit is generated and fibrillation induced. The authors suggest that induced reentrant circuits may be one way that defibrillation shocks can fail.
Effect of Defibrillating Shock Field on Cellular Action Potential
The final common pathway of changes in the transmembrane potential caused by a defibrillation shock involves effects on the shape and duration of the cellular action potential. The shock can have one of three effects on the myocardium, depending on the local strength of the shock and its timing with respect to the local action potential. If the shock is delivered during the early plateau, there will be little or no prolongation of the action potential. If the shock is strong enough and is delivered relatively late during the action potential, it will initiate a new action potential. A shock that is strong enough but is delivered during early phase 3 of the action potential will modify and prolong an ongoing action potential without initiating an entirely new action potential (Fig. 2-13).
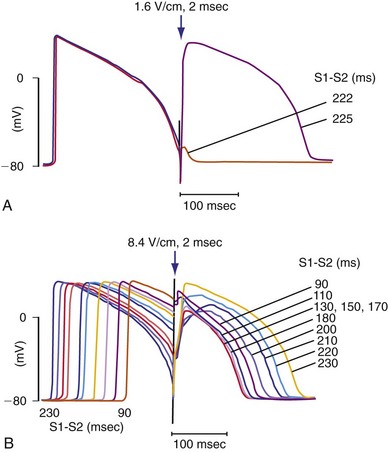
Figure 2-13 Transmembrane recordings from guinea pig papillary muscle.
(From Knisley SB, Smith WM, Ideker RE: Effect of field stimulation on cellular repolarization in rabbit myocardium: Implications for reentry induction. Circ Res 70:707-715, 1992.)
To defibrillate the heart successfully, a defibrillating shock (1) must stop most or all activation wavefronts on the heart and (2) must not reinitiate fibrillation. The extension of refractoriness hypothesis helps to explain how a shock can stop fibrillation. A shock can prolong the refractory period of an action potential without triggering a new potential if it is of sufficient strength and is delivered at an appropriate interval with respect to the upstroke.23,113 If the first activation front that forms after a defibrillation shock encounters tissue with an extended refractory period, the front will be stopped because it cannot propagate into the region of refractory tissue.
Also, a defibrillation shock must not restart fibrillation. If only part of the front encounters tissue with an extended refractory period, only part of the front will be halted. The rest of the activation front will propagate forward and will eventually move into the area that could not be stimulated or that would not allow propagation (unidirectional block). This process of stimulating some tissue and creating unidirectional block in adjacent regions creates a reentrant circuit that eventually breaks down into fibrillation. The critical point is that point at which a critical shock strength intersects a critical level of refractoriness, leading to the formation of a reentrant circuit.114–116
Optical mapping has revealed another type of critical point about which reentry can occur in response to the shock electric field.110 This type of critical point is formed when the shock electric field causes a large region of hyperpolarization immediately adjacent to a large region of depolarization. According to Efimov et al.,117 a biphasic shock waveform is more efficacious because the second phase of the shock obliterates the regions of hyperpolarization and depolarization so that the critical-point reentrant wavefront does not arise. Both types of critical points share two attributes; first, they produce a wavefront that appears immediately after the shock, and second, the wavefront forms a reentrant circuit.
Refibrillation Caused by Defibrillation Shock
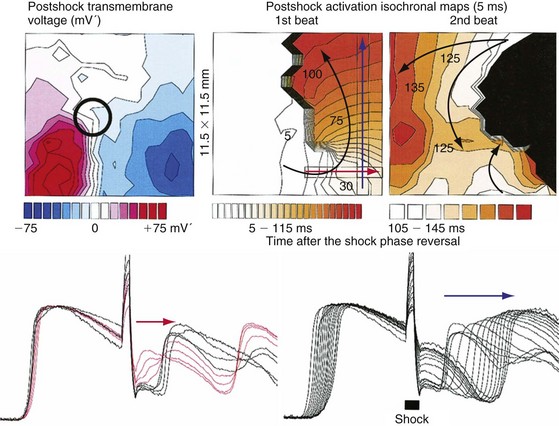
Although activation wavefronts consistent with the two types of critical points are observed following shocks given during the vulnerable period of paced rhythm and after shocks much weaker than the DFT during VF, these wavefronts are usually not observed after shocks near DFT strength during VF.118–123 Instead, earliest activation is not recorded until 50 to 60 msec after the shock, an interval called the isoelectric window, and wavefronts spread centrifugally away from this early site in a focal activation pattern. This pattern is present not only in electrical epicardial recordings (Fig. 2-14) but also in optical epicardial recordings (Fig. 2-15), which are not subject to saturation of the amplifiers by the shock as are electrical recordings. This activation pattern may represent epicardial breakthrough of an intramural reentrant circuit caused by a critical point. However, the same focal activation pattern has been observed in three-dimensional transmural electrical recordings with plunge needles, during which an isoelectric window was also observed intramurally.122 This window has also been observed in optical recordings of a thin layer of spared epicardial tissue in which the intramural myocardium was frozen.123
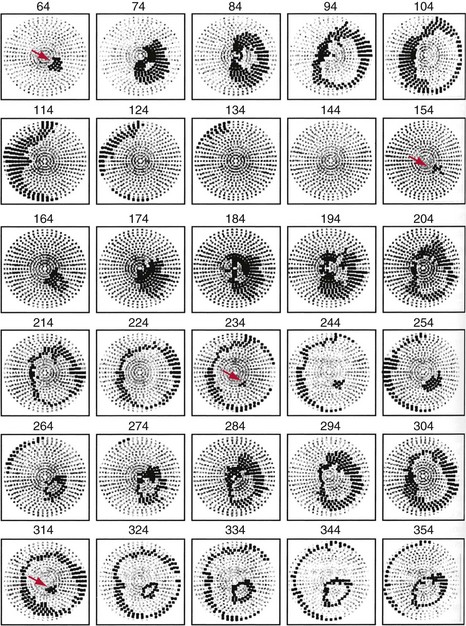
Figure 2-14 Example of postshock cycles after failed shock in pig.
(From Chattipakorn N, Fotuhi PC, Ideker RE: Prediction of defibrillation outcome by epicardial activation patterns following shocks near the defibrillation threshold. J Cardiovasc Electrophysiol 11:1014-1021, 2000.)
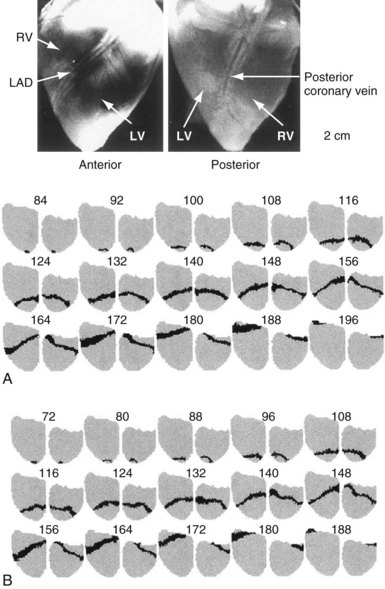
Figure 2-15 Similar activation patterns of postshock cycle 1 after failed (A) and successful (B) shocks.
(From Chattipakorn N, Banville I, Gray RA, Ideker RE: Mechanism of ventricular defibrillation for near-defibrillation threshold shocks: a whole-heart optical mapping study in swine. Circulation 104:1313-1319, 2001.)
Following a failed shock slightly weaker than the DFT, the focal activation pattern is seen for several cycles before the less organized pattern of VF reappears (see Fig. 2-14). However, this same focal activation pattern can be observed for one or more cycles after a successful defibrillation shock (see Fig. 2-15, B). These findings suggest that the failed shock reinitiates VF by causing a trigger (the focus) that interacts with the substrate (the ventricular tissue). If the trigger focus lasts long enough for reentry to develop in the ventricular myocardium substrate, the shock fails. If the trigger focus halts before reentry is induced in the myocardial substrate, the shock succeeds. This concept raises the possibility that cardiac disease or drugs can alter DFT by altering the trigger, the substrate, or both. For example, conditions that increase the number of cycles of the focal trigger or that decrease the cycle length of the trigger might increase DFT. Similarly, conditions that allow more easily induced reentry in the substrate, such as an increased dispersion of refractoriness, could also increase DFT.
Although several mechanisms have been hypothesized, the cause of the focal activations after the shock is not definitively known, nor is it known why increasing the shock electric field decreases the number of focal postshock activations. One hypothesis is that the focus is not a true focus but arises from “tunnel propagation.”124 According to this hypothesis, a small part of a VF activation wavefront is not extinguished but propagates intramurally during the postshock isoelectric window, where it is undetected by three-dimensional mapping because it is so small. When sufficient tissue recovers, it is able to break out as a large wavefront. This wavefront appears to arise focally because the small, slowly propagating tunnel of activation is not detected by mapping. According to this hypothesis, a biphasic waveform has a lower DFT than a monophasic waveform because it decreases the number and size of the tunnels for the same-strength shock. However, the finding at multiple focal cycles is difficult to explain with the tunnel propagation hypothesis; multiple focal cycles, not just one, are present after the shock (see Fig. 2-14).
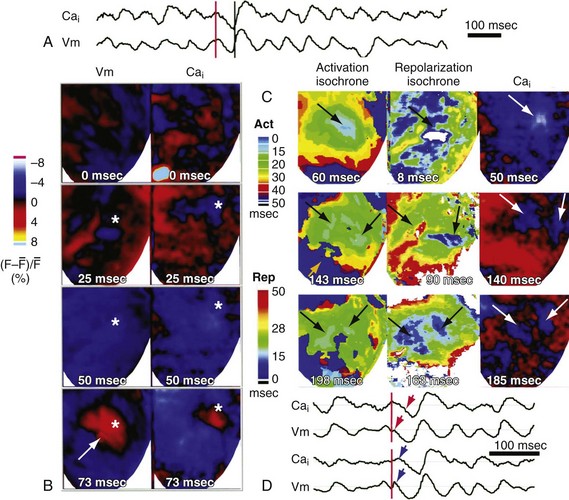
Another hypothesis is that the focal activation arises where an intracellular calcium (Cai) “sinkhole” is present after the shock.123 This hypothesis is based on optical recordings demonstrating that Cai decreases during the isoelectric period in the region where the focus will later appear (Fig. 2-16). After the formation of the sinkhole, the action potential in this region is immediately preceded by an increase in Cai, suggesting the potential arises from triggered activity. According to this hypothesis, a biphasic waveform has a lower DFT than a monophasic waveform because it causes less postshock heterogeneity in Cai.125
In one study the DFT after VF of 10 seconds was significantly decreased by flunarizine, a drug that prevents activity triggered by delayed afterdepolarization (DAD).126 However, another study did not find that DFT after 10 seconds of VF was altered either by flunarizine or by pinacidil, a drug that prevents activity triggered by early afterdepolarization (EAD).127 A third study found that DFT after 20 seconds of VF was not altered by flunarizine, but that DFT was reduced by flunarizine after 7 minutes of VF by 82%.128 This suggests that after long-duration VF, but not short-duration VF, the focal postshock activation may arise from a DAD.
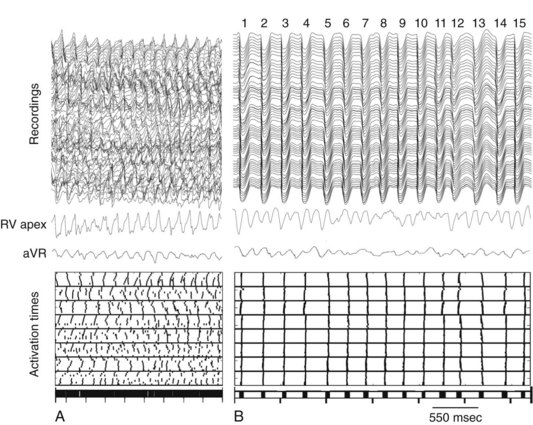
Another finding indicates that the mechanism of defibrillation may differ depending on the duration of VF. The earliest postshock activation after the isoelectric period arises primarily in the working myocardium following VF of about 30 seconds, but arises primarily in Purkinje fibers after VF of 180 seconds.129 These differences in defibrillation after short- versus long-duration VF are probably related to the different characteristics of the activation wavefronts maintaining these short or long VFs.130–132 It has even been reported recently that endocardial ventricular activation is not reentrant but arises focally from Purkinje fibers in up to 30% of cases during long-duration VF133 (Fig. 2-17). This finding raises the startling possibility that to defibrillate long-duration VF, a shock must not only halt reentrant activation wavefronts, but also halt focal, possibly triggered, activity.
1 Beck CS, Pritchard WH, Feil HS. Ventricular fibrillation of long duration abolished by electric shock. JAMA. 1947;135:985-986.
2 Prevost JL, Battelli F. Sur quelques effets des décharges électriques sur le coeur des Mammifères. CRSAS. 1899;129:1267-1268.
3 Zoll PM, Linethal AJ, Gibson W, et al. Termination of ventricular fibrillation in man by externally applied electric countershock. N Engl J Med. 1956;254:727-732.
4 Akiyama T. Intracellular recording of in situ ventricular cells during ventricular fibrillation. Am J Physiol. 1981;240:465-471.
5 Gray RAJalife J, Panfilov AV, et al. Mechanisms of cardiac fibrillation. Science. 1995;270:1222-1223.
6 Swartz JF, Jones JL, Fletcher RD. Characterization of ventricular fibrillation based on monophasic action potential morphology in the human heart. Circulation. 1993;87:1907-1914.
7 Witkowski FX, Penkoske PS, Kavanagh KM. Activation patterns during ventricular fibrillation. In: Zipes DP, Jalife J, editors. Cardiac electrophysiology: from cell to bedside. Philadelphia: Saunders; 1995:539-544.
8 Zhou X, Guse P, Wolf PD, et al. Existence of both fast and slow channel activity during the early stages of ventricular fibrillation. Circ Res. 1992;70:773-786.
9 Chen PS, Shibata N, Wolf PD, et al. Epicardial activation during successful and unsuccessful ventricular defibrillation in open chest dogs. Cardiovasc Rev Rep. 1986;7:625-648.
10 Gray RA, Ayers G, Jalife J. Video imaging of atrial defibrillation in the sheep heart. Circulation. 1997;95:1038-1047.
11 Mower MM, Mirowshi M, Spears JF, Moore EN. Patterns of ventricular activity during catheter defibrillation. Circulation. 1974;49:858-861.
12 Wiggers CJ. The physiologic basis for cardiac resuscitation from ventricular fibrillation: method for serial defibrillation. Am Heart J. 1940;20:413-422.
13 Zipes DP, Fischer J, King RM, et al. Termination of ventricular fibrillation in dogs by depolarizing a critical amount of myocardium. Am J Cardiol. 1975;36:37-44.
14 Chen PS, Wolf PD, Claydon FJIII, et al. The potential gradient field created by epicardial defibrillation electrodes in dogs. Circulation. 1986;74:626-636.
15 Wharton JM, Wolf PD, Smith WM, et al. Cardiac potential and potential gradient fields generated by single, combined, and sequential shocks during ventricular defibrillation. Circulation. 1992;85:1510-1523.
16 Zhou X, Daubert JP, Wolf PD, et al. Epicardial mapping of ventricular defibrillation with monophasic and biphasic shocks in dogs. Circ Res. 1993;72:145-160.
17 Fishler MG, Sobie EA, Thakor NV, Tung L. Mechanisms of cardiac cell excitation with premature monophasic and biphasic field stimuli: a model study. Biophys J. 1996;70:1347-1362.
18 Henriquez CS. Simulating the electrical behavior of cardiac tissue using the bidomain model. Crit Rev Biomed Eng. 1993;21:1-77.
19 Fast VG, Rohr S, Gillis AM, Kléber AG. Activation of cardiac tissue by extracellular electrical shocks: formation of “secondary sources” at intercellular clefts in monolayers of cultured myocytes. Circ Res. 1998;82:375-385.
20 Gillis AM, Fast VG, Rohr S, Kléber AG. Spatial changes in transmembrane potential during extracellular electrical shocks in cultured monolayers of neonatal rat ventricular myocytes. Circ Res. 1996;79:676-690.
21 Plonsey R, Barr RC. Inclusion of junction elements in a linear cardiac model through secondary sources: application to defibrillation. Med Biol Eng Comput. 1986;24:137-144.
22 Moe GK, Abildskov JA, Han J. Factors responsible for the initiation and maintenance of ventricular fibrillation. In: Surawicz B, Pellegrino ED, editors. Sudden cardiac death. New York: Grune & Stratton, 1964.
23 Dillon SM, Mehra R. Prolongation of ventricular refractoriness by defibrillation shocks may be due to additional depolarization of the action potential. J Cardiovasc Electrophysiol. 1992;3:442-456.
24 Wiggers CJ. Studies of ventricular fibrillation caused by electric shock: cinematographic and electrocardiographic observations of the natural process in the dog’s heart—its inhibition by potassium and the revival of coordinated beats by calcium. Am Heart J. 1930;5:351-365.
25 Opthof T, Misier AR, Coronel R, et al. Dispersion of refractoriness in canine ventricular myocardium. Effects of sympathetic stimulation. Circ Res. 1991;68:1204-1215.
26 Worley SJ, Swain JL, Colavita PG, et al. Development of an endocardial-epicardial gradient of activation rate during electrically induced, sustained ventricular fibrillation in dogs. Am J Cardiol. 1985;55:813-820.
27 Ideker RE, Klein GJ, Harrison L, et al. Epicardial mapping of the initiation of ventricular fibrillation induced by reperfusion following acute ischemia. Circulation. 1978;58:II-64.
28 Rogers J.M., Usui M, KenKnight B, et al. Recurrent wavefront morphologies: a method for quantifying the complexity of epicardial activation patterns. Ann Biomed Eng. 1997;25:761-768.
29 Samie FH, Berenfeld O, Anumonwo J, et al. Rectification of the background potassium current: a determinant of rotor dynamics in ventricular fibrillation. Circ Res. 2001;89:1216-1223.
30 Lewis T. The mechanism and graphic registration of the heart beat, ed 3. London: Shaw & Sons; 1925.
31 Gray RA, Jalife J. Self-organizing drifting spiral waves as a mechanism for atrial fibrillation. Circulation. 1996;94:I-94.
32 Newton JC, Evans FG, Chattipakorn N, et al. Peak frequency distribution across the whole fibrillating heart. Pacing Clin Electrophysiol. 2000;23:617.
33 Newton JC, Ideker RE. Estimated global transmural distribution of activation rate and conduction block during porcine and canine ventricular fibrillation. Circ Res. 2004;94:836-842.
34 Allessie M, Kirchhof C, Scheffer GJ, et al. Regional control of atrial fibrillation by rapid pacing in conscious dogs. Circulation. 1991;84:1689-1697.
35 KenKnight BH, Bayly PV, Gerstle RJ, et al. Regional capture of fibrillating ventricular myocardium. Evidence of an excitable gap. Circ Res. 1995;77:849-855.
36 Witkowski FX, Penkoske PA, Plonsey R. Mechanism of cardiac defibrillation in open-chest dogs with unipolar DC-coupled simultaneous activation and shock potential recordings. Circulation. 1990;82:244-260.
37 Bardy GH, Ivey TD, Allen MD, et al. A prospective randomized evaluation of biphasic versus monophasic waveform pulses on defibrillation efficacy in humans. J Am Coll Cardiol. 1989;14:728-733.
38 Block M, Hammel D, Böcker D, et al. A prospective randomized cross-over comparison of mono- and biphasic defibrillation using nonthoracotomy lead configurations in humans. J Cardiovasc Electrophysiol. 1994;5:581-590.
39 Chapman PD, Vetter JW, Souza JJ, et al. Comparison of monophasic with single and dual capacitor biphasic waveforms for nonthoracotomy canine internal defibrillation. J Am Coll Cardiol. 1989;14:242-245.
40 Dixon EG, Tang ASL, Wolf PD, et al. Improved defibrillation thresholds with large contoured epicardial electrodes and biphasic waveforms. Circulation. 1987;76:1176-1184.
41 Gurvich NL, Markarychev VA. Defibrillation of the heart with biphasic electrical impulses. Kardiologiia. 1967;7:109-112.
42 Walcott GP, Melnick SB, Chapman FW, et al. Comparison of monophasic and biphasic waveforms for external defibrillation in an animal model of cardiac arrest and resuscitation. J Am Coll Cardiol. 1995;25:405A.
43 Feeser SA, Tang ASL, Kavanagh KM, et al. Strength-duration and probability of success curves for defibrillation with biphasic waveforms. Circulation. 1990;82:2128-2141.
44 Tang AS, Yabe S, Wharton JM, et al. Ventricular defibrillation using biphasic waveforms: the importance of phasic duration. J Am Coll Cardiol. 1989;13:207-214.
45 Kroll MW. A minimal model of the monophasic defibrillation pulse. Pacing Clin Electrophysiol. 1993;16:769-777.
46 Kroll MW. A minimal model of the single capacitor biphasic defibrillation waveform. Pacing Clin Electrophysiol. 1994;17:1782-1792.
47 Swerdlow CD, Fan W, Brewer JE. Charge-burping theory correctly predicts optimal ratios of phase duration for biphasic defibrillation waveforms. Circulation. 1996;94:2278-2284.
48 Walcott GP, Walker RG, Krassowska W, et al. Choosing the optimum monophasic and biphasic waveforms for defibrillation. Pacing Clin Electrophysiol. 1994;17:789.
49 Blair HA. On the intensity-time relations for stimulation by electric currents. II. J Gen Physiol. 1932;15:731-755.
50 Lapicque L. L’Excitabilite en fonction du temps. Paris: Libraire J Gilbert; 1926. p 371
51 Irnich W. The fundamental law of electrostimulation and its application to defibrillation. Pacing Clin Electrophysiol. 1990;13:1433-1447.
52 Sweeney RJ, Gill GM, Jones JL, Reid PR. Defibrillation using a high-frequency series of monophasic rectangular pulses: observations and model predictions. J Cardiovasc Electrophysiol. 1996;7:134-143.
53 Walcott GP, Walker RG, Cates AW, et al. Choosing the optimal monophasic and biphasic waveforms for ventricular defibrillation. J Cardiovasc Electrophysiol. 1995;6:737-750.
54 Gold MR, Shorofsky SR. Strength-duration relationship for human transvenous defibrillation. Circulation. 1997;96:3517-3520.
55 Schuder JC, Stoeckle H, West JA, Kesar PY. Transthoracic ventricular defibrillation in the dog with truncated and untruncated exponential stimuli. IEEE Trans Biomed Eng. 1971;18:410-415.
56 Walcott GP, Melnick SB, Chapman FW, et al. Comparison of damped sinusoidal and truncated exponential waveforms for external defibrillation. J Am Coll Cardiol. 1996;27:237A.
57 Harbinson MT, Allen JD, Imam Z, et al. Rounded biphasic waveform reduces energy requirements for transvenous catheter cardioversion of atrial fibrillation and flutter. Pacing Clin Electrophysiol. 1997;20:226-229.
58 Hillsley RE, Walker RG, Swanson DK, et al. Is the second phase of a biphasic defibrillation waveform the defibrillating phase? Pacing Clin Electrophysiol. 1993;16:1401-1411.
59 Schuder JC, Rahmoeller GA, Stoeckle H. Transthoracic ventricular defibrillation with triangular and trapezoidal waveforms. Circ Res. 1966;19:689-694.
60 Denman RA, Umesan C, Martin PT, et al. Benefit of millisecond waveform durations for patients with high defibrillation thresholds. Heart Rhythm. 2006;3:536-541.
61 Keane D, Aweh N, Hynes B, et al. Achieving sufficient safety margins with fixed duration waveforms and the use of multiple time constants. Pacing Clin Electrophysiol. 2007;30:596-602.
62 Bardy GH, Marchlinski FE, Sharma AD, et al. Multicenter comparison of truncated biphasic shocks and standard damped sine wave monophasic shocks for transthoracic ventricular defibrillation. Transthoracic Investigators. Circulation. 1996;94:2507-2514.
63 Camacho MA, Lehr JL, Eisenberg SR. A three-dimensional finite element model of human transthoracic defibrillation: paddle placement and size. IEEE Trans Biomed Eng. 1995;42:572-578.
64 Lerman BB, Deale OC. Relation between transcardiac and transthoracic current during defibrillation in humans. Circ Res. 1990;67:1420-1426.
65 Karlon WJ, Eisenberg SR, Lehr JL. Effects of paddle placement and size on defibrillation current distribution: a three-dimensional finite element model. IEEE Trans Biomed Eng. 1993;40:246-255.
66 Block M, Hammel D, Isburch F, et al. Results and realistic expectations with transvenous lead systems. Pacing Clin Electrophysiol. 1992;15:665-670.
67 Tang ASL, Wolf PD, Afework Y, et al. Three-dimensional potential gradient fields generated by intracardiac catheter and cutaneous patch electrodes. Circulation. 1992;85:1857-1864.
68 Tang ASL, Wolf PD, Claydown FJIII, et al. Measurement of defibrillation shock potential distributions and activation sequences of the heart in three-dimensions. Proc IEEE. 1988;76:1176-1186.
69 Chen PS, Wolf PD, Melnick SD, et al. Comparison of activation during ventricular fibrillation and following unsuccessful defibrillation shocks in open-chest dogs. Circ Res. 1990;66:1544-1560.
70 Chattipakorn N, Banville I, Gray RA, Ideker RE. Effects of shock strengths on ventricular defibrillation failure. Cardiovasc Res. 2004;61:39-44.
71 Shibata N, Chen PS, Dixon EG, et al. Epicardial activation after unsuccessful defibrillation shocks in dogs. Am J Physiol. 1988;255:902-909.
72 Walcott GP, Chau WC, Ideker RE, et al. Early activation following shocks delivered in humans: the difference between transvenous and “active can” ICD systems. J Am Coll Cardiol. 1997;29:427A.
73 Crossley GH, Boyce K, Roelke M, et al. A prospective randomized trial of defibrillation thresholds from the right ventricular outflow tract and the right ventricular apex. Pacing Clin Electrophysiol. 2009;32:166-171.
74 Verma A, Kaplan AJ, Sarak B, et al. Incidence of very high defibrillation thresholds (DFT) and efficacy of subcutaneous (SQ) array insertion during implantable cardioverter defibrillator (ICD) implantation. J Interv Card Electrophysiol. 2010;29:127-133.
75 Kommuri NV, Kollepara SL, Saulitis E, et al. Azygos vein lead implantation for high defibrillation thresholds in implantable cardioverter defibrillator placement. Indian Pacing Electrophysiol J. 2010;10:49-54.
76 Walker RG, Walcott GP, Smith WM, Ideker IE. Sites of earliest activation following transvenous defibrillation. Circulation. 1994;90(pt 2):I-447.
77 Cates AW, Wolf PD, Hillsley RE, et al. The probability of defibrillation success and the incidence of postshock arrhythmia as a function of shock strength. Pacing Clin Electrophysiol. 1994;17:1208-1217.
78 Chapman FW, El-Abbaday TZ, Walcott GP, et al. Dysfunction following transthoracic defibrillation shocks in dogs. Pacing Clin Electrophysiol. 1997;20:1128.
79 Reddy RK, Gleva MJ, Gliner BE, et al. Biphasic transthoracic defibrillation causes fewer ECG ST-segment changes after shock. Ann Emerg Med. 1997;30:127-134.
80 DeBruin KA, Krassowska W. Electroporation and shock-induced transmembrane potential in a cardiac fiber during defibrillation strength shocks. Ann Biomed Eng. 1998;26:584-596.
81 Schuder JC, Gold JH, Stoeckle H, et al. Transthoracic ventricular defibrillation in the 100 kg calf with symmetrical one-cycle bidirectional rectangular wave stimuli. IEEE Trans Biomed Eng. 1983;30:415-422.
82 Yabe S, Smith DM, Duabert JP, et al. Conduction disturbances caused by high current density electric fields. Circ Res. 1990;66:1190-1203.
83 Jones JL, Jones RE. Decreased defibrillator-induced dysfunction with biphasic rectangular waveforms. Am J Physiol. 1984;247:H792-H796.
84 Walcott GP, Knisley SB, Zhou X, et al. On the mechanism of ventricular defibrillation. Pacing Clin Electrophysiol. 1997;20:422-431.
85 Clark DM, Rogers JM, Ideker RE, Knisley SB. Intracardiac defibrillation-strength shocks produce large regions of hyperpolarization and depolarization. J Am Coll Cardiol. 1996;27:147A.
86 Zhou X, Wolf PD, Rollins DL, et al. Effects of monophasic and biphasic shocks on action potentials during ventricular fibrillation in dogs. Circ Res. 1993;73:325-334.
87 Daubert JP, Frazier DW, Wolf PD, et al. Response of relatively refractory canine myocardium to monophasic and biphasic shocks. Circulation. 1991;84:2522-2538.
88 Colavita PG, Wolf PD, Smith WM, et al. Determination of effects of internal countershock by direct cardiac recordings during normal rhythm. Am J Physiol. 1986;250:H736-H740.
89 Weidmann S. Electrical constants of trabecular muscle from mammalian heart. J Physiol. 1970;210:1041-1054.
90 Kléber AG, Riegger CB. Electrical constants of arterially perfused rabbit papillary muscle. J Physiol. 1987;385:307-324.
91 Krassowska W, Frazier DW, Pilkington TC, Ideker RE. Potential distribution in three-dimensional periodic myocardium. Part II. Application to extracellular stimulation. IEEE Trans Biomed Eng. 1990;37:267-284.
92 Krassowska W, Pilkington TC, Ideker RE. Potential distribution in three-dimensional periodic myocardium. Part I. Solution with two-scale asymptotic analysis. IEEE Trans Biomed Eng. 1990;37:252-266.
93 Plonsey R, Barr RC. Effect of microscopic and macroscopic discontinuities on the response of cardiac tissue to defibrillating (stimulating) currents. Med Biol Eng Comput. 1986;24:130-136.
94 White JB, Walcott GP, Pollard AE, Ideker RE. Myocardial discontinuities: a substrate for producing virtual electrodes that directly excite the myocardium by shocks. Circulation. 1998;97:1738-1745.
95 Tung L. A bidomain model for describing ischemic myocardial DC potentials. Cambridge: Massachusetts Institute of Technology; 1978.
96 Trayanova N. Discrete versus syncytial tissue behavior in a model of cardiac stimulation. II. Results of simulation. IEEE Trans Biomed Eng. 1996;43:1141-1150.
97 Trayanova N. Discrete versus syncytial tissue behavior in a model of cardiac stimulation. I. Mathematical formulation. IEEE Trans Biomed Eng. 1996;43:1129-1140.
98 Kieval RS, Spear JF, Moore EN. Gap junctional conductance in ventricular myocyte pairs isolated from postischemic rabbit myocardium. Circ Res. 1992;71:127-136.
99 Shaw RM, Rudy Y. Electrophysiologic effects of acute myocardial ischemia: a mechanistic investigation of action potential conduction and conduction failure. Circ Res. 1997;80:124-138.
100 Shaw RM, Rudy Y. Ionic mechanisms of propagation in cardiac tissue: roles of the sodium and L-type calcium currents during reduced excitability and decreased gap junction coupling. Circ Res. 1997;81:727-741.
101 Knisley SB, Blitchington TF, Hill BC, et al. Optical measurements of transmembrane potential changes during electric field stimulation of ventricular cells. Circ Res. 1993;72:255-270.
102 Windisch H, Ahammer H, Schaffer P, et al. Optical multisite monitoring of cell excitation phenomena in isolated cardiomyocytes. Pflugers Arch. 1995;430:508-518.
103 Wikswo JP, Lin SF, Abbas RA. Virtual electrodes in cardiac tissue: a common mechanism for anodal and cathodal stimulation. Biophys J. 1995;69:2195-2210.
104 Zhou X, Ideker RE, Blitchington TF, et al. Optical transmembrane potential measurements during defibrillation-strength shocks in perfused rabbit hearts. Circ Res. 1995;77:593-602.
105 Sommer JR, Scherer B. Geometry of cell and bundle appositions in cardiac muscle: light microscopy. Am J Physiol. 1985;248:H792-H803.
106 Street AM, Plonsey R. Activation fronts elicited remote to the pacing site due to the presence of scar tissue. In: Proc 18th Annu Int Conf IEEE Eng Med Biol Soc. Amsterdam: Piscataway, NJ, Institute of Electrical and Electronics Engineers; 1996.
107 Sharifov OF, Ideker RE, Fast VG. High-resolution optical mapping of intramural virtual electrodes in porcine left ventricular wall. Cardiovasc Res. 2004;64:448-456.
108 Clerc L. Directional differences of impulse spread in trabecular muscle from mammalian heart. J Physiol. 1976;255:335-346.
109 Knisley SB. Transmembrane voltage changes during unipolar stimulation of rabbit ventricle. Circ Res. 1995;77:1229-1239.
110 Efimov IR, Cheng YN, Van Wagoner DR, et al. Virtual electrode-induced phase singularity: a basic mechanism of defibrillation failure. Circ Res. 1998;82:918-925.
111 Efimov IR, Cheng YN, Bierman M, et al. Transmembrane voltage changes produced by real and virtual electrodes during monophasic defibrillation shock delivered by an implantable electrode. J Cardiovasc Electrophysiol. 1997;8:1031-1045.
112 Iyer AN, Gray RA. An experimentalist’s approach to accurate localization of phase singularities during reentry. Ann Biomed Eng. 2001;29:47-59.
113 Knisley SB, Smith WM, Ideker RE. Effect of field stimulation on cellular repolarization in rabbit myocardium. Implications for reentry induction. Circ Res. 1992;70:707-715.
114 Chen PS, Wolf PD, Dixon EG, et al. Mechanism of ventricular vulnerability to single premature stimuli in open-chest dogs. Circ Res. 1988;62:1191-1209.
115 Frazier DW, Wolf PD, Wharton JM, et al. Stimulus-induced critical point: mechanism for electrical initiation of reentry in normal canine myocardium. J Clin Invest. 1989;83:1039-1052.
116 Winfree AT. When time breaks down: the three-dimensional dynamics of electrochemical waves and cardiac arrhythmias. Princeton, NJ: Princeton University Press; 1987.
117 Efimov IR, Cheng Y, Yamanouchi Y, et al. Direct evidence of the role of virtual electrode-induced phase singularity in success and failure of defibrillation. J Cardiovasc Electrophysiol. 2000;11:861-868.
118 Chen PS, Shibata N, Dixon EG, et al. Activation during ventricular defibrillation in open-chest dogs: evidence of complete cessation and regeneration of ventricular fibrillation after unsuccessful shocks. J Clin Invest. 1986;77:810-823.
119 Chattipakorn N, Fotuhi PC, Ideker RE. Prediction of defibrillation outcome by epicardial activation patterns following shocks near the defibrillation threshold. J Cardiovasc Electrophysiol. 2000;11:1014-1021.
120 Chattipakorn N, Banville I, Gray RA, Ideker RE. Mechanism of ventricular defibrillation for near-defibrillation threshold shocks: a whole-heart optical mapping study in swine. Circulation. 2001;104:1313-1319.
121 Wang NC, Lee MH, Ohara T, et al. Optical mapping of ventricular defibrillation in isolated swine right ventricles: demonstration of a postshock isoelectric window after near-threshold defibrillation shocks. Circulation. 2001;104:227-233.
122 Chattipakorn N, Fotuhi PC, Chattipakorn SC, et al. Three-dimensional mapping of earliest activation after near-threshold ventricular defibrillation shocks. J Cardiovasc Electrophysiol. 2003;14:65-69.
123 Hwang GS, Hayashi H, Tang L, et al. Intracellular calcium and vulnerability to fibrillation and defibrillation in Langendorff-perfused rabbit ventricles. Circulation. 2006;114:2595-2603.
124 Constantino J, Long Y, Ashihara T, Trayanova NA. Tunnel propagation following defibrillation with ICD shocks: hidden postshock activations in the left ventricular wall underlie isoelectric window. Heart Rhythm. 2010;7:953-961.
125 Hwang GS, Tang L, Joung B, et al. Superiority of biphasic over monophasic defibrillation shocks is attributable to less intracellular calcium transient heterogeneity. J Am Coll Cardiol. 2008;52:828-835.
126 Chattipakorn N, Ideker RE. Delayed afterdepolarization inhibitor: a potential pharmacologic intervention to improve defibrillation efficacy. J Cardiovasc Electrophysiol. 2003;14:72-75.
127 Zheng X, Walcott GP, Smith WM, et al. Evidence that activation following failed defibrillation is not caused by triggered activity. J Cardiovasc Electrophysiol. 2005;16:1200-1205.
128 Zheng X, Li L, Dosdall DJ, et al. Following long duration ventricular fibrillation, flunarizine greatly reduces the defibrillation threshold and the incidence of refibrillation. Circulation. 2009;120(Suppl 2):1481.
129 Dosdall DJ, Osorio J, Robichaux RP, et al. Purkinje activation precedes myocardial activation following defibrillation after long-duration ventricular fibrillation. Heart Rhythm. 2010;7:405-412.
130 Wiggers CJ. The mechanism and nature of ventricular fibrillation. Am Heart J. 1940;20:399-412.
131 Huang J, Rogers JM, Killingsworth CR, et al. Evolution of activation patterns during long-duration ventricular fibrillation in dogs. Am J Physiol Heart Circ Physiol. 2004;286:H1193-H1200.
132 Huizar JF, Warren MD, Shvedko AG, et al. Three distinct phases of VF during global ischemia in the isolated blood-perfused pig heart. Am J Physiol Heart Circ Physiol. 2007;293:H1617-H1628.
133 Robichaux RP, Dosdall DJ, Osorio J, et al. Periods of highly synchronous, non-reentrant endocardial activation cycles occur during long-duration ventricular fibrillation. J Cardiovasc Electrophysiol. 2010;21:1266-1273.