Principles and Physics
Principles of Doppler Ultrasound
 The Doppler Principle
where
v = the target velocity (blood flow velocity)
c = the speed of sound in tissue
fd = the Doppler frequency shift
f0 = the frequency of the emitted ultrasound from the ultrasound probe
θ = the angle between the ultrasound beam and the direction of the target velocity (blood flow).
As is evident in the second equation, the greater the velocity of the object of interest, the greater the Doppler frequency shift ( Fig. 3-1). Additionally, the magnitude of the frequency shift is directly proportional to the initial emitted frequency. Lower emitted frequencies produce low Doppler frequency shifts, while higher emitted frequencies produce greater Doppler frequency shifts. This phenomenon becomes important with aliasing, as will be discussed later. Furthermore, the only ambiguity in the second equation is that the direction of the ultrasonic signal could refer to either the transmitted or the received beam. By convention, Doppler displays are made with reference to the received beam, however, so if the blood flow and the reflected beam travel in the same direction, the angle of incidence is zero degrees and the cosine is +1. As a result, the frequency of the reflected signal will be higher than the frequency of the emitted signal.
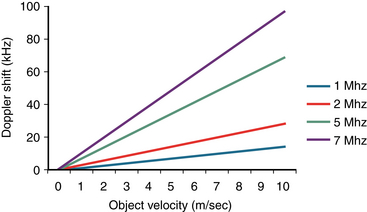
Figure 3-1 Graph of Doppler shift frequency versus velocity for various emitted ultrasound frequencies. A lower emitted ultrasound frequency will produce a lower Doppler frequency shift for a given velocity. This lower Doppler frequency shift will allow for a higher-velocity measurement before aliasing occurs. (From Kahn RA, Skubas N, Fischer G, et al. Intraoperative transesophageal echocardiography. In: Kaplan JA, Reich DL, Savino J, eds. Cardiac Anesthesia. 6th ed. St. Louis: Elsevier; 2011.)
Most modern echo scanners combine Doppler capabilities with their two-dimensional (2D) imaging capabilities. Information on blood flow dynamics can be obtained by applying Doppler frequency shift analysis to echoes reflected by the moving red blood cells.1,2 Blood flow velocity, direction, and acceleration can be instantaneously determined. After the desired view of the heart has been obtained by 2D echocardiography, the Doppler beam, represented by a cursor, is superimposed on the 2D image. The operator positions the cursor as parallel as possible to the assumed direction of blood flow, and then empirically adjusts the direction of the beam to optimize the audio and visual representations of the reflected Doppler signal. At the present time, Doppler technology can be utilized in at least four different ways to measure blood velocities: pulsed, high repetition frequency, continuous wave, and color flow.
 Pulsed Wave Doppler (PWD)
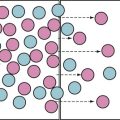
In pulsed wave Doppler (PWD), blood flow parameters can be determined at precise locations by emitting repetitive short bursts of ultrasound at a specific frequency (pulse repetition frequency, or PRF) and analyzing the frequency shift of the reflected echoes at an identical sampling frequency (fs) ( Fig. 3-2). A time delay between emission of the ultrasound signal burst and sampling of the reflected signal determines the depth at which the velocities are sampled; the delay is proportional to the distance between the transducer and the location of the velocity measurements. To sample at a given depth (D), sufficient time must be allowed for the signal to travel a distance of 2 × D (from the transducer to the sample volume and back).
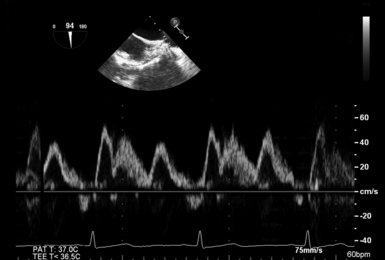
Figure 3-2 Example of pulse wave Doppler. Blood flow parameters can be determined at precise locations within heart by emitting repetitive short bursts of ultrasound at a specific frequency and analyzing frequency shift of reflected echoes at an identical sampling frequency. This example shows blood flow velocity spectrum of right upper pulmonary vein.
The inherent limitation to measurement of flows at precise locations is that ambiguous information is obtained when flow velocity is very high. Information theory suggests that an unknown periodic signal must be sampled at least twice per cycle to determine even rudimentary information such as the fundamental frequency; therefore, the rate of PRF of PWD must be at least twice the Doppler shift frequency produced by flow. 3 If not, the frequency shift is “undersampled.” In other words, this frequency shift is sampled so infrequently, the frequency reported by the instrument is erroneously low. 4

The expression fs/2 is also known as the Nyquist limit. Doppler shifts above the Nyquist limit will create artifacts described as “aliasing” or “wraparound,” and blood flow velocities will appear in a direction opposite to the conventional one ( Fig. 3-3). Blood flowing with high velocity toward the transducer will result in a display of velocities above and below the baseline. The maximum velocity that can be detected without aliasing is dictated by:
where
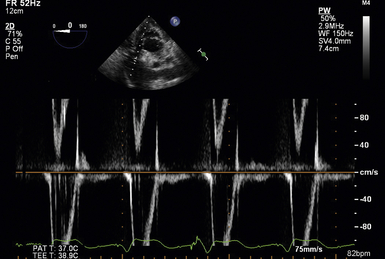
Figure 3-3 Example of aliasing. When Doppler shift becomes close to pulse repetition frequency, artifacts described as “aliasing” or “wraparound” are created. Blood flow velocities will appear in a direction opposite to conventional one.
Vm = the maximal velocity that can be unambiguously measured
c = the speed of sound in tissue
R = the range or distance from the transducer at which the measurement is to be made
Based on this equation, this “aliasing” artifact can be avoided by either minimizing R or f0. Decreasing the depth of the sample volume in essence increases fs. This higher sampling frequency allows for the more accurate determination of higher Doppler shift frequencies (i.e., higher velocities). Furthermore, since f0 is directly related to fd (see equation 2), a lower emitted ultrasound frequency will produce a lower Doppler frequency shift for a given velocity (see Fig. 3-1). This lower Doppler frequency shift will allow for a higher-velocity measurement before aliasing occurs.
 High Pulse Repetition Frequency Doppler (HPRF)
 Color Flow Doppler (CFD)
Advances in technology have allowed the display of real-time blood flow within the heart as colors, while also showing 2D images in black and white. In addition to showing the location, direction, and velocity of cardiac blood flow, images produced by these devices allow estimation of flow acceleration and differentiation of laminar and turbulent blood flow. CFD echocardiography is based on the principle of multigated PWD, in which blood flow velocities are sampled at many locations along many lines covering the entire imaging sector. 5 At the same time, the sector also is scanned to generate a 2D image.
Flow toward the transducer (top of image sector) is commonly assigned the color red and flow away from the transducer is assigned the color blue ( Fig. 3-4). This color assignment is arbitrary and determined by the equipment’s manufacturer and the user’s color mapping. In the most common color flow coding scheme, the faster the blood flow velocity (up to a limit), the more intense the color displayed. Flow velocities that change by more than a preset value within a brief time interval (flow variance or acceleration) may have an additional hue added. Both rapidly accelerating laminar flow (change in flow speed) and turbulent flow (change in flow direction) satisfy the criteria for rapid changes in velocity.
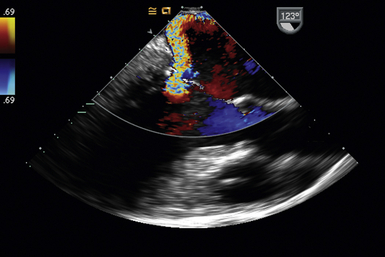
Figure 3-4 Color flow Doppler. Flow toward transducer is assigned the color red, and flow away from transducer is assigned the color blue. Flow variance or acceleration is represented by an additional hue. This example shows a mid-esophageal long-axis view; regurgitant flow through mitral valve can be seen.
 Continuous Wave Doppler (CWD)
The continuous wave Doppler (CWD) technique uses continuous rather than discrete pulses of ultrasound waves ( Fig. 3-5). During CW ultrasound, waves are continuously being both transmitted and received by separate transducers. As a result, the region in which flow dynamics are measured cannot be localized precisely. Because of the large range of depths being simultaneously insonated, a large range of frequencies is returned to the transducer. This large frequency range corresponds to a large range of blood flow velocities known as spectral broadening. Spectral broadening during CWD interrogation contrasts the homogenous envelope obtained with PWD ( Fig. 3-6). Since the sampling frequency is very high, blood flow velocity is measured with great accuracy even at high flows. CWD is particularly useful for evaluating patients with stenotic valvular lesions or congenital heart disease, in whom high-pressure/high-velocity signals are anticipated. It also is the preferred technique when attempting to derive hemodynamic information from Doppler signals.
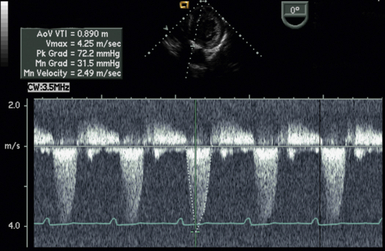
Figure 3-5 During continuous wave Doppler ultrasound, waves are continuously being both transmitted and received by separate transducers, allowing for measurement of high-velocity blood flow (at the expense of spatial specificity). In this example, a deep transgastric view is used to insonate high-velocity blood flow through aortic valve in patient with aortic stenosis.
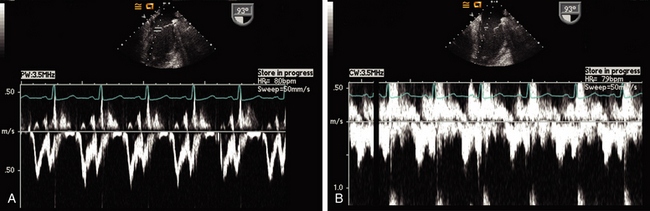
Figure 3-6 Spectral broadening. Pulse wave Doppler (PWD) versus continuous wave Doppler (CWD). Both images are Doppler spectra through mitral valve. A, PWD. Since a specific region of interest is defined by the Doppler gate, a clean envelope of transmitral flow is displayed. B, CWD. Since spatial specificity is lost, spectral broadening of velocities is displayed.
 Determination of Tissue Movement: Tissue Doppler and Speckle Analysis
Spectral Doppler is commonly used to determine blood flow velocities. Because these velocities are relatively high and the amplitude of the Doppler signal is low, high-amplitude/low-velocity ultrasound signals usually are ignored. In contrast, during tissue Doppler examination, the primary interest is in the high-amplitude/low-velocity ultrasound signals created by the myocardium; low-amplitude/high-velocity signals are ignored. Doppler tissue imaging (DTI) of the mitral valve annulus may be used to judge diastolic function. 6 Most modern ultrasound machines have presets optimized for tissue Doppler analysis to include the high-amplitude/low-velocity signals that normally are excluded.
References
1. Hatle, L., Angelsen, B. Doppler Ultrasound in Cardiology, 2nd ed. Philadelphia: Lea & Febiger; 1984.
2. Kisslo, J., Adams, D., Mark, D. B. Basic Doppler Echocardiography. New York: Churchill Livingstone; 1986.
3. Evans, D. H., McDicken, W. N., Skidmore, R., et al. Doppler Ultrasound: Physics Instrumentation and Clinical Applications. New York: John Wiley & Sons; 1989.
4. Hendee, W. R., Ritenour, E. R. Medical Imaging Physics Fourth Edition. New York: Wiley-Liss; 2002.
5. Kisslo, J., Adams, D. B., Belkin, R. N. Doppler ColorFlow Imaging. New York: Churchill Livingstone; 1988.
6. Ommen, S. R., Nishimura, R. A. A clinical approach to the assessment of left ventricular diastolic function by Doppler echocardiography: Update 2003. Heart. 2003; 89(Suppl III):iii18–iii23.