7 Primary Glaucoma
CLASSIFICATION OF GLAUCOMA
Glaucoma may be classified as primary when the cause of the disease is unknown, or secondary when an increase in IOP occurs secondary to another ocular disease. Primary glaucomas may be further subdivided, as shown in Table 7.1.
INTRAOCULAR PRESSURE
The concept of ‘normal’ IOP is based on a population survey in Europe where readings were assumed to be normally distributed and two standard deviations above the mean gave a normal upper limit of 21 mmHg, implying that only 2.5% of normal people would be expected to have ‘increased’ IOP. However, ‘normal’ IOP is not normally distributed but skewed to the right and as a result a greater proportion of the normal population has an IOP exceeding 21 mmHg than was predicted initially. This right skew increases with age and varies by race; for example, mean IOP in Japan is 11.6 mmHg but that in Barbados is 18.1 mmHg. IOP tends to be higher in older people. Measurement of IOP by methods that applanate the cornea (see Ch. 1) is affected by central corneal thickness which varies between people. The Goldmann applanation tonometer assumes a central corneal thickness of 520 μm; applanation underestimates IOP with thinner corneas and overestimates IOP with thicker corneas. As a rule increased corneal thickness of 10 μm artefactually increases the IOP by 1 mm and similarly underestimates IOP in thin corneas. This is of considerable importance after laser corneal refractive surgery. The factors that regulate IOP are those that alter the rate of aqueous production or outflow resistance.
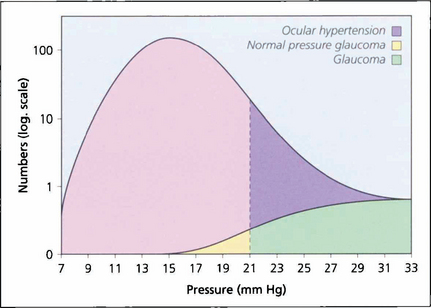
Fig. 7.1 In a population survey of 2000 Caucasian males aged over 40 years, the normal mean IOP was found to be 16.0 mmHg with a standard deviation of 2.5 mmHg. Two standard deviations from the mean is 21 mmHg, which is usually regarded as the (statistical) upper limit for normal IOP; however, the distribution is skewed with a longer tail to the right, and most of these people have ocular hypertension. Glaucoma patients with an IOP lower than 21 mmHg are regarded as having normal pressure glaucoma; above this level they have either ocular hypertension or glaucoma.
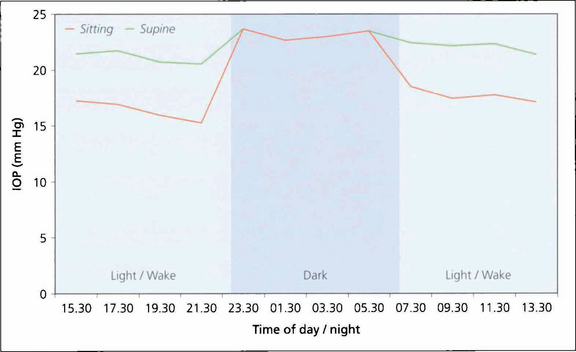
Fig. 7.2 Diurnal pressure curves show that IOP is dependent on posture and time of day. IOP is always higher when supine in comparison to an erect posture. This graph shows that during the day IOP is always lower when erect than when supine. (Night time measurements of IOP were only taken in the supine position). IOP tends to be higher in the mornings than later in the day. IOP also varies seasonally, being slightly higher in winter. Whatever the mechanisms regulating IOP the end result is that the two eyes of an individual usually have a similar IOP.
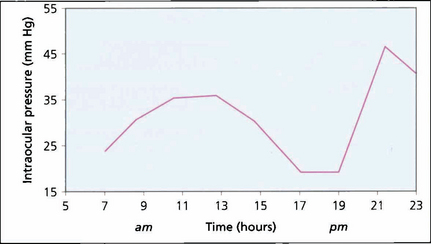
Fig. 7.3 Variation in IOP during the day is often exaggerated in patients with POAG, clearly illustrated by the 2-hourly pressure readings of the right eye of this patient. Note the ‘normal’ levels from 17.00 to 19.00 hours and the rapid pressure rise between 19.00 and 21.00 hours. It is obviously necessary to have frequent IOP measurements to manage patients with disease progression despite ‘controlled’ IOP. Glaucoma surgery significantly dampens diurnal curves.
AQUEOUS HUMOUR FORMATION AND OUTFLOW
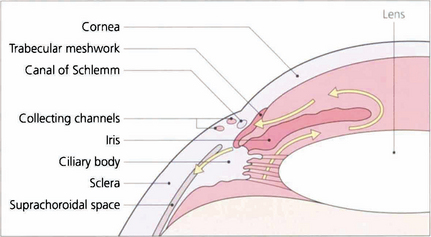
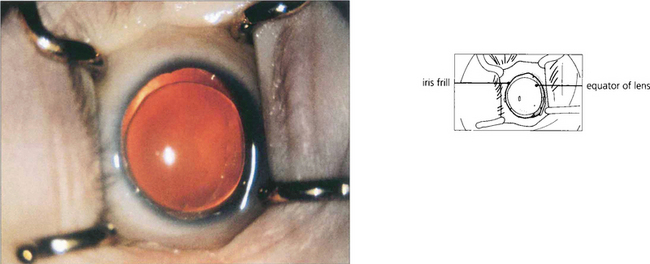
Fig. 7.4 Aqueous is secreted by the ciliary epithelium and flows past the equator of the lens through the posterior chamber and the pupil to reach the anterior chamber. Aqueous leaves the anterior chamber and enters the canal of Schlemm by the trabecular meshwork. It then passes into collector channels and aqueous veins to reach the episcleral veins. Resistance to flow is greatest at the trabecular meshwork. A proportion of aqueous also leaves the eye by draining into the suprachoroidal space and is known as the uveoscleral or nonconventional outflow pathway.
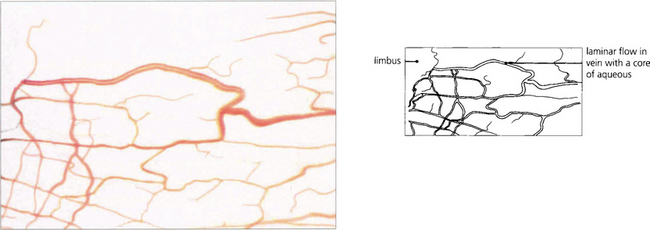
Fig. 7.5 Aqueous humour passes through the canal of Schlemm to drain into collector channels (in the sclera) which empty into the conjunctival veins. This anastomosis can be seen as ‘aqueous’ veins in the conjunctiva.
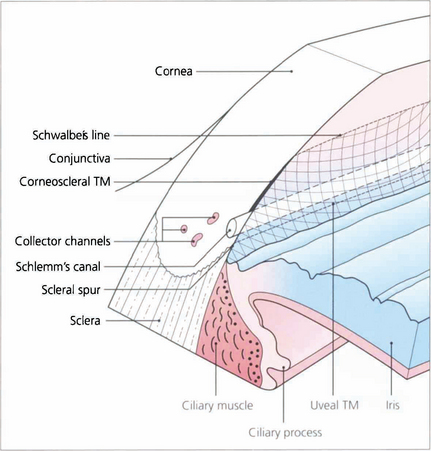
Fig. 7.6 The trabecular meshwork has an inner lamellated and an outer nonlamellated cribriform (juxtacanalicular) region. The lamellated meshwork is further divided into a uveal portion (between scleral spur and iris root) and a corneoscleral portion (between cornea and scleral spur). The lamellated region is made up of connective tissue plates with a core of elastic and collagen fibres covered by trabecular cells. The juxtacanalicular region has no collagen beams and consists of an elastic network and layers of cells (cribriform cells) within an extracellular matrix. The ciliary muscle tendon inserts into the inner meshwork and scleral spur.
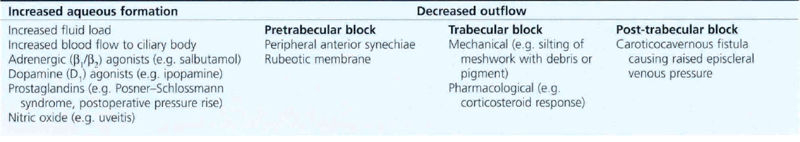
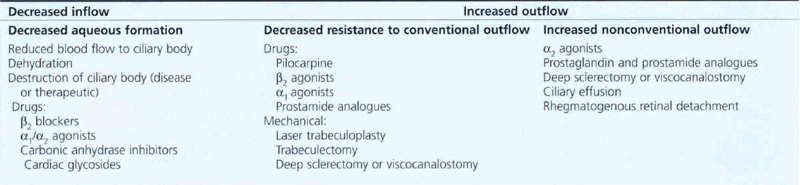
Table 7.2 lists the factors that potentially cause an increase in IOP; these include increased ciliary epithelial production of aqueous, an altered blood–retinal barrier and, more commonly, increased resistance of the conventional outflow channels. Table 7.3 shows factors that may cause a decrease in IOP: decreased aqueous production, structural alterations in the conventional outflow channels, and an increase in outflow by nonconventional routes.
PRIMARY OPEN ANGLE GLAUCOMA
PATHOGENESIS OF GLAUCOMA
Trabecular meshwork

Fig. 7.8 (Left) Scanning electron micrograph showing an en face view of the normal meshwork from the anterior chamber. (Right) Transmission electron micrograph showing details of the meshwork bordering Schlemm’s canal (SC)in a normal eye. Aqueous enters the canal as a result of the formation of giant vacuoles (GV) that rupture into the canal.
Reproduced with permission from Johnson J. Glaucoma 2001, pp 55–67.
Optic nerve damage
A vascular mechanism may have several components relating to systemic blood pressure (BP), local vascular damage and autoregulation. The concept of ‘perfusion pressure’ (mean BP minus IOP) is important in describing the potential effect of either raised IOP or low BP, particularly in the nocturnal hypotension that affects some patients. A primary vessel defect or poor autoregulation involving the short posterior ciliary arteries and the circle of Zinn–Haller that supply the laminar region (see Ch. 17) could cause local vascular insufficiency. Vascular insufficiency may directly damage neurones through ischaemia, hypoxia, or indirectly by activation of astrocytes.
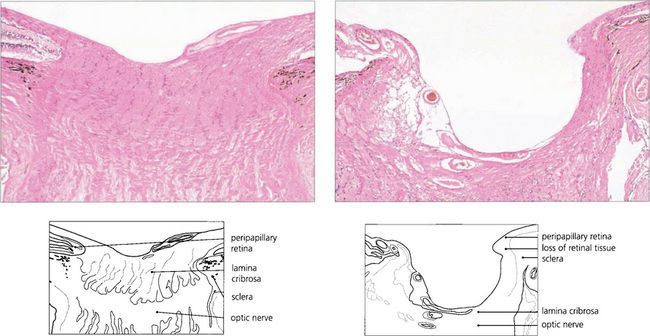


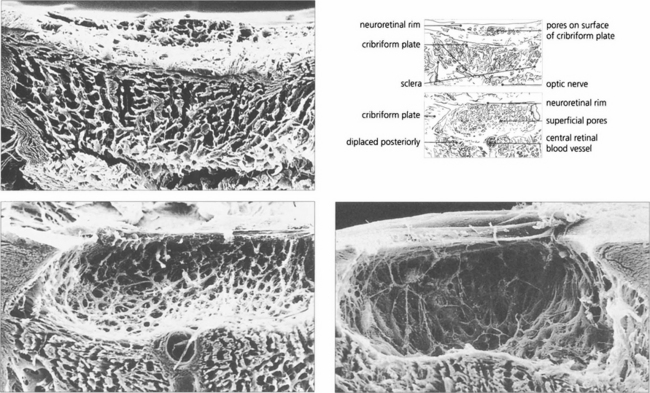
Fig. 7.10 A coronal digest preparation demonstrates the pores in the lamina cribrosa through which the retinal axons pass. The pores have a larger diameter with less supporting collagenous tissue superiorly and inferiorly; this is the area in which glaucomatous visual field damage initially occurs.
Reproduced from Arch Ophthalmol 1990; 108: 51–143.
ASSESSMENT OF THE EYE WITH PRIMARY OPEN ANGLE GLAUCOMA
Key components for assessment of the glaucomatous eye are: IOP measurement, gonioscopy, examination of the optic disc and retinal nerve fibre layer and visual field examination. The techniques of IOP measurement and gonioscopy are covered in Ch. 1.
Gonioscopy
Table 7.4 describes angle grading, derived from Scheie and Shaffer.
| Angle grade | Angle width | Description |
|---|---|---|
| 4 | 35–45° | Wide open |
| 3 | 20–35° | Open |
| 2 | 20° | Apex of angle not visible, scleral spur visible |
| 1 | 10° | Posterior half of meshwork not visible, spur not visible, Schwalbe’s line visible |
| 0 | 0° | No angle structures seen |
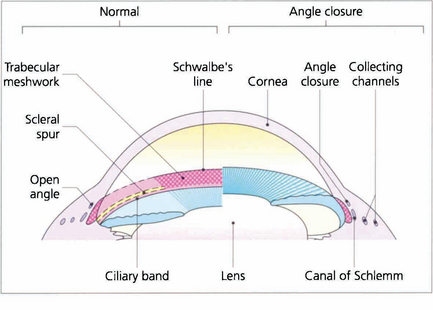
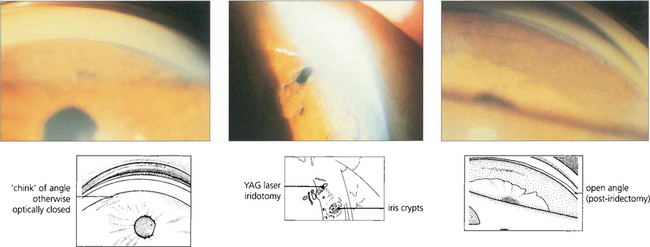
Fig. 7.12 Different systems of grading ‘openness’ of the angle have been suggested. In clinical practice it is necessary to know whether: (i) the angle is open and incapable of closure; (ii) the angle is open, but could potentially close (i.e. is narrow); (iii) the angle is closed; and (iv) if peripheral anterior synechiae (PAS) are present in part or throughout. This composite diagram correlates the gonioscopic and microscopic appearances of the angle of the anterior chamber when both ‘open’ and ‘closed’ and shows the relationship of the trabecular meshwork to the surrounding cornea, ciliary body and canal of Schlemm
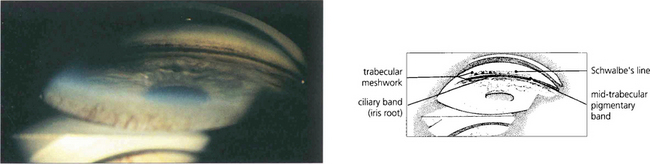
Fig. 7.13 A goniophotograph of the angle of the anterior chamber in a patient with pigmentary glaucoma shows extensive pigment deposition at the trabecular meshwork so that the angle details are more clearly visible. The trabecular meshwork extends from the anterior pigment deposition (uppermost in this picture) to the ciliary band (anterior iris root). There is a sharply defined midtrabecular band of pigment.
Optic disc
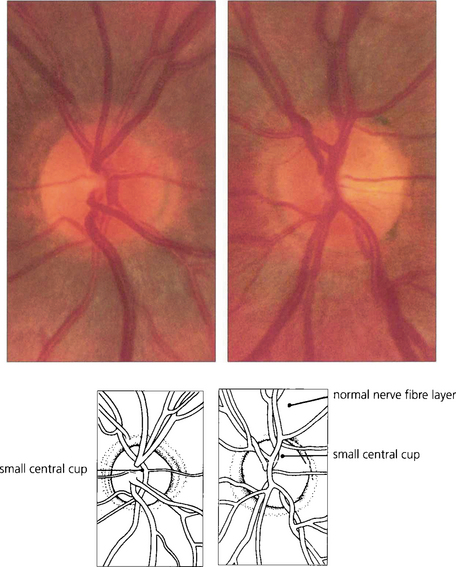
Fig. 7.14 Both optic discs of this patient are normal, being symmetrical in appearance with similar overall dimensions, shape, colour and contour and having a clearly visible and full retinal nerve fibre layer. A small physiological cup of about 0.2 vertical ratio is present in each optic disc.
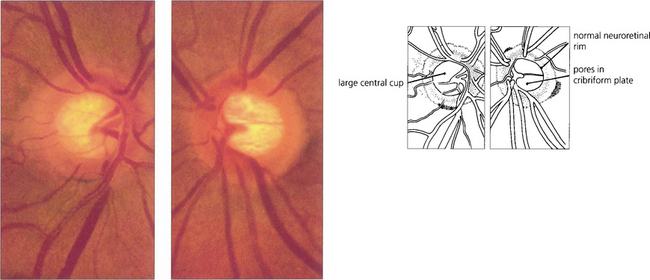
Fig. 7.15 The physiological cup varies in size from patient to patient and is dependent on the overall dimensions of the scleral canal; eyes with large scleral canals tend to have larger discs and larger cups. In this patient, the optic discs and cups are large but normal and the physiological shape of the rim is maintained. The two eyes of this individual are symmetrical (cup:disc ratio difference <0.2), the neuroretinal rim is pink and the retinal nerve fibre layer is intact.
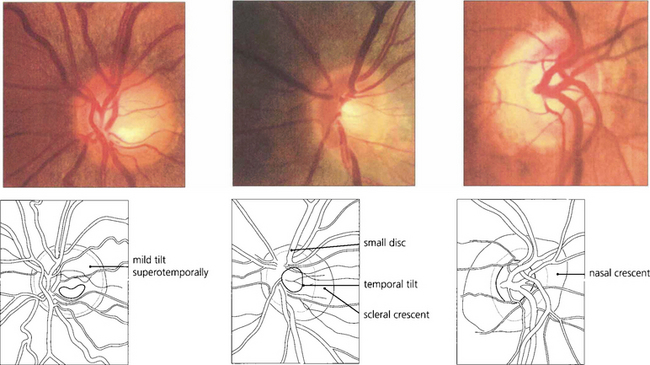
Fig. 7.16 When the disc is tilted, the neuroretinal rim is broader and slopes gently in the direction of tilt and is thinner and more sharply defined opposite this. The most common direction of tilt is in the inferotemporal direction. (Left) A gentle superotemporal tilt; (centre) a temporal tilt with the gentle slope temporally and a temporal ‘scleral crescent’ that is typical in myopic eyes; and (right) a nasal tilt in which the rim appears thinner and more sharply defined throughout the circumference of the disc. These are all normal variants.
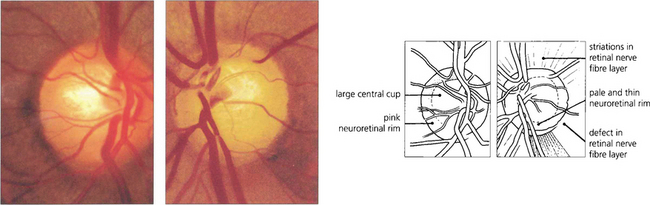
Fig. 7.17 Although the right optic disc of this patient is normal, the left shows evidence of glaucomatous change. A comparison of the two discs reveals that the optic cup in the left eye is vertically elongated; there is loss of the neuroretinal rim at the 5 o’clock position; and pallor of the rim in the inferotemporal quadrant. Visibilty of the retinal nerve fibre layer is less clear adjacent to the deficient neuroretinal rim and here the retina is darker. Unless the disc is tilted, or has an unusual shape, the neuroretinal rim is usually thickest in the Inferotemporal part of the disc, followed by the Superotemporal, then the Nasal and then the Temporal part (the ‘ISNT rule’). Acquired change secondary to chronic glaucoma is suggested by asymmetry between the two optic discs and thinning of the neuroretinal rim so that the physiological shape of the rim is lost.
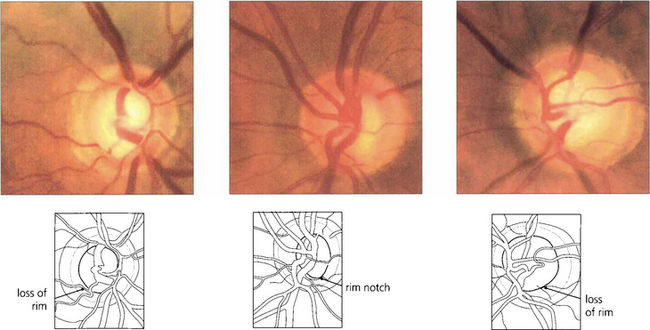
Fig. 7.18 Thinning of the neuroretinal rim is defined by contour, not by colour. The thinning may be diffuse, focal or a combination of the two. The remaining neuroretinal rim usually maintains its colour. (Left) The inferotemporal rim is thinner than the nasal rim so that the physiological shape (ISNT rule) of the rim is lost. (Middle) Focal thinning of the rim has caused a ‘notch’. (Right) Diffuse thinning of the rim and focal thinning at the inferior pole is associated with a retinal nerve fibre layer defect. Small optic discs with very shallow cups develop ‘saucerized cupping’ when neuroretinal tissue is lost: the central depression maintains its colour and damage is easily missed unless the contour of the disc is examined stereoscopically. Peripapillary atrophy is associated with glaucomatous optic neuropathy and may enlarge as the disease progresses.
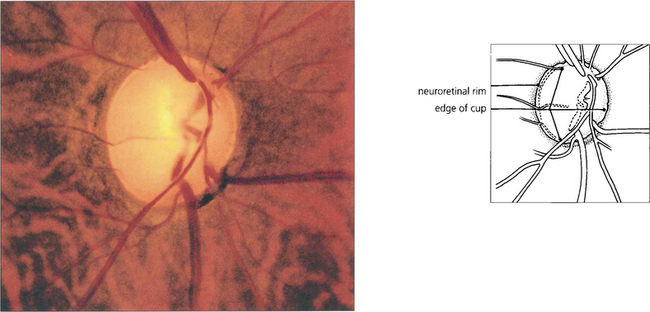
Fig. 7.19 Advanced glaucomatous cupping in the right eye. There is a marked enlargement of the cup, together with extreme attenuation of the neuroretinal rim and undermining of its margin. The cribriform plate is exposed and bowed posteriorly. The cup:disc ratio is almost 100 per cent.
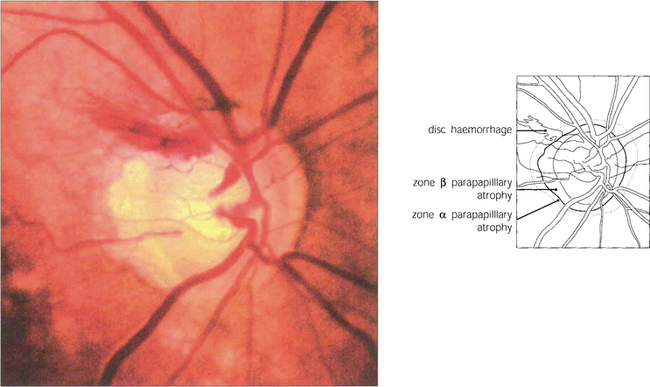
Fig. 7.20 This disc shows an unusually large superotemporal splinter haemorrhage. The inferotemporal quadrant of the neuroretinal rim is the most frequent site of sphincter haemorrhage. Disc haemorrhages are more common in patients with normal tension glaucoma. Recurrent haemorrhages are not uncommon and may be followed by field defects.
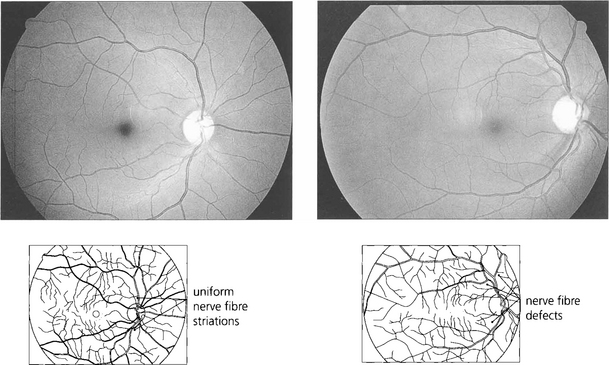
Fig. 7.21 Red-free photography demonstrates the retinal nerve fibre layer more clearly than conventional colour photography (top). An intact nerve fibre is seen in. With glaucoma, nerve fibre loss may be diffuse (the nerve fibre layer becomes less visible), focal (wedge-shaped defects) or combined. Nerve fibre loss is best seen adjacent to the poles of the optic disc where nerve fibre striations are usually most prominent. In this patient focal wedge-shaped defects extend to the optic disc margin.
Imaging technologies
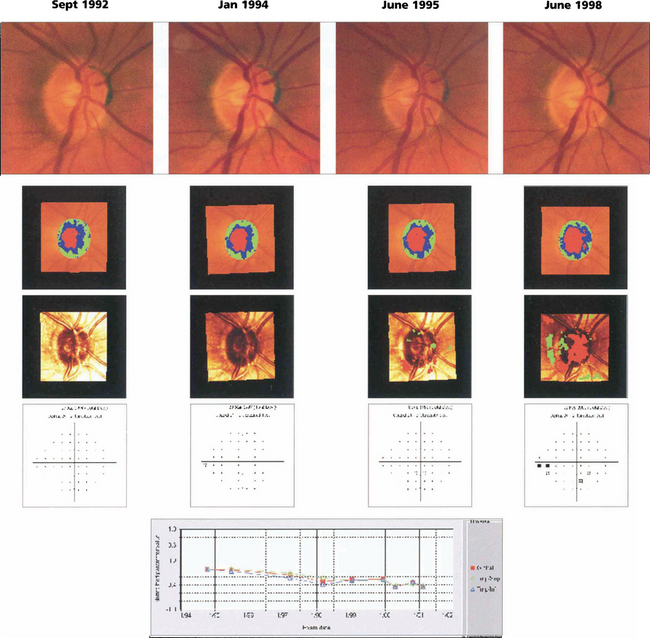
Fig. 7.22 The right eye of a 62-year-old man with ocular hypertension who was followed for 7 years. Optic disc photography shows subtle thinning of the superior rim and changes in the kink of the inferior temporal vein over this time period indicating minor tissue loss in these areas. Images taken with the Heidelberg scanning laser ophthalmoscope illustrate the change in the rim area (green and blue shading) over this time. Surface height changes are shown in the third row (red indicates significant depression, green elevation) and the visual field changes are shown in the fourth row. These show subtle visual loss 6 years later. Numerical values for rim area are plotted against time. Note that optic disc changes are visible before visual field loss.
Visual function
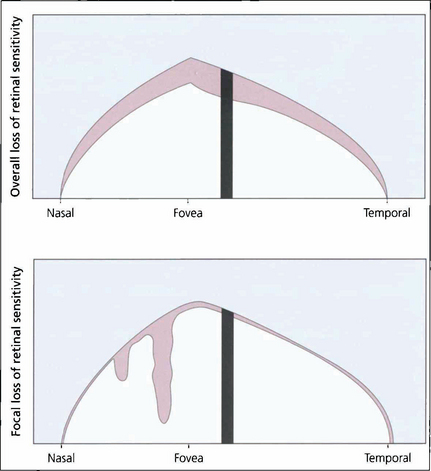
Fig. 7.23 Computerized perimetry measures the retinal sensitivity at selected points within the island of vision. Common statistical indices calculated are for overall loss of retinal sensitivity (mean deviation; MD) and focal loss of sensitivity (pattern standard deviation; PSD) relative to age-matched normal values. The indices simplify the sequential interpretation of visual field changes.
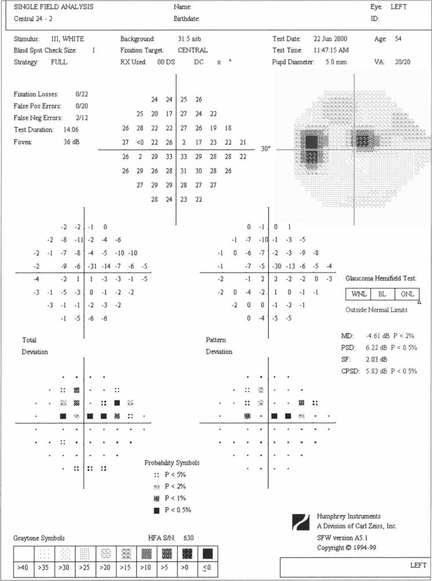
Fig. 7.24 A single test result from the Humphrey computer assisted perimeter showing an upper arcuate defect in the left eye on the 24-2 grid with its ‘stat pac’ analysis. The print out gives details of age and optical correction used and indicates patient reliability (fixation losses, false-positive and false-negative responses). Absolute values of retinal sensitivity at each point (upper numerical grid in decibels) are compared with age-matched normal values (‘total deviation’) for each point in the grid. Pattern deviation is a measure of focal loss corrected for generalised loss of sensitivity and is therefore a more specific indicator of glaucomatous damage. These are expressed both numerically and as probability maps, with the ‘global indices’ MD and PSD reflecting total and pattern deviation respectively. The ‘Glaucoma Hemifield Test’ is an analysis of the symmetry between upper and lower hemifields, reported as within normal limits, borderline or outside normal limits (see Ch. 1).
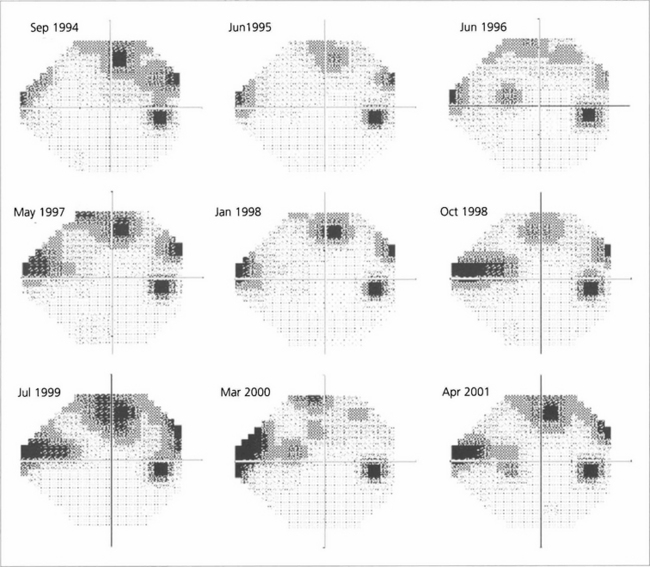
Fig. 7.25 A sequence of Humphrey grey-scale printouts from a 65-year-old woman with glaucoma in the right eye followed from September 1994 to April 2001. Fluctuation makes it difficult to determine whether the field is stable or progressing without statistical analysis.
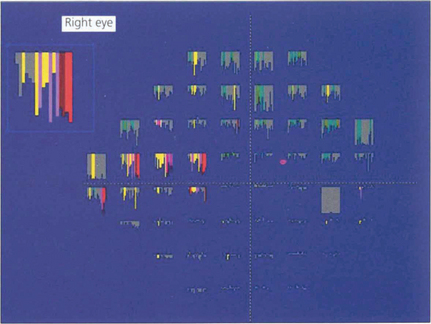
Fig. 7.26 The change in retinal sensitivity at each point over time can be compared using linear regression analysis for each of the 76 test locations in the 24-2 test using software known as ‘Progressor’. The series of bars denotes each test in sequence from left to right. The longer the bar, the greater the sensitivity loss, with the probability that change is significant indicated by colour; red and white bars denote the highest probability. In the same patient as Fig. 7.28, several locations in the arcuate and nasal regions show significant change.
TREATMENT
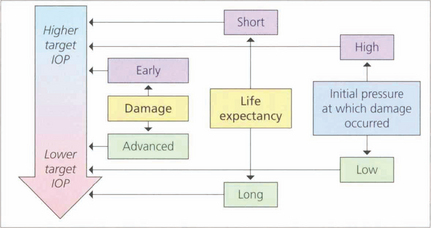
Fig. 7.27 The goal of glaucoma management is to slow the progression of the disease in order to prevent visual loss that impairs the patient’s quality of life. At present the only modifiable factor proven to slow disease progression is IOP reduction and this can be targetted at a level ranging from the low teens to the mid twenties. Deciding on a ‘target IOP’ involves estimating such factors as the rate of disease progression, life expectancy and the risk of vision loss in each patient and needs to be updated in the light of clinical findings. Some patients with ocular hypertension are given ‘prophylactic’ treatment if the IOP is considered sufficiently high that there is a risk of glaucomatous damage or central retinal vein occlusion.
By courtesy of the European Glaucoma Society.
Laser trabeculoplasty
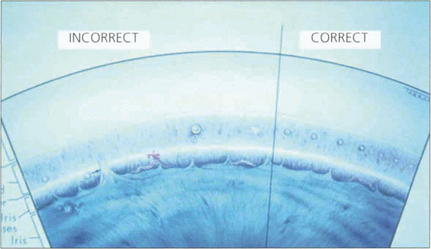
Fig. 7.28 This diagram of the angle and trabecular meshwork shows the varying responses seen following laser treatment. These range from (on the left) malpositioned treatment, excess treatment (large bubble formation and later synechial adhesion of the iris) to insufficient treatment. The right side shows the appearances seen with adequate treatment (blanching of the meshwork).
Medical therapy
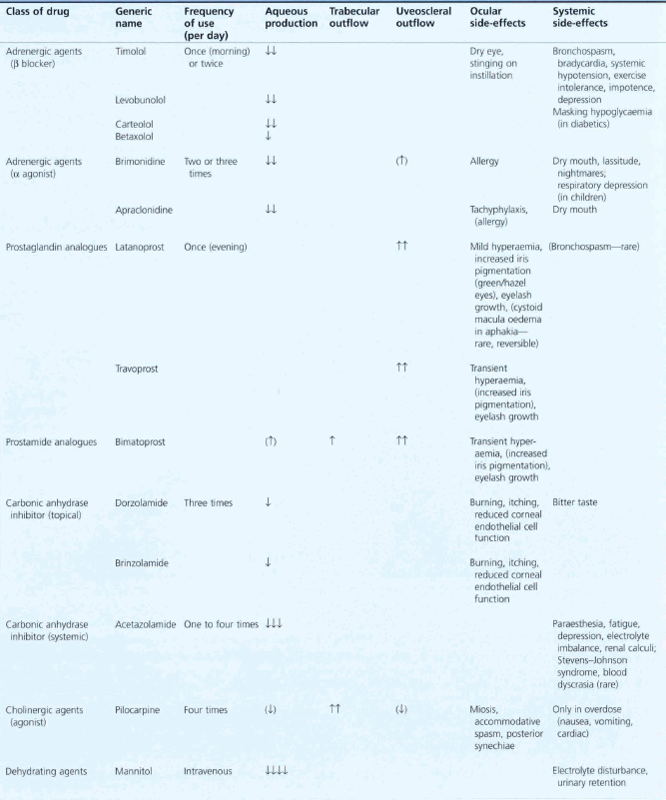
In the developed world medical therapy is usually the first line of treatment provided the patient is able to comply. Choice of drug is governed by the drop potency, ease of use (delivery and frequency), side-effect profile (topical and systemic), cost and when used in combination treatment, mechanism of action. When combination therapy is needed patients are most likely to comply with the simplest regimen. Table 7.5 outlines the various regimens that may be used together with their adverse effects.
Surgery
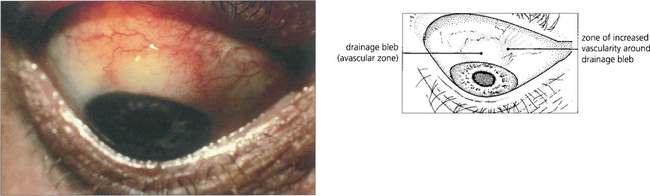
Fig. 7.30 Following a trabeculectomy this patient developed a limbal filtration bleb at the 12 o’clock position. Notice the relatively avascular central area and surrounding blood vessels, indicating a successfully established bleb. Vascularization of the whole bleb is usually a sign of failure with loss of control of IOP.
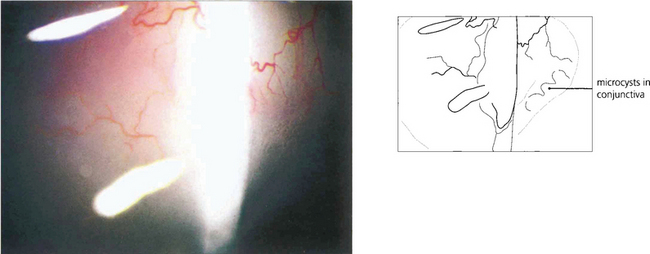
Fig. 7.31 Microcyst formation in the conjunctiva over the bleb (to the right of the beam) is a good indication that it is functioning.
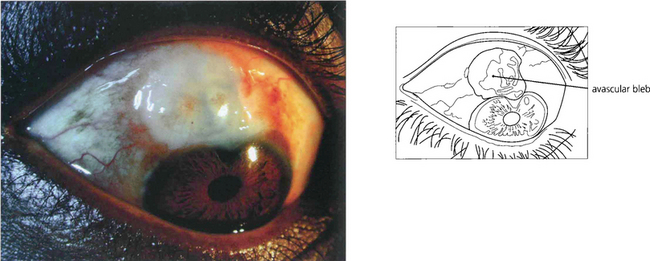
Fig. 7.32 Antiscarring treatment, particularly with mitomycin C, can produce a very thin translucent and avascular bleb. Such eyes have a substantial risk of postoperative hypotony or late bleb infection.
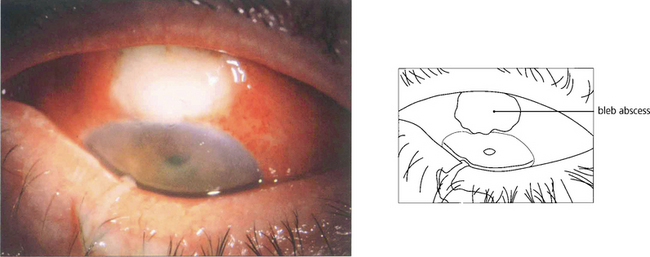
Fig. 7.33 A thin-walled bleb that has become infected and filled with pus causing endophthalmitis. Endophthalmitis is more frequent in diabetics, after the use of adjunctive antiproliferative agents, in thin-walled or leaking blebs and with blebs in the interpalpebral fissure. Trabeculectomies should be performed between the 11 and 1 o’clock positions and never inferiorly.
By courtesy of Mr T Wells.
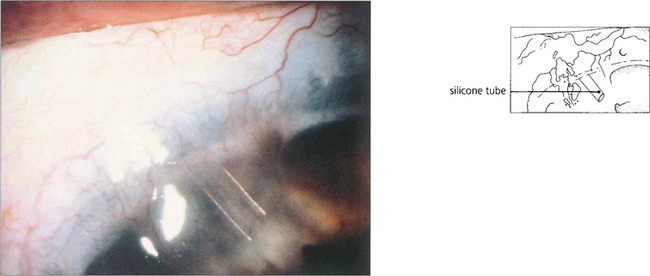
Fig. 7.34 Tube and plate surgery increases the area for aqueous absorption and bypasses increased resistance from postoperative subconjunctival fibrosis. A silicone tube connected to a drainage plate or sump device is introduced into the anterior chamber; the massive increase in area for aqueous drainage provided by the sump allows for IOP control in a number of problem glaucomas. Several drainage implant designs have been marketed, although the principle is the same in all.
PRIMARY ANGLE CLOSURE
Recent research has highlighted significant differences in the clinical course of PAC between European and Asian people leading to a radical rethink in the way the disease is classified. In the Western world PAC has usually been recognized when the condition is acute and symptomatic, so that it has traditionally been classified by the presence or absence of symptoms: acute with unremittingly florid pain and decreased vision; intermittent with self-limiting symptoms; and chronic when asymptomatic but usually with associated past symptomatic attacks of raised IOP. However, this approach is flawed. In Asia, between 50 and 75 per cent of people with glaucomatous optic neuropathy from angle closure do not suffer the classical symptoms familiar to Western ophthalmologists. Furthermore classification by symptoms does not reflect the severity of damage to ocular tissues or visual loss and this classification does not help to guide management in individual patients. It is now widely acknowledged that the term glaucoma should be used only when glaucomatous optic neuropathy is present. The term primary angle closure (PAC) is recommended for significant angle closure but with a normal optic nerve (Table 7.6).
| Type | Description |
|---|---|
| PAC suspect | Narrow drainage angle considered to be at risk of closure |
| PAC | Significant angle closure and raised IOP due to iridotrabecular contact or PAS not attributable to other pathology. Optic nerve considered to be unaffected by glaucoma |
| PACG | Drainage angle closed or capable of closure accompanied by signs of glaucomatous optic neuropathy |
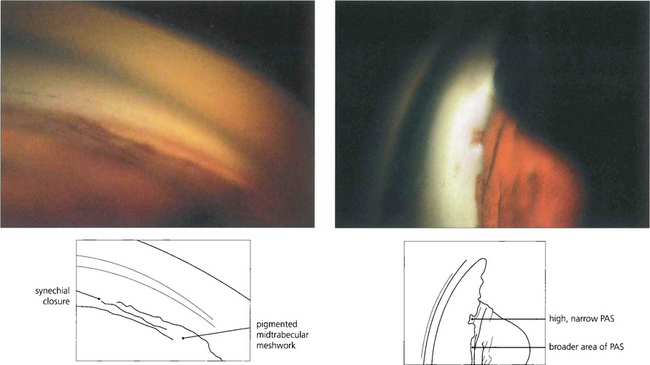
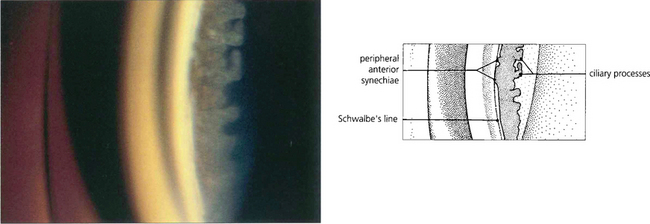
Fig. 7.35 (Left) This goniophotograph shows an area of transition from an open angle with a moderately pigmented midtrabecular meshwork to an area of broad synechial closure; the synechial adhesion has occurred at the level of the anterior trabecular meshwork. (Right) The morphology of peripheral anterior synechiae (PAS) may vary in height and width. This figure shows areas of broad, low PAS and of high, narrow PAS. Within the area of narrow PAS, iris stromal tissue can be seen stretched out under tension, which may break during dynamic gonioscopy to leave a pigment blot on the trabecular meshwork.
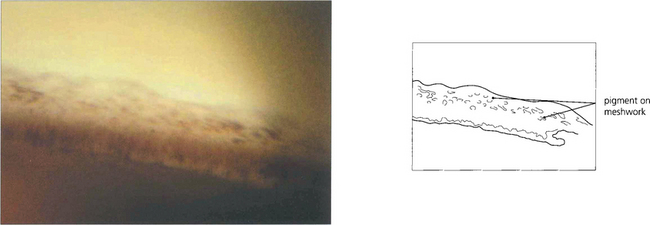
Fig. 7.36 Following treatment of angle closure the angle may be irreversibly damaged, even in the absence of PAS, from damage to the trabeculocytes covering the trabecular plates. This view of an angle shows diffuse pigment deposition across the trabecular meshwork after the angle was opened by laser peripheral iridotomy. This appearance has been likened to footprints in the sand and a high-water mark. Despite the angle being open trabecular damage was sufficient to cause persistently increased IOP.
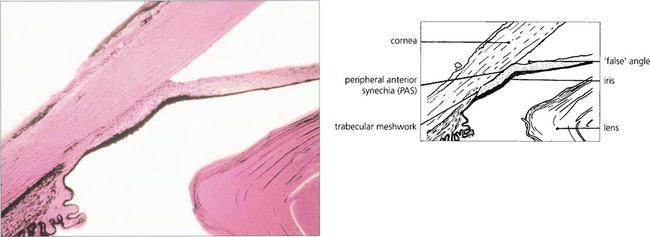
Fig. 7.37 A histological section demonstrating adhesion between the peripheral iris and the trabecular meshwork extending past Schwalbe’s line on to the corneal endothelium. This constitutes a very high PAS.
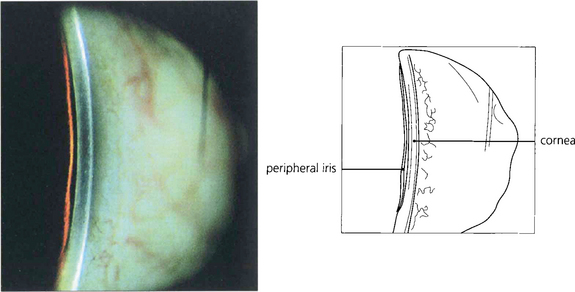
Fig. 7.38 The van Herick test has been suggested for rapid assessment of limbal anterior chamber depth (LCD) and therefore risk of angle closure. A fine, bright slit-lamp beam is shone on to the temporal limbus so that it falls perpendicular to the surface of the eye. The anterior chamber is then viewed at an angle of 60° nasal to the illuminating beam. Depth at the periphery is estimated and expressed as a fraction of peripheral corneal thickness. LCD of one-quarter or less of corneal thickness constitutes a significant risk of closure. This technique is not, however, a substitute for gonioscopic examination.
PRIMARY ANGLE CLOSURE GLAUCOMA
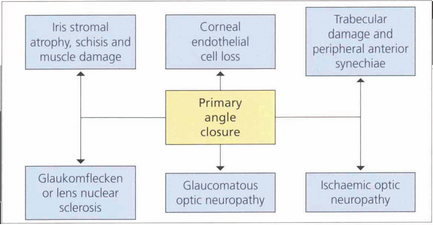
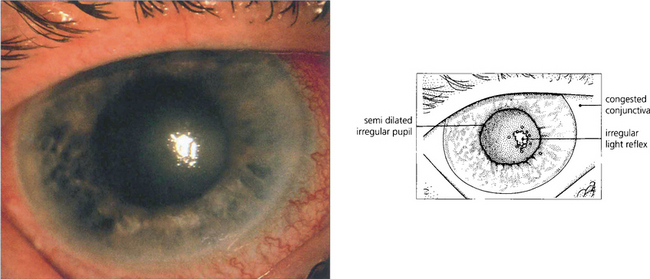
Fig. 7.40 During an attack of angle-closure glaucoma the rise in IOP is associated with infarction of the iris tissue and an associated inflammatory response. There is circumlimbal injection and corneal oedema which can be seen by the irregular light reflex on the corneal surface.
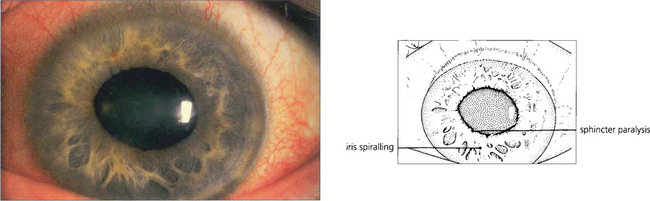
Fig. 7.41 After an episode of symptomatic angle closure the iris may have suffered a sectorial infarction of the sphincter muscle causing distortion and recognized clinically by its whorled appearance. If this is severe the eye is left with a poorly reactive ovoid pupil.
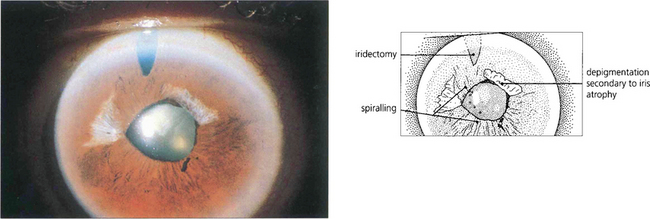
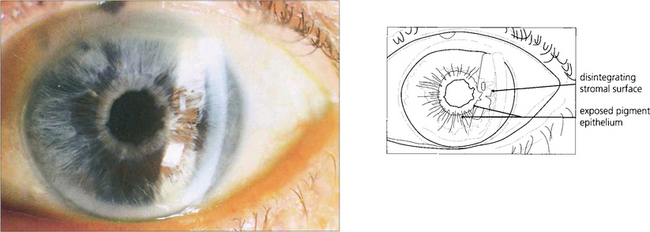
Fig. 7.42 Iris stromal atrophy may also occur after an episode of symptomatic angle closure. The distortion of the pupil contour suggests damage to the iris musculature.
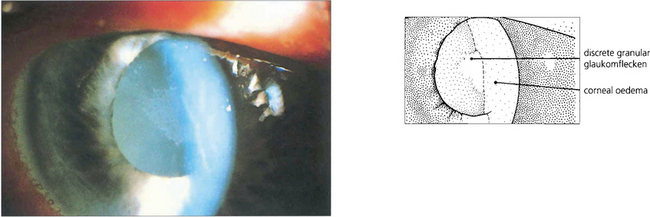
Fig. 7.43 Lens damage following angle closure with elevated rise in IOP is seen as a white granular anterior subcapsular opacity with an irregular edge; this is called glaukomflecken. Over time these opacities come to lie deeper in the lens as new cortical lens fibres are laid down (see Ch. 11).
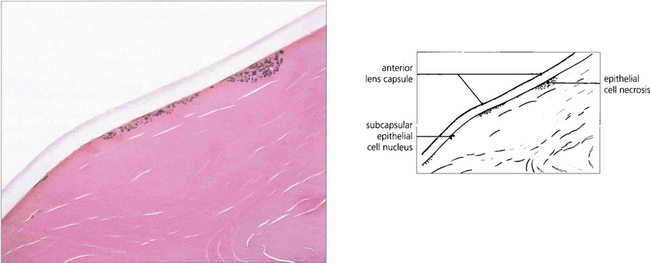
Fig. 7.44 Histological section of a lens with glaukomflecken showing foci of lens epithelial cell necrosis.
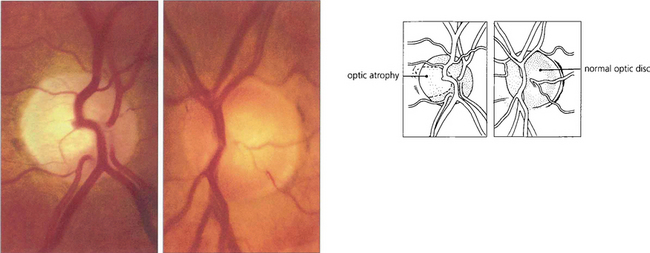
Fig. 7.45 Photographs of the optic discs of a patient 6 months after an episode of symptomatic angle closure in the right eye. Although IOP remained well controlled after the attack, the right optic nerve is flat, pale and atrophic from vascular and neuronal damage; by comparison the left optic nerve is healthy and normal. Should the IOP remain raised after the attack the disc would become cupped and indistinguishable from that seen with POAG.
MECHANISM OF PRIMARY ANGLE CLOSURE
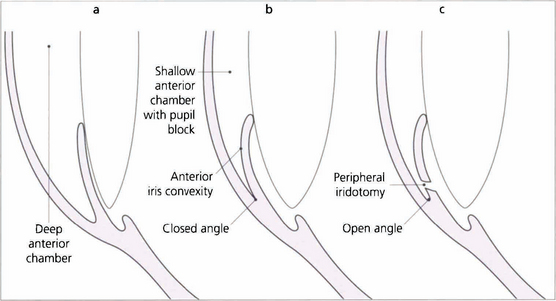
Fig. 7.46 The anterior chamber profile with a normal angle, angle closure and following peripheral iridectomy. Notice that in angle closure the anterior chamber is shallower and there is increased contact between the iris and the lens, which causes a pressure gradient across the pupil so that the peripheral iris billows forwards to occlude the meshwork. Following iridotomy the anterior chamber depth remains unchanged but the iris falls back to open the angle.
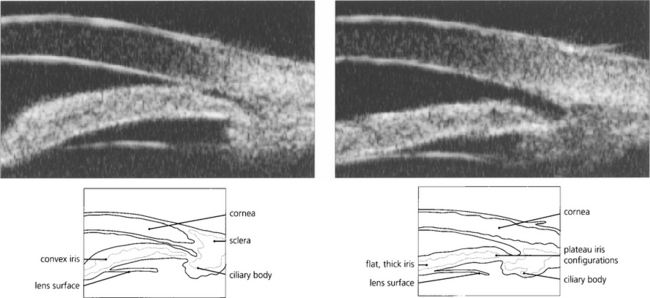
Fig. 7.47 Ultrasonographic biomicroscopy of the peripheral anterior chamber. On the left, the profile of the iris is anteriorly convex and characteristic of pupil block, causing closure of the angle. On the right, after laser iridotomy, the iris profile has changed to become much flatter with a residual plateau configuration.
By courtesy Mr G Gazzard and Dr P Chew.
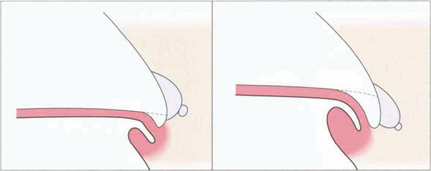
Fig. 7.48 This line drawing illustrates the concept of relative height of plateau iris in the development of significant angle closure. (Left) With a low plateau apposition of the peripheral iris to the meshwork will obstruct only the most inferior part of the meshwork. (Right) With a high plateau apposition will cause complete obstruction.
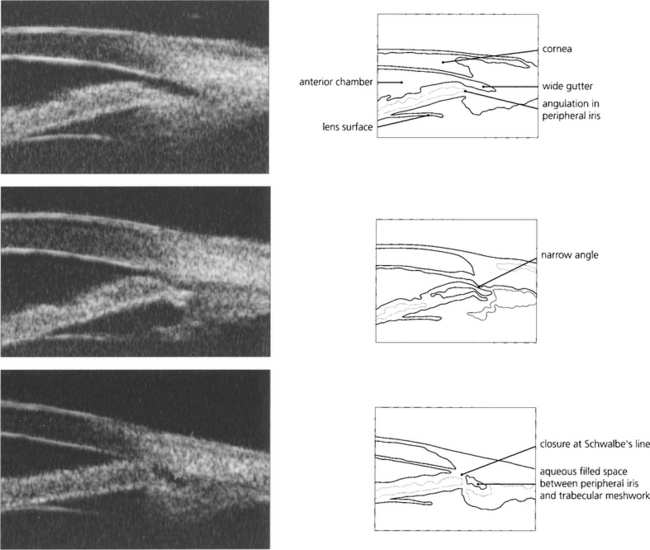
Fig. 7.49 This ultrasonographic biomicrograph shows plateau irides where the peripheral iris angulates abruptly prior to insertion in the ciliary body. (Top) The gap between the iris periphery and trabecular meshwork on the left is wide (a wide gutter); (middle) there is a narrow gutter; and (bottom) angle closure at Schwalbe’s line. If closure occurs at the level of Schwalbe’s line, pigment deposition may be seen after treatment on gonioscopy as a wavy high-water mark. Alternatively, initial angle closure may be deep in the angle recess with synechiae gradually creeping forward. ‘Wide gutters’ are a fairly common finding in East Asian people.
By courtesy of Mr G Gazzard and Dr P Chew.
MANAGEMENT
The first priority in managing PAC, with or without optic nerve damage, is to control IOP. This is most quickly achieved by either medical or laser treatment. All classes of medical agents have a role, particularly in treating symptomatic episodes, although pilocarpine is unique in its ability to open some closed angles mechanically. Definitive treatment is surgical with either laser or conventional surgical techniques. Pure pupil-block angle closure is managed successfully by laser iridotomy or surgical iridectomy. Synechial closure of more than 180° or glaucomatous optic neuropathy usually requires a trabeculectomy. Lens related cases of PAC are treated by lens extraction. Ciliolenticular block (‘malignant glaucoma’) following trabeculectomy is a risk in eyes with very shallow anterior chambers for which combined lens extraction and trabeculectomy may be safer (see Ch. 8).
CONGENITAL AND DEVELOPMENTAL GLAUCOMA
• Trabeculodysgenesis (primary congenital glaucoma, simple buphthalmos)
• Iridotrabecular dysgenesis (e.g. Axenfeld–Reiger anomaly, Rieger syndrome, aniridia)
TREATMENT
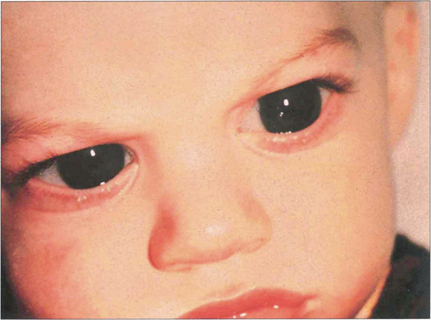
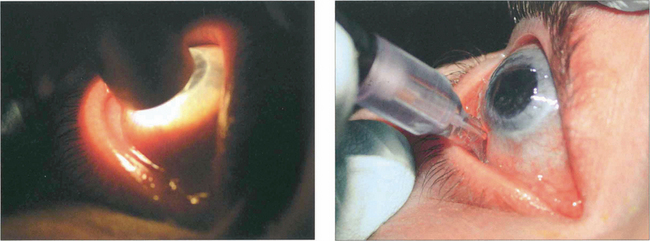
Fig. 7.52 This 10-month-old boy has corneal enlargement and oedema typical of buphthalmos. Lacrimation and intense photophobia are the usual presenting symptoms. The child will often bury its head in a pillow to avoid the light from a window.
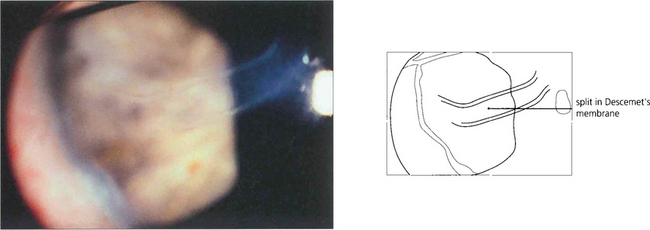
Fig. 7.53 A high-power view of the cornea demonstrates the appearance of ‘splits’ in Desçemet’s membrane which are probably caused by tearing of the membrane associated with the enlargement of the cornea. Horizontal splits called Haab striae are characteristic of buphthalmos. These usually develop in the first 18 months after birth and are a sign of uncontrolled IOP. They are sometimes associated with transient stromal oedema, which invariably subsides with the reconstitution of Desçemet’s membrane. Similar ‘splits’ can be seen as a result of birth trauma to the normal eye with a normal cornea (in which case they are often horizontal) or with posterior polymorphous dystrophy (see Ch. 6).
By courtesy of Professor Peng Khaw.
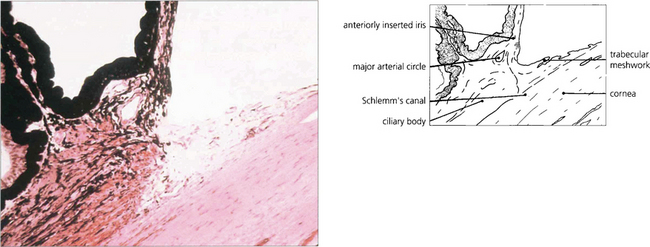
Fig. 7.54 Examination of the angle may reveal maldevelopment of the iris, abnormal adhesions between the peripheral iris and the trabecular meshwork associated with maldevelopment of the angle, and in some instances anomalies of the cornea and lens. This histological appearance of the angle demonstrates the abnormal anterior insertion of the iris together with poorly formed trabecular structures.
IRIDOTRABECULAR AND IRIDOCORNEOTRABECULODYSGENESIS
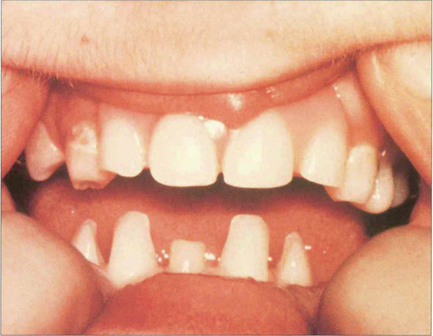
Iris strands to a prominent Schwalbe’s line are known as Axenfeld’s anomaly; if glaucoma is present, the condition is known as Axenfeld’s syndrome. Rieger reported similar cases but with additional ocular abnormalities such as microcornea, corectopia (eccentric pupils) and polycoria (multiple pupils). Extended pedigrees show considerable variation in affected family members and for this reason many authors group them together as the Axenfeld–Rieger malformation although the conditions are both genetically and phenotypically heterogeneous. Defects in FOXC1 and PITX2 may give rise to this spectrum of abnormality. The extent of abnormality may vary between individuals with the same gene mutation and different mutations can cause the same clinical appearance. These ocular features together with systemic abnormalities, such as abnormalities of the teeth and facial bones (hypertelorism), are referred to as Rieger’s syndrome. Peter’s anomaly (see Ch. 6) consists of adhesions from the iris collarette (and sometimes lens) to the posterior corneal surface which has a central opacity and stromal defect. It is usually bilateral (80% per cent) and other defects of anterior segment development may be present. Glaucoma occurs in a substantial number (50–70 per cent) of cases. The central corneal opacity often clears substantially with control of the IOP.
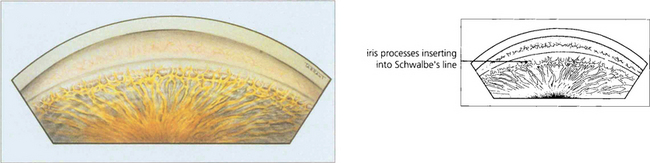
Fig. 7.55 The anterior chamber angle in a patient with Axenfeld’s anomaly shows characteristic multiple abnormal iris processes extending anteriorly to be inserted into Schwalbe’s line.
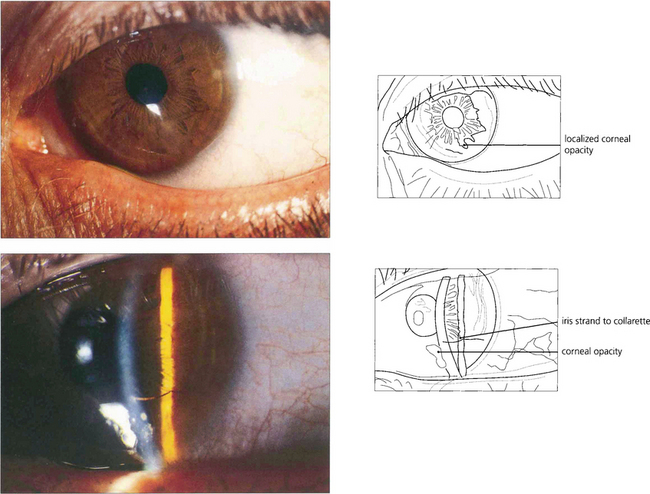
Fig. 7.56 Peter’s anomaly is a developmental anomaly of the anterior chamber in which adhesions exist between the iris and the cornea. It is usually associated with localized lens and corneal opacification. This example shows a very mild example with a localized corneal opacity connected by an iris strand to the collarette.
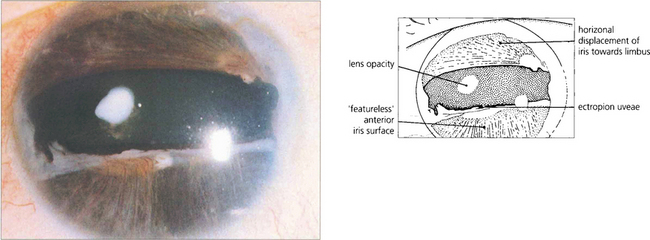
Fig. 7.57 Rieger’s anomaly is associated with iris hypoplasia, posterior embryotoxon and angle anomalies. Glaucoma may present in infancy but is more usual in the first to third decades of life. Notice the grossly abnormal iris with hypoplasia of the anterior iris surface and distortion of the pupil (iris pigment epithelium may be seen at the temporal margin).