Chapter 21 Primary Adrenal Malignancy
Introduction
Adrenal masses are found in 2% to 9% of adults.1,2 The majority are either benign adenomas or metastases. The primary adrenal neoplasms, adrenal cortical carcinoma (ACC) and malignant pheochromocytoma, are relatively rare cancers discussed separately in this chapter. Both are usually diagnosed at advanced stages of disease when curative surgical resection is no longer possible and, because of this, have grim survival rates.
IAdrenal Cortical Carcinoma
Epidemiology and Risk Factors
ACC has an incidence of 0.5 to 2 per million of the population, with an annual incidence of 0.78 per million.3–6 The age distribution is bimodal, with the first peak in children before the age of 5 and a second peak in adults in the fifth to sixth decades. The mean age at diagnosis in adults is approximately 45.7 ACC is more common in female adults, with a ratio of 1.5:1, and is slightly more common on the left side.8 Bilateral tumors are uncommon.
Most cases of ACC are sporadic with no clear etiology. Smoking and oral contraceptives may be risk factors.9,10 ACC is associated with complex hereditary syndromes in some patients, including Li-Fraumeni’s syndrome, Carney’s complex, Beckwith-Weidmann syndrome, multiple endocrine neoplasia (MEN) type I, and Gardner’s syndrome. Sporadic cases are associated with mutations of the tumor suppressor gene p53.11
Anatomy and Pathology
Anatomy
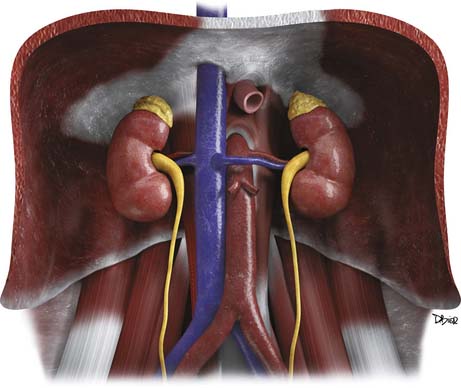
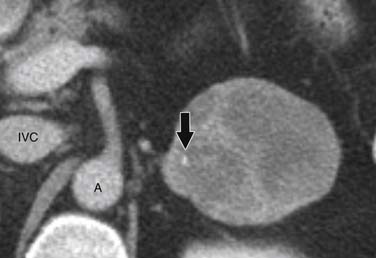
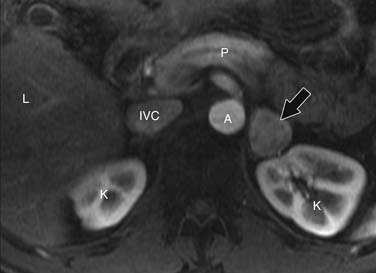
The adrenal glands are located in the retroperitoneum in the superior aspect of the perirenal space and are bounded by the perirenal fascia. The glands are composed of medial and lateral limbs that converge upon a central ridge. The right adrenal tends to have a pyramidal or inverted V shape, and the left is triangular with an inverted Y appearance. The right gland is usually the more superiorly located, lying just above the right kidney, posterior to the liver and inferior vena cava (IVC) and lateral to the right diaphragmatic crus. The left gland lies anteromedial to the superior pole of the left kidney, posterior to the pancreatic tail and splenic vessels, and lateral to the left diaphragmatic crus.12,13
Arterial supply to the glands is provided by superior, middle, and inferior adrenal arteries. There are usually six to eight superior branches, which are branches of the inferior phrenic arteries. The middle arteries arise from the aorta, and the inferior arteries arise from the renal arteries. The right adrenal vein usually drains directly into the IVC, but in 8% to 21% of people, it forms a common trunk with an accessory hepatic vein before draining into the IVC.14,15 The left adrenal vein drains into the left renal vein. Both glands have lymphatic drainage via the retrocrural, upper caval, and aortic lymph nodes.13
The adrenals have an outer cortex that accounts for 90% of the volume of the adult adrenal gland. The cortex is derived from the mesoderm and is part of the endocrine system, secreting androgens and the corticosteroids: cortisol and aldosterone (Figure 21-1). ACC arises from the cortex.
Pathology
On gross pathology, ACC is usually a bulky, coarsely lobulated, yellow to tan tumor with an average weight range of 510 to 1210 g.16,17 Areas of necrosis and hemorrhage cause a variegated appearance.
ACC is most commonly diagnosed histopathologically using the Weiss criteria. The nine criteria are (1) nuclear grades 3 to 4, (2) mitotic rate greater than 5 per 50 high-power fields, (3) atypical mitoses, (4) tumors with 25% or fewer clear cells, (5) diffuse architecture, (6) microscopic necrosis, (7) venous invasion, (8) sinusoidal invasion, and (9) capsular invasion. An adrenal mass is considered malignant if it is positive for three or more of these criteria.16
Pathologic features with prognostic significance for ACC include tumor size, the presence of intratumoral hemorrhage, and the number of mitotic figures. Primary tumors larger than 12 cm have a 5-year survival rate of 22% versus 53% for smaller tumors. Intratumoral hemorrhage is a negative prognostic factor compared with tumors without hemorrhage.18 Patients with a mitotic rate greater than 20 per 50 high-power fields have a median survival time of 14 months compared with 58 months for mitotic rates lower than 20.19
ACCs do not have pathognomonic immunohistochemical findings, although they frequently stain positive for vimentin and negative for cytokeratin.20
Clinical Presentation
The presenting symptoms of ACC depend on tumor size, the presence of metastases, and functional status. Functional tumors account for 50% to 79% of ACCs, and they can secrete cortisol, estrogens, androgens, or aldosterone. Tumors can also secrete a mixture of hormones, usually a combination of cortisol and aldosterone. Cortisol hypersecretion is the most common and presents as Cushing’s syndrome with weight gain, proximal muscle weakness, hyperglycemia, hypertension, and hypokalemia.21,22 Aldosterone hypersecretion causes hypertension and hypokalemia, but these symptoms are more commonly seen with cortisol excess. Virilization can be seen in women with androgen-secreting tumors, whereas men with estrogen-secreting tumors may develop symptoms of feminization.
Nonfunctional tumors can produce symptoms related to mass effect, including abdominal or back pain, early satiety, nausea, vomiting, and/or a palpable mass. They can also present with fever and weight loss. Nonfunctional tumors tend to present in older patients, with a male predominance.23,24 Nonfunctional masses can be discovered incidentally in patients who are undergoing imaging for other reasons. Finally, patients can present with symptoms related to metastatic disease.
Staging Classification
The TNM classification system is based on the primary tumor size and local invasion (T), regional lymph node involvement (N), and the presence or absence of metastatic disease (M).
Tumor-Node-Metastasis Staging of Adrenal Cortical Carcinoma
| T1 | Tumor ≤ 5 cm, no invasion |
| T2 | Tumor > 5 cm, no invasion |
| T3 | Tumor extends outside of adrenal gland into the surrounding fat |
| T4 | Tumor invades adjacent organs |
| N0 | No positive lymph nodes |
| N1 | Positive lymph node(s) |
| M0 | No distant metastases |
| M1 | Distant metastases |
Stages I and II disease are localized to the adrenal gland. Stage III disease is locally invasive or has regional nodal metastasis. Stage IV disease is locally invasive with regional nodal involvement, invades adjacent organs, or is metastatic (Figure 21-2).
Staging of Adrenal Cortical Carcinoma
| Stage I | T1, N0, M0 |
| Stage II | T2, N0, M0 |
| Stage III | T1, N1, M0 |
| T2, N1, M0 | |
| T3, N0, M0 | |
| Stage IV | T3, N1, M0 |
| T4, N0-N1, M0 | |
| Any T, any N, M1 |
ACC has a grim survival rate, with a 5-year overall survival of only 32% to 48%. This is because approximately 70% of ACCs present at stages III and IV. Stages I and II disease have a 5-year survival rate of 62% compared with 7% for stage IV disease.25
Patterns of Tumor Spread
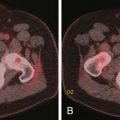
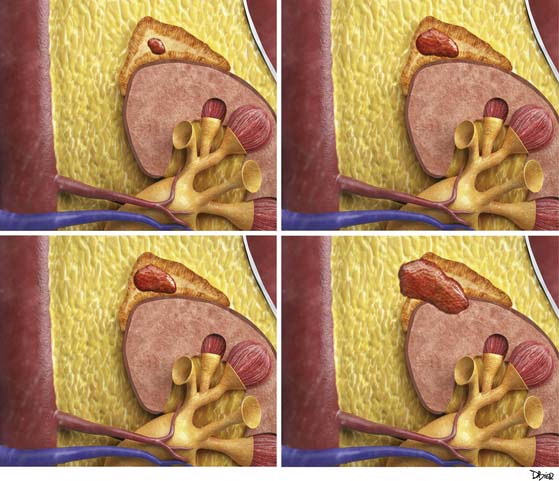
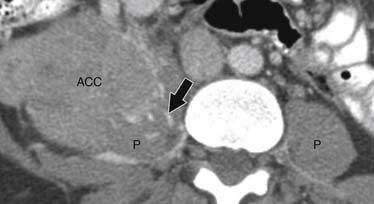
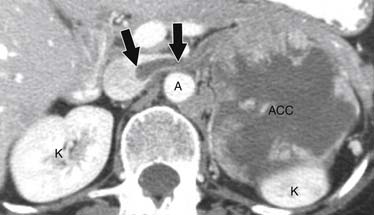
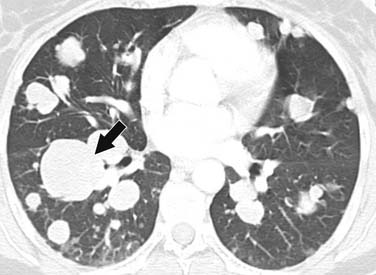
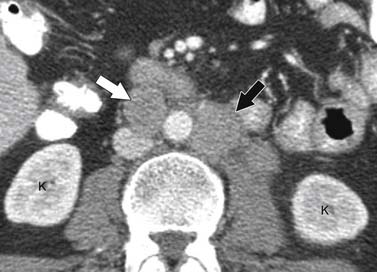
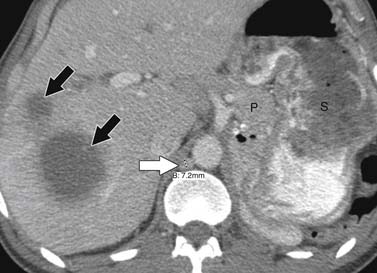
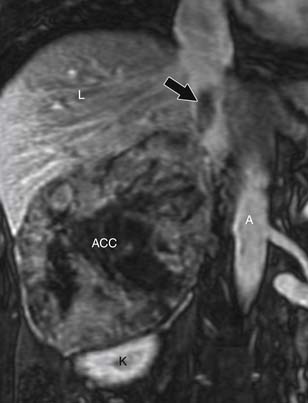
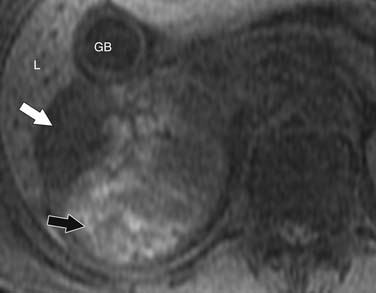
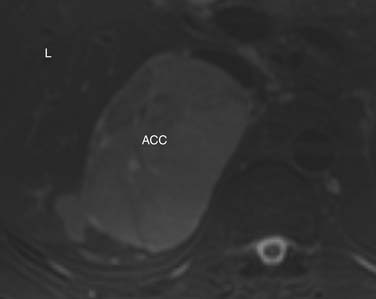
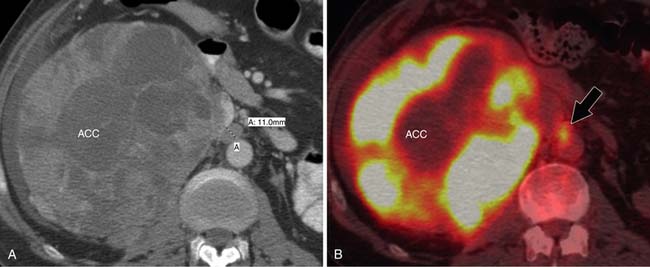
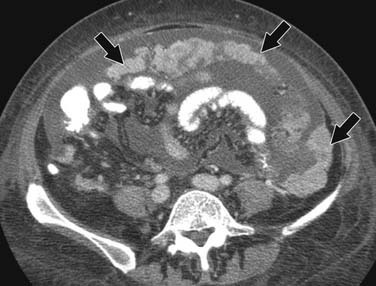
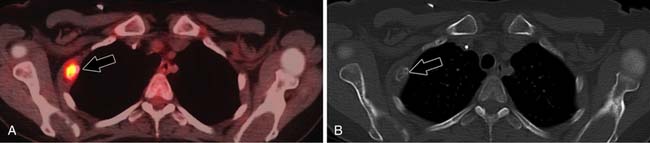
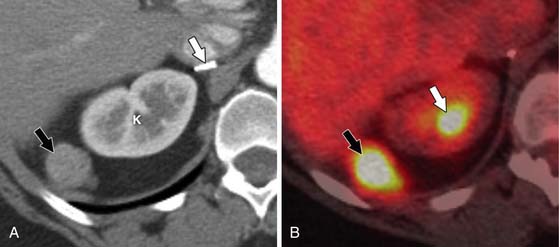
ACCs can spread by direct extension, first into the surrounding fat and then into adjacent structures such as the liver and kidneys (Figure 21-3). Tumor thrombus can involve the adrenal and renal veins and IVC (Figure 21-4). Metastases from hematogenous dissemination most commonly involve the bones, liver, and lungs (Figure 21-5).26 ACC also spreads through the lymphatic system to involve the retrocrural and upper caval and aortic nodes (Figure 21-6). Simultaneous hematogenous and lymphatic dissemination frequently occurs (Figure 21-7).
Imaging
Tumor
Computed Tomography
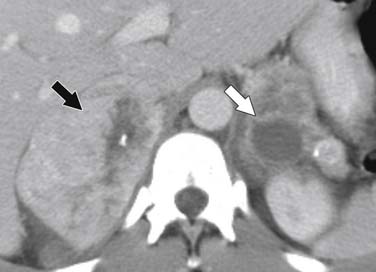
Malignant adrenal masses need to be differentiated from benign adenomas, which are the most common adrenal mass that can be found in up to 7% of the population, their incidence increasing with age.27 Adenomas are usually well circumscribed, homogeneous, round or oval soft tissue masses that have an average size of 2 to 2.5 cm.28 Most have abundant intracellular lipid causing them to measure less than 10 Hounsfield units (HUs) on unenhanced images (Figure 21-8).
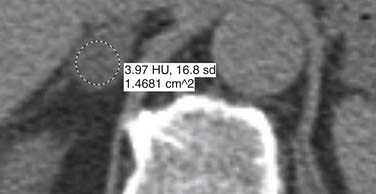
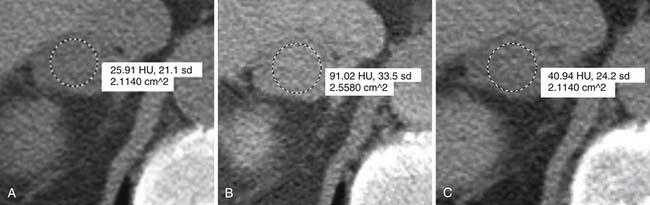
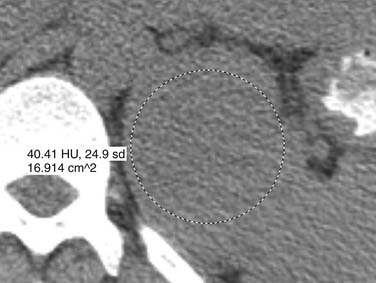
However, up to a third of adenomas are lipid-poor and have higher attenuation on nonenhanced images, usually approximately 20 to 25 HU.28–30 These adenomas need further evaluation with a contrast-enhanced examination that takes advantage of adenoma’s rapid wash-out of contrast. Both lipid-rich and lipid-poor adenomas demonstrate this feature and should have greater than 60% absolute percentage wash-out or greater than 40% relative percentage wash-out on delayed images (Figures 21-9 and 21-10).30–32 A study by Caoili and coworkers30 found a sensitivity of 98% and specificity of 92% for characterizing adrenal masses as adenomas using a protocol that combined the Hounsfield units of unenhanced scans with delayed contrast-enhanced wash-out values.
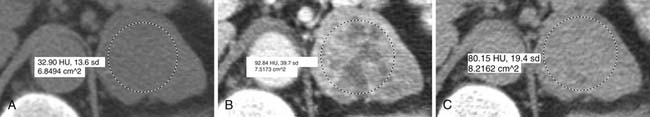
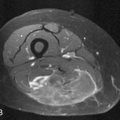
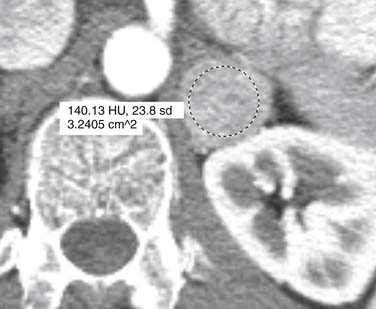
ACCs are typically large at presentation, with a mean diameter of 9.8 cm and a range of 4 to 25 cm.33 Smaller tumors can be well-defined homogeneous masses, but as they enlarge, they typically develop areas of necrosis that leads to a heterogeneous appearance on both pre- and postcontrast images (Figure 21-11). ACCs tend to enhance peripherally with ill-defined margins. Calcification can be present in up to a third and is usually central.34 Because most tumors present at an advanced stage, it is common to see local invasion of the surrounding fat and adjacent organs.
Magnetic Resonance Imaging
At our institution, phased array surface coils are used when possible for adrenal imaging because they offer improved visualization and a better signal-to-noise ratio than body coils. Breathhold gradient echo and fast spin echo sequences are used to minimize motion artifact.
Chemical shift imaging exploits the different proton resonance frequency rates in fat and water molecules to identify lipid-rich adenomas and is currently considered the most sensitive modality for distinguishing between benign and malignant adrenal masses, with a sensitivity of 79% to 100% and specificity of 82% to 100%.35–40 Sensitivity increases to 91% and specificity to 94% when chemical shift and dynamic gadolinium-enhanced imaging are combined.41
For chemical shift imaging, a dual-phase acquisition is performed, in which both in-phase (IP) and out-of-phase (OOP) images are acquired during a single breathhold. The adrenal mass signal intensity is analyzed visually against the splenic signal intensity. An adrenal adenoma will show greater signal loss than the spleen on the OOP sequence (Figure 21-12), whereas a malignant mass will not (Figure 21-13). The signal intensity percentage decrease can also be calculated, using the formula:
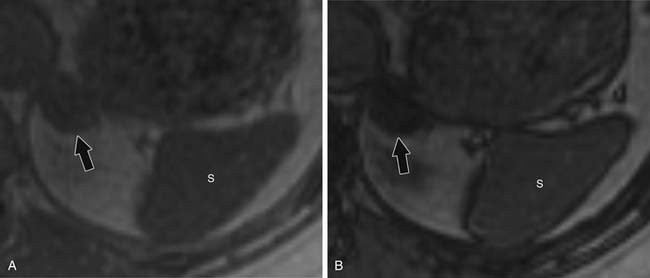
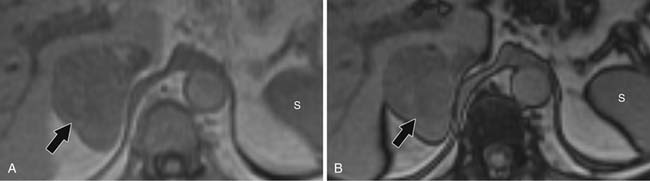
The percentage of decrease is proportional to the amount of lipid in the tissue.37,42,43 The spleen or kidney serves as a baseline comparison to normalize the value. Adenomas will have a decrease in signal intensity of more than 20%, whereas malignant masses will decrease less than 20%.36,38,42
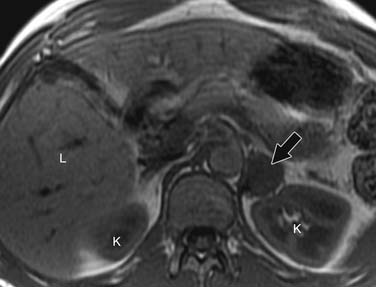
Contrast-enhanced images are used for further characterization of the mass and to evaluate for vascular involvement and metastases. MRI is the best test for assessing venous involvement.44 It can accurately distinguish tumor thrombus from bland thrombus and detect venous wall invasion. MRI is also the most accurate test for delineating the superior extent of venous involvement (Figure 21-14).45,46
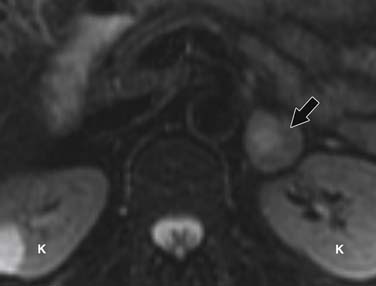
Findings that suggest a mass is an ACC are the same as they are in CT, including size greater than 4 cm, irregular margins, heterogeneous enhancement, and evidence of metastases, lymphadenopathy, or local invasion. ACCs are usually isointense to hypointense compared with the liver on T1-weighted images. Areas of hemorrhage will be hyperintense on T1 (Figure 21-15). On T2 weighted images, ACC is hyperintense relative to the liver (Figure 21-16), with areas of heterogeneity related to necrosis or hemorrhage.47 Occasionally, an ACC will contain foci of intracytoplasmic lipid, causing it to lose signal on OOP images, mimicking an adenoma.47
Ultrasound
Ultrasound is not typically used to evaluate adrenal masses. Although ultrasound has been shown to have a sensitivity of 96% in detecting adrenal masses, it is very operator-dependent and becomes less sensitive when evaluating obese patients or patients with little retroperitoneal fat.48,49
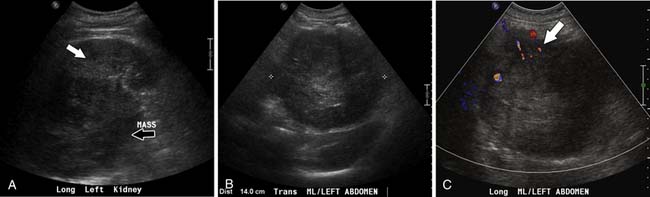
Both ACCs and pheochromocytomas tend to be larger and have a more heterogeneous echotexture than nonmalignant adrenal masses (Figure 21-17). However, there is significant overlap between the gray-scale and the duplex Doppler findings of malignant and nonmalignant lesions, and differentiation is not possible using these two parameters.
A recent study by Friedrich-Rust and colleagues49 found contrast enhanced sonography to have a sensitivity and specificity similar to those of CT and MRI in differentiating adenomas from nonadenomatous lesions, but this modality is not in widespread use in the United States.
Positron-Emission Tomography/Computed Tomography
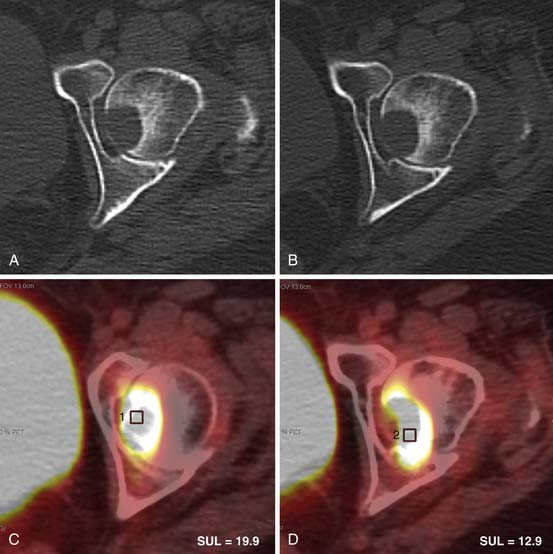
Fluoro-2-deoxy-D-glucose (FDG)-PET/CT has a sensitivity of 93% to 100% and specificity of 90% to 96% for distinguishing malignant from benign adrenal masses.50–53 A study by Tenenbaum and associates54 found FDG-PET to have 100% accuracy for identifying ACC as a malignant adrenal mass. Although not commonly used to evaluate isolated adrenal masses, PET/CT may be useful for lesions that remain indeterminate after CT and MRI evaluation.
A maximum standard uptake value (SUVmax) is calculated, using an ROI that includes at least two thirds of the adrenal mass. If the adrenal mass has equal or higher FDG uptake than the liver, the mass is considered positive for malignancy (Figure 21-18). Although Metser and coworkers55 have suggested using an SUVmax of 3.1 to identify malignant adrenal masses, subsequent studies have shown that use of an internal control, most commonly the liver, is more accurate.56,57 This is because a small percentage of benign adrenal masses exhibit low-grade FDG avidity.58
Radionuclide Imaging
NP-59 is specifically accumulated by functional adrenal cortical tissues.59 Absent or decreased NP-59 uptake is suspicious for a malignant lesion, which may be a primary adrenal cancer or metastasis. Gross and colleagues60 found NP-59 scintigraphy to be 71% sensitive, 100% specific, and 93% accurate for distinguishing between benign and malignant adrenal lesions.
Nodal Disease
Computed Tomography and Magnetic Resonance Imaging
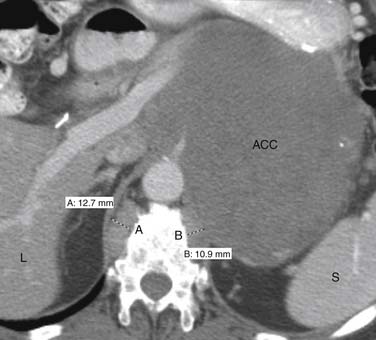
CT and MRI are the modalities most commonly utilized to evaluate regional lymph nodes because they can also simultaneously assess the primary mass and detect distal metastases. Both modalities primarily use size to differentiate benign from malignant nodes, with retroperitoneal nodes measuring 10 mm or greater in short axis and retrocrural nodes larger than 6 mm (Figure 21-19) being suspicious for malignant involvement.61 Unfortunately, nodes may be enlarged secondary to benign processes, whereas normal-sized nodes can have microscopic metastatic involvement, which limits the accuracy of using lymph node size for staging to approximately 69%.62,63 Using only size criteria, CT and MRI have similar accuracies for detecting malignant nodal involvement.64 Lymph node morphology and internal architecture should also be assessed. Normal lymph nodes have a reniform shape, with a smooth outline. Nodes with a higher short axis–to–long-axis ratio, which gives them a more rounded appearance, are suspicious, regardless of size. Nodes with irregular borders or central necrosis are also more likely to harbor tumor.65,66 Finally, nodes that have heterogeneous signal intensity on T2-weighted MRI are suspicious.67
Positron-Emission Tomography/Computed Tomography
Metastatic lymphadenopathy is identified on PET/CT by its hypermetabolism. Nodes with FDG uptake higher than background activity are considered positive for metastatic involvement (Figure 21-20). Studies have shown that PET.CT is more sensitive and specific for identifying malignant nodal disease than both CT and MRI.68–70 Unfortunately, metastatic nodes smaller than 10 mm may not be positive secondary to PET/CT spatial resolution limitations.
Ultrasound
Intraoperative ultrasound can evaluate the high para-aortic and caval nodes. Findings suggestive of malignant involvement include size greater than 1 cm, round morphology, peripheral or mixed vascularity, and loss of hilar fat.71,72 Normal nodes are usually ovoid, with hilar flow and echogenic hilar fat.73
Metastatic Disease
CT is superior to PET/CT for detecting lung, abdominal lymph node, and peritoneal metastases (Figure 21-21).74 PET/CT is currently limited by spatial resolution, becoming more accurate once lesions reach 10 mm, which helps explain this discrepancy.
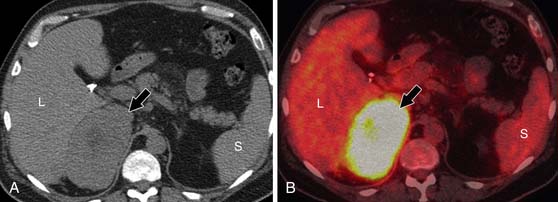
PET/CT is better at detecting bone metastases (Figure 21-22), especially those that might not be included in the field of view on conventional CT and MRI scans. A study by Becherer and associates75 evaluated the use of FDG-PET specifically for ACC and found it to be 100% sensitive and 95% specific for detecting metastases, whereas CT was 89% sensitive and 100% specific.
Key Points The radiology report for adrenal cortical carcinoma: what to include
• Does mass meet the criteria for benign adenoma? If indeterminate, can another modality clarify?
• Does the mass extend outside of the gland and what adjacent organs are involved?
• Venous involvement and what is the superior extent.
• Regional or distal lymphadenopathy.
• Are distal metastases present, and where are they located?
• If adrenalectomy is planned, identify the arterial and venous supply.
Treatment
Patients with complete resection of ACC have 5-year survival rates up to 50%.76–79 Complete resection of the adrenal mass and gland is the goal because subtotal resection increases the likelihood of local recurrence. Unfortunately, recurrence rates after apparent complete resections still remain high, ranging from 35% to 85%.80,81 Repeat resection of locally recurrent disease has been shown to prolong survival compared with treatment with chemotherapy alone.76,82
Adjuvant radiation of the surgical field is controversial, with studies showing conflicting response rates.83–85 Radiation is not recommended after the initial surgery because its effects could make subsequent surgeries more technically difficult, but it may be considered after repeat resections.
Mitotane is used for treating advanced (stages III and IV) tumors. It has a specific cytotoxic effect on adrenocortical cells. Unfortunately, only 20% to 25% of patients respond to mitotane treatment, and several studies have not shown increased survival time for these responders.24,86–88 However, in some patients, mitotane can lead to long-term survival, even if they have stage IV disease.89,90
There is no way to predict which patients will respond to mitotane because response is independent of patient age, gender, and the tumor’s functional status. Achieving a serum mitotane level of greater than 10 µg/mL, preferably in the 14- to 20-µg/mL range, may increase the agent’s efficacy; therefore, the highest tolerable dose should be administered.91 Combining mitotane with cytotoxic agents such as cisplatin has had limited success.8,92 More recently, mitotane has been combined with streptozocin, with a median survival time of 16 months for patients with advanced disease, versus a median survival time of 3 months for untreated disease.26
Mitotane use is complicated by a variety of adverse effects and toxicities. The most common side effects are related to gastrointestinal toxicities and include anorexia, nausea, vomiting, and diarrhea.88 Mitotane can cause adrenal insufficiency, requiring hormonal surveillance and steroid replacement therapy.91 Neuromuscular manifestations such as ataxia, vertigo, speech disturbance, and muscle tremors can be seen at higher doses.93
Key Points Treatment of adrenal cortical carcinoma
• Complete surgical resection is the only curative treatment for ACC.
• Recurrent and metastatic disease should also be resected if possible.
• Mitotane is most commonly used for systemic chemotherapy, but is effective in only a small portion of patients.
• Radiation is mainly used for palliation therapy.
• Surgical debulking and steroidogenesis inhibitors are used to control hypercortisolism.
Surveillance
Follow-up is essential in patients after adrenalectomy for ACC because of its high recurrence rate. Hormonal markers can be monitored in patients with functional ACC to detect recurrence, but approximately one half of these patients have tumor recurrences that produce inactive hormonal precursors, limiting marker use.94 In addition, nonfunctional tumors will not produce hormonal markers. Therefore, radiologic studies are the mainstay for postsurgical follow-up. Imaging is also used to evaluate patients with metastatic disease to determine whether the disease is progressing or responding to therapy. At our institution, PET/CT and contrast-enhanced CT are commonly alternated at 4- to 6-month intervals. This combination of modalities is used because PET/CT has been shown to be superior to CT for detecting locally recurrent disease (Figure 21-23), whereas as mentioned previously, CT is more accurate for pulmonary, nodal, and peritoneal disease.74
Future Therapies
Currently, suspected adrenal malignancies are removed via conventional open adrenalectomy. Recent studies suggest that laparoscopic surgery may be used to remove small-sized ACCs without local invasion with outcomes similar to those of conventional surgery. This would be beneficial because laparoscopic adrenalectomy is associated with less postoperative pain, shorter recovery times, and quicker discharges.22,95
IIMalignant Pheochromocytoma
Epidemiology and Risk Factors
Pheochromocytomas are neuroendocrine tumors that arise from the adrenal medulla’s chromaffin cells. They account for approximately 4% of adrenal incidentalomas, with an annual incidence of 8 per million of the population in the United States.96,97 Most pheochromocytomas are sporadic, but approximately 25% are associated with germline genetic mutations that include the von Hippel–Lindau, rearranged during transection (RET), neurofibromatosis type 1, and succinate dehydrogenase subunits B (SDHB), C (SDHC), and D (SDHD) genes.98–100 Up to 14% are malignant, and there is a higher risk for malignancy in pheochromocytomas caused by mutations in the gene for SDHB.99 Paragangliomas are pheochromocytomas located outside of the adrenal gland and account for approximately 20% of pheochromocytomas.101 Paragangliomas have a higher prevalence of malignancy than pheochromocytomas, with approximately one third being malignant.102,103
Anatomy and Pathology
No histopathologic markers reliably distinguish benign from malignant pheochromocytomas, including capsular or vascular invasion and cellular atypia. Only the presence of metastases establishes malignancy.104 Pheochromocytomas larger than 5 cm do have a greater rate of malignancy than smaller tumors, 76% versus 24%.105
Key Points Anatomy and pathology of malignant pheochromocytoma
• Malignant pheochromocytoma arises from the inner adrenal medulla.
• No reliable histopathologic markers distinguish between benign and malignant pheochromocytomas.
• Presence of metastases is the only criterion to establish malignancy.
• Pheochromocytomas larger than 5 cm have a higher rate of malignancy.
Patterns of tumor spread
Similar to ACC, malignant pheochromocytoma spreads by direct extension into the surrounding fat and adjacent organs. Lymphatic spread is to the regional upper retroperitoneal and retrocrural nodes. The most common sites for hematogenously disseminated metastases are the bones, liver, and lung.106
Clinical Presentation
Functioning malignant pheochromocytomas produce clinical symptoms related to catecholamine excess. These symptoms include paroxysmal hypertension, palpitations, headaches, sweating, and dyspnea.107 Ten percent of pheochromocytomas are nonfunctional and can present with symptoms related to mass effect or metastases or may be discovered incidentally.
Staging Classification
The staging classification for malignant pheochromocytoma and ACC is the same.
Imaging
Tumor
Computed Tomography
Malignant pheochromocytomas are usually large, irregular, heterogeneously enhancing masses that contain areas of necrosis.108,109 The average size is 5 cm and approximately 12% contain calcifications (Figure 21-24).110 On noncontrast images, pheochromocytomas typically have a density of 40 to 50 HU (Figure 21-25).111 Pheochromocytomas can demonstrate rapid contrast wash-out similar to adenomas, but they tend to have more avid enhancement on the early phase of the examination, measuring greater than 110 to 130 HU (Figure 21-26).112 Rarely, necrotic pheochromocytomas can mimic a simple adrenal cyst.113 CT has a sensitivity of 93% to 100% for detecting pheochromocytomas larger than 1 cm.
Magnetic Resonance Imaging
Pheochromocytomas are isointense to hypointense to the liver on T1-weighted images (Figure 21-27). They usually have intense contrast enhancement (Figure 21-28). Although initially pheochromocytomas were described as being pathognomonically “light bulb” bright on T2-weighted images, subsequent studies have shown a significant proportion are heterogeneous with only moderately high T2 signal (Figure 21-29).114,115 MRI and CT have similar sensitivities for detecting adrenal pheochromocytoma.
Radionuclide Imaging
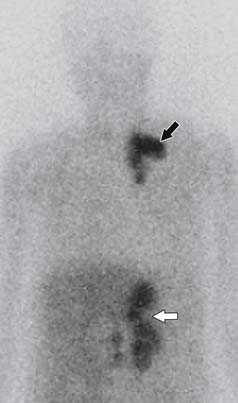
123I-metaiodobenzylguanidine (MIBG) is a type of functional imaging that is useful for evaluating pheochromocytomas because it can detect the primary mass, along with recurrent and metastatic disease. MIBG is a norepinephrine analogue that binds to the human norepinephrine transporter (hNET), which transports catecholamines into chromaffin cells.116 123I-MIBG is the preferred radionuclide for imaging pheochromocytomas because of its specific uptake into the sympathetic nervous system. It has a sensitivity of 90% and a specificity of 92% to 99% for detecting functional pheochromocytomas.117–120
The initial step in 123I-MIBG imaging is to administer a thyroid blockade agent such as potassium perchlorate, potassium iodate of Lugol solution. Next, 10 mCi of 123I-MIBG is given intravenously. Twenty-four and 48 or 72 hours after administration, total body planar imaging is obtained from the head to below the knees, followed by single-photon emission computed tomography (SPECT). The scan is considered positive when adrenal uptake is greater than hepatic activity and no similar uptake is seen on the contralateral side (Figure 21-30).121
Metastases
Classically, MIBG has been used to screen for malignant pheochromocytoma metastases, with a sensitivity of 83% to 100% (Figure 21-31).122 However, not all metastases are MIBG-avid, so if there is clinical suspicion for metastases, further functional imaging is warranted.
111In-pentreotide is an octreotide analogue that is taken up by tumors expressing type 2 and type 5 somatostatin receptors. It can be used for nonspecific functional imaging of metastatic pheochromocytomas that are not MIBG-avid, with sensitivities reaching 97%.119,120
More recently, FDG-PET/CT has been used to detect metastatic disease. A study by Mann and coworkers123 showed that PET is better at detecting pheochromocytoma, both the primary adrenal mass and metastatic disease, than MIBG. PET/CT is especially helpful for detecting metastases that are not MIBG-avid.124 PET/CT using the radioisotopes 6-18F-fluorodopamine (18F-DA) and 6-18F-fluoroDOPA (18F-DOPA) has also been shown to be superior to MIBG for detecting disease.125
Standard bone scintigraphy using technetium-99m diphosphonate remains the best test for detecting bony metastases.126
CT and MRI are less successful than functional imaging at detecting metastatic pheochromocytoma, with both having a sensitivity of approximately 90%.127–130
Key Points The radiology report for malignant pheochromocytoma: what to include
• Does the mass extend outside of the gland and what adjacent organs are involved?
• Venous involvement and what is the superior extent?
• Regional or distal lymphadenopathy.
• Are distal metastases present, and where are they located?
• If adrenalectomy is planned, identify the arterial and venous supply.
Treatment
The prognosis for malignant pheochromocytoma is difficult to predict, but outcomes are worse for patients with liver and lung metastases and for patients with larger tumor sizes.105,107 The average 5-year survival for patients with metastatic disease is approximately 50%.104
Surgical resection is the only curative treatment for malignant pheochromocytoma, and patients with locally recurrent disease should undergo repeat surgical resection.131
For unresectable tumors, 131I-MIBG is used. It works by providing local radiation therapy through the emission of beta particles and induces a predominantly partial tumor response in 24% to 45% of patients, with most experiencing disease progression after 2 years of treatment.132,133 MIBG appears to be more effective against soft tissue metastases than skeletal metastases.131 Thrombocytopenia from bone marrow suppression is the most common side effect.
Cytotoxic chemotherapy is used in patients with tumors that do not take up MIBG. The most common protocol uses a combination of cyclophosphamide, vincristine, and dacarbazine (CVD). As with MIBG, most patients only partially respond to treatment and have progressive disease within 2 years.134–136 Side effects include bone marrow suppression, paresthesias, nausea, and vomiting.
Key Points Treatment of malignant pheochromocytoma
• Complete surgical resection is the only curative treatment.
• 131I-MIBG provides local radiation therapy for metastatic disease, but can be used only in MIBG-avid tumors
• CVD cytotoxic chemotherapy is used for nonavid MIBG tumors.
• Most patients have progressive disease within 2 years with either treatment.
Future Therapies
Approximately 20% to 30% of patients diagnosed with pheochromocytomas or paragangliomas will have a genetic mutation, even if there is no suspicious family history.98,99,137 Therefore, the American Society of Clinical Oncology recommends that patients diagnosed with a chromaffin cell tumor should undergo genetic testing to evaluate for germline mutations in neurofibromatosis-1, von Hippel–Lindau, RET, SDHB, SDHC, and SDHD. Patients who test positive should consider screening family members so they can be screened for possible tumors. Future therapies for malignant pheochromocytoma may exploit these genetic mutations by allowing the use of targeted drugs.
1. Abrams H.L., Spiro R., Goldstein N. Metastases in carcinoma; analysis of 1000 autopsied cases. Cancer. 1950;3:4-85.
2. Copeland P.M. The incidentally discovered adrenal mass. Ann Intern Med. 1983;98:940-945.
3. Norton J.A. Adrenal tumors. In: DeVita V.T., Hellman S., Rosenberg S.A. Cancer, Principles and Practice of Oncology. Philadelphia: Lippincott-Raven; 1997:1659-1674.
4. Vaughan E.D.Jr. Diseases of the adrenal gland. Med Clin North Am.. 2004;88:443-466.
5. Roman S. Adrenocortical carcinoma. Curr Opin Oncol. 2006;18:36-42.
6. Kebebew E., Reiff E., Duh Q.Y., Clark O.H. Extent of disease at presentation and outcome for adrenocortical carcinoma: have we made progress? World J Surg. 2006;30:872-878.
7. Wajchenberg B.L., et al. Adrenocortical carcinoma: clinical and laboratory observations. Cancer. 2000;88:711-736.
8. Wooten M.D., King D.K. Adrenal cortical carcinoma. Epidemiology and treatment with mitotane and a review of the literature. Cancer. 1993;72:3145-3155.
9. Chow W.H., et al. Smoking and adrenal cancer mortality among United States veterans. Cancer Epidemiol Biomarkers Prev. 1996;5:79-80.
10. Hsing A.W., et al. Risk factors for adrenal cancer: an exploratory study. Int J Cancer. 1996;65:432-436.
11. McNicol A.M., et al. Expression of p53 in adrenocortical tumours: clinicopathological correlations. J Pathol. 1997;181:146-152.
12. Goldman S.M., Kenney P.J. The adrenal glands. In: Lee J.K.T., editor. Computed Body Tomography with MRI Correlation. 4th ed. Philadelphia: Lippincott Williams & Wilkins; 2006:1326-1330.
13. Federle M.P. Adrenal. In: Federle M.P., editor. Diagnostic and Surgical Imaging Anatomy. Chest, Abdomen, Pelvis. 1st ed. Salt Lake City, UT: Amirsys; 2006:424-445.
14. Matsuura T., et al. Radiologic anatomy of the right adrenal vein: preliminary experience with MDCT. AJR Am J Roentgenol. 2008;191:402-408.
15. McLachlan M.S., Roberts E.E. Demonstration of the normal adrenal gland by venography and gas insufflation. Br J Radiol. 1971;44:664-671.
16. Weiss L.M. Comparative histologic study of 43 metastasizing and nonmetastasizing adrenocortical tumors. Am J Surg Pathol. 1984;8:163-169.
17. van Slooten H., et al. Morphologic characteristics of benign and malignant adrenocortical tumors. Cancer. 1985;55:766-773.
18. Harrison L.E., Gaudin P.B., Brennan M.F. Pathologic features of prognostic significance for adrenocortical carcinoma after curative resection. Arch Surg. 1999;134:181-185.
19. Weiss L.M., Medeiros L.J., Vickery A.L.Jr. Pathologic features of prognostic significance in adrenocortical carcinoma. Am J Surg Pathol. 1989;13:202-206.
20. Gaffey M.J., et al. Cytokeratin expression in adrenocortical neoplasia: an immunohistochemical and biochemical study with implications for the differential diagnosis of adrenocortical, hepatocellular, and renal cell carcinoma. Hum Pathol. 1992;23:144-153.
21. Abiven G., et al. Clinical and biological features in the prognosis of adrenocortical cancer: poor outcome of cortisol-secreting tumors in a series of 202 consecutive patients. J Clin Endocrinol Metab. 2006;91:2650-2655.
22. Fassnacht M., Allolio B. Clinical management of adrenocortical carcinoma. Best Pract Res Clin Endocrinol Metab. 2009;23:273-289.
23. Venkatesh S., et al. Adrenal cortical carcinoma. Cancer. 1989;64:765-769.
24. Bodie B., et al. The Cleveland Clinic experience with adrenal cortical carcinoma. J Urol. 1989;141:257-260.
25. Paton B.L., et al. Outcomes of adrenal cortical carcinoma in the United States. Surgery. 2006;140:914-920. discussion 919–920
26. Khan T.S., et al. Streptozocin and o, p’DDD in the treatment of adrenocortical cancer patients: long-term survival in its adjuvant use. Ann Oncol. 2000;11:1281-1287.
27. Kloos R.T., et al. Incidentally discovered adrenal masses. Endocr Rev.. 1995;16:460-484.
28. Park S.H., et al. Differentiation of adrenal adenoma and nonadenoma in unenhanced CT: new optimal threshold value and the usefulness of size criteria for differentiation. Korean J Radiol. 2007;8:328-335.
29. Lee M.J., et al. Benign and malignant adrenal masses: CT distinction with attenuation coefficients, size, and observer analysis. Radiology. 1991;179:415-418.
30. Caoili E.M., et al. Adrenal masses: characterization with combined unenhanced and delayed enhanced CT. Radiology. 2002;222:629-633.
31. Jhaveri K.S., Lad S.V., Haider M.A. Computed tomographic histogram analysis in the diagnosis of lipid-poor adenomas: comparison to adrenal washout computed tomography. J Comput Assist Tomogr. 2007;31:513-518.
32. Hamrahian A.H., et al. Clinical utility of noncontrast computed tomography attenuation value (Hounsfield units) to differentiate adrenal adenomas/hyperplasias from nonadenomas: Cleveland Clinic experience. J Clin Endocrinol Metab. 2005;90:871-877.
33. Ng L., Libertino J.M. Adrenocortical carcinoma: diagnosis, evaluation and treatment. J Urol. 2003;169:5-11.
34. Fishman E.K., Deutch B.M., Hartman D.S., et al. Primary adrenal cortical carcinoma: CT evaluation with clinical correlation. AJR Am J Roentgenol. 1987;148:531-535.
35. Tsushima Y., Ishizaka H., Matsumoto M. Adrenal masses: differentiation with chemical shift, fast low-angle shot MR imaging. Radiology. 1993;186:705-709.
36. Mayo-Smith W.W., et al. Characterization of adrenal masses (<5 cm) by use of chemical shift MR imaging: observer performance versus quantitative measures. AJR Am J Roentgenol. 1995;165:91-95.
37. Korobkin M., et al. Characterization of adrenal masses with chemical shift and gadolinium-enhanced MR imaging. Radiology. 1995;197:411-418.
38. Namimoto T., et al. Adrenal masses: quantification of fat content with double-echo chemical shift in-phase and opposed-phase FLASH MR images for differentiation of adrenal adenomas. Radiology. 2001;218:642-646.
39. Sasai N., et al. Differential diagnosis of adrenal masses by chemical shift and dynamic gadolinium enhanced MR imaging. Acta Med Okayama. 2003;57:163-170.
40. Fujiyoshi F., et al. Characterization of adrenal tumors by chemical shift fast low-angle shot MR imaging: comparison of four methods of quantitative evaluation. AJR Am J Roentgenol. 2003;180:1649-1657.
41. Heinz-Peer G., et al. Characterization of adrenal masses using MR imaging with histopathologic correlation. AJR Am J Roentgenol. 1999;173:15-22.
42. Outwater E.K., et al. Adrenal masses: correlation between CT attenuation value and chemical shift ratio at MR imaging with in-phase and opposed-phase sequences. Radiology. 1996;200:749-752.
43. Outwater E., Siegelman E.S., Radecki P.D., et al. Distinction between benign and malignant adrenal masses: value of T1-weighted chemical-shift MR imaging. AJR Am J Roentgenol. 1995;165:579-583.
44. Goldfarb D.A., et al. Magnetic resonance imaging for assessment of vena caval tumor thrombi: a comparative study with venacavography and computerized tomography scanning. J Urol. 1990;144:1100-1103. discussion 1103–1104
45. Fein A.B., et al. Diagnosis and staging of renal cell carcinoma: a comparison of MR imaging and CT. AJR Am J Roentgenol. 1987;148:749-753.
46. Soler R., et al. MR imaging in inferior vena cava thrombosis. Eur J Radiol. 1995;19:101-107.
47. Schlund J.F., et al. Adrenocortical carcinoma: MR imaging appearance with current techniques. J Magn Reson Imaging. 1995;5:171-174.
48. Trojan J., Schwarz W., Sarrazin C., et al. Role of ultrasonography in the detection of small adrenal masses. Ultraschall Med. 2002;23:96-100.
49. Friedrich-Rust M., et al. Contrast-enhanced sonography of adrenal masses: differentiation of adenomas and nonadenomatous lesions. AJR Am J Roentgenol. 2008;191:1852-1860.
50. Yun M., et al. 18F-FDG PET in characterizing adrenal lesions detected on CT or MRI. J Nucl Med. 2001;42:1795-1799.
51. Gupta N.C., et al. Clinical utility of PET-FDG imaging in differentiation of benign from malignant adrenal masses in lung cancer. Clin Lung Cancer. 2001;3:59-64.
52. Kumar R., et al. 18F-FDG PET in evaluation of adrenal lesions in patients with lung cancer. J Nucl Med. 2004;45:2058-2062.
53. Jana S., et al. FDG-PET and CT characterization of adrenal lesions in cancer patients. Eur J Nucl Med Mol Imaging. 2006;33:29-35.
54. Tenenbaum F., et al. 18F-fluorodeoxyglucose positron emission tomography as a diagnostic tool for malignancy of adrenocortical tumours? Preliminary results in 13 consecutive patients. Eur J Endocrinol. 2004;150:789-792.
55. Metser U., et al. 18F-FDG PET/CT in the evaluation of adrenal masses. J Nucl Med. 2006;47:32-37.
56. Vikram R., et al. Utility of PET/CT in differentiating benign from malignant adrenal nodules in patients with cancer. AJR Am J Roentgenol. 2008;191:1545-1551.
57. Blake M.A., et al. Adrenal lesions: characterization with fused PET/CT image in patients with proved or suspected malignancy–initial experience. Radiology. 2006;238:970-977.
58. Erasmus J.J., et al. Evaluation of adrenal masses in patients with bronchogenic carcinoma using 18F-fluorodeoxyglucose positron emission tomography. AJR Am J Roentgenol. 1997;168:1357-1360.
59. Gross M.D., et al. The scintigraphic imaging of endocrine organs. Endocr Rev.. 1984;5:221-281.
60. Gross M.D., et al. Scintigraphic evaluation of clinically silent adrenal masses. J Nucl Med. 1994;35:1145-1152.
61. Koh D.M., Hughes M., Husband J.E. Cross-sectional imaging of nodal metastases in the abdomen and pelvis. Abdom Imaging. 2006;31:632-643.
62. Gagliardi G., et al. Preoperative staging of rectal cancer using magnetic resonance imaging with external phase-arrayed coils. Arch Surg. 2002;137:447-451.
63. Anzai Y., et al. Evaluation of neck and body metastases to nodes with ferumoxtran 10-enhanced MR imaging: phase III safety and efficacy study. Radiology. 2003;228:777-788.
64. Sohn K.M., et al. Comparing MR imaging and CT in the staging of gastric carcinoma. AJR Am J Roentgenol. 2000;174:1551-1557.
65. McMahon C.J., Rofsky N.M., Pedrosa I. Lymphatic metastases from pelvic tumors: anatomic classification, characterization, and staging. Radiology. 2010;254:31-46.
66. Yang W.T., et al. Comparison of dynamic helical CT and dynamic MR imaging in the evaluation of pelvic lymph nodes in cervical carcinoma. AJR Am J Roentgenol. 2000;175:759-766.
67. Brown G., et al. Morphologic predictors of lymph node status in rectal cancer with use of high-spatial-resolution MR imaging with histopathologic comparison. Radiology. 2003;227:371-377.
68. Veit P., et al. Lymph node staging with dual-modality PET/CT: enhancing the diagnostic accuracy in oncology. Eur J Radiol. 2006;58:383-389.
69. Antoch G., et al. Whole-body dual-modality PET/CT and whole-body MRI for tumor staging in oncology. JAMA. 2003;290:3199-3206.
70. Schmidt G.P., et al. Comparison of high resolution whole-body MRI using parallel imaging and PET-CT. First experiences with a 32-channel MRI system [in German]. Radiologe. 2004;44:889-898.
71. Torabi M., Aquino S.L., Harisinghani M.G. Current concepts in lymph node imaging. J Nucl Med. 2004;45:1509-1518.
72. Ahuja A., Ying M. Sonography of neck lymph nodes. Part II: abnormal lymph nodes. Clin Radiol. 2003;58:359-366.
73. Ying M., Ahuja A. Sonography of neck lymph nodes. Part I: normal lymph nodes. Clin Radiol. 2003;58:351-358.
74. Leboulleux S., et al. Diagnostic and prognostic value of 18-fluorodeoxyglucose positron emission tomography in adrenocortical carcinoma: a prospective comparison with computed tomography. J Clin Endocrinol Metab. 2006;91:920-925.
75. Becherer A., et al. FDG-PET in adrenocortical carcinoma. Cancer Biother Radiopharm. 2001;16:289-295.
76. Pommier R.F., Brennan M.F. An eleven-year experience with adrenocortical carcinoma. Surgery. 1992;112:963-970. discussion 970–971
77. Icard P., et al. Adrenocortical carcinoma in surgically treated patients: a retrospective study on 156 cases by the French Association of Endocrine Surgery. Surgery. 1992;112:972-979. discussion 979–980
78. Crucitti F., et al. The Italian Registry for Adrenal Cortical Carcinoma: analysis of a multi-institutional series of 129 patients. The ACC Italian Registry Study Group. Surgery. 1996;119:161-170.
79. Lee J.E., et al. Surgical management, DNA content, and patient survival in adrenal cortical carcinoma. Surgery. 1995;118:1090-1098.
80. Third national cancer survey. incidence data. Natl Cancer Inst Monogr. 1975;41:i-x-1,454.
81. Schulick R.D., Brennan M.F. Long-term survival after complete resection and repeat resection in patients with adrenocortical carcinoma. Ann Surg Oncol. 1999;6:719-726.
82. Grondal S., et al. Adrenocortical carcinoma. A retrospective study of a rare tumor with a poor prognosis. Eur J Surg Oncol. 1990;16:500-506.
83. Fassnacht M., et al. Efficacy of adjuvant radiotherapy of the tumor bed on local recurrence of adrenocortical carcinoma. J Clin Endocrinol Metab. 2006;91:4501-4504.
84. Hutter A.M.Jr., Kayhoe D.E. Adrenal cortical carcinoma. Clinical features of 138 patients. Am J Med. 1966;41:572-580.
85. Markoe A.M., et al. Radiation therapy for adjunctive treatment of adrenal cortical carcinoma. Am J Clin Oncol. 1991;14:170-174.
86. Barzon L., et al. Adrenocortical carcinoma: experience in 45 patients. Oncology. 1997;54:490-496.
87. Hoffman D.L., Mattox V.R. Treatment of adrenocortical carcinoma with o, p’-DDD. Med Clin North Am.. 1972;56:999-1012.
88. Hutter A.M.Jr., Kayhoe D.E. Adrenal cortical carcinoma. Results of treatment with o, p’DDD in 138 patients. Am J Med. 1966;41:581-592.
89. Favia G., et al. Adrenocortical carcinoma. Our experience. Minerva Endocrinol. 1995;20:95-99.
90. Khorram-Manesh A., et al. Adrenocortical carcinoma: surgery and mitotane for treatment and steroid profiles for follow-up. World J Surg. 1998;22:605-611. discussion 611–612
91. van Slooten H., et al. The treatment of adrenocortical carcinoma with o, p’-DDD: prognostic implications of serum level monitoring. Eur J Cancer Clin Oncol. 1984;20:47-53.
92. Brennan M.F. Adrenocortical carcinoma. CA Cancer J Clin. 1987;37:348-365.
93. Heilmann P., et al. Therapy of the adrenocortical carcinoma with Lysodren (o, p’-DDD). Therapeutic management by monitoring o, p’-DDD blood levels [in German]. Med Klin (Munich). 2001;96:371-377.
94. Gicquel C., et al. Adrenocortical carcinoma. Ann Oncol. 1997;8:423-427.
95. Saunders B.D., Doherty G.M. Laparoscopic adrenalectomy for malignant disease. Lancet Oncol. 2004;5:718-726.
96. Beard C.M., Scheps S.G., Kurland L.T., et al. Occurrence of pheochromocytoma in Rochester, Minnesota, 1950-1979. Mayo Clin Proc.. 1983;58:802-804.
97. Kasperlik-Zaluska A.A., et al. 1,111 patients with adrenal incidentalomas observed at a single endocrinological center: incidence of chromaffin tumors. Ann N Y Acad Sci.. 2006;1073:38-46.
98. Neumann H.P., et al. Germ-line mutations in nonsyndromic pheochromocytoma. N Engl J Med. 2002;346:1459-1466.
99. Amar L., et al. Genetic testing in pheochromocytoma or functional paraganglioma. J Clin Oncol. 2005;23:8812-8818.
100. Gimm O., et al. The genetic basis of pheochromocytoma. Front Horm Res.. 2004;31:45-60.
101. Lenders J.W., et al. Phaeochromocytoma. Lancet. 2005;366:665-675.
102. Whalen R.K., Althausen A.F., Daniels G.H. Extra-adrenal pheochromocytoma. J Urol. 1992;147:1-10.
103. John H., et al. Pheochromocytomas: can malignant potential be predicted? Urology. 1999;53:679-683.
104. Eisenhofer G., et al. Malignant pheochromocytoma: current status and initiatives for future progress. Endocr Relat Cancer. 2004;11:423-436.
105. Kuruba R., Gallagher S.F. Current management of adrenal tumors. Curr Opin Oncol. 2008;20:34-46.
106. Shapiro B., et al. Malignant phaeochromocytoma: clinical, biochemical and scintigraphic characterization. Clin Endocrinol (Oxf). 1984;20:189-203.
107. Goldstein R.E., et al. Clinical experience over 48 years with pheochromocytoma. Ann Surg. 1999;229:755-764. discussion 764–766
108. Zarnegar R., et al. Malignant pheochromocytoma. Surg Oncol Clin North Am.. 2006;15:555-571.
109. Ilias I., et al. The optimal imaging of adrenal tumours: a comparison of different methods. Endocr Relat Cancer. 2007;14:587-599.
110. Mukherjee J.J., et al. Pheochromocytoma: effect of nonionic contrast medium in CT on circulating catecholamine levels. Radiology. 1997;202:227-231.
111. Sahdev A., Reznek R.H. Imaging evaluation of the non-functioning indeterminate adrenal mass. Trends Endocrinol Metab. 2004;15:271-276.
112. Horton K.M., Johnson P.T., Fishman E.K. MDCT of the abdomen: common misdiagnoses at a busy academic center. AJR Am J Roentgenol. 2010;194:660-667.
113. Bush W.H., et al. Cystic pheochromocytoma. Urology. 1985;25:332-334.
114. Rha S.E., et al. Neurogenic tumors in the abdomen: tumor types and imaging characteristics. Radiographics. 2003;23:29-43.
115. Francis I.R., Korobkin M. Pheochromocytoma. Radiol Clin North Am.. 1996;34:1101-1112.
116. Shulkin B., et al. Current trends in functional imaging of pheochromocytomas and paragangliomas. Ann N Y Acad Sci.. 2006;1073:374-382.
117. Velchik M.G., et al. Localization of pheochromocytoma: MIBG [correction of MIGB], CT, and MRI correlation. J Nucl Med. 1989;30:328-336.
118. Quint L.E., et al. Pheochromocytoma and paraganglioma: comparison of MR imaging with CT and I-131 MIBG scintigraphy. Radiology. 1987;165:89-93.
119. Lauriero F., et al. I-131 MIBG scintigraphy of neuroectodermal tumors. Comparison between I-131 MIBG and In-111 DTPA-octreotide. Clin Nucl Med. 1995;20:243-249.
120. Hoefnagel C.A. Metaiodobenzylguanidine and somatostatin in oncology: role in the management of neural crest tumours. Eur J Nucl Med. 1994;21:561-581.
121. Cecchin D., et al. A meta-iodobenzylguanidine scintigraphic scoring system increases accuracy in the diagnostic management of pheochromocytoma. Endocr Relat Cancer. 2006;13:525-533.
122. Ilias I., et al. Comparison of 6-18F-fluorodopamine PET with 123I-metaiodobenzylguanidine and 111In-pentetreotide scintigraphy in localization of nonmetastatic and metastatic pheochromocytoma. J Nucl Med. 2008;49:1613-1619.
123. Mann G.N., et al. [11C]metahydroxyephedrine and [18F]fluorodeoxyglucose positron emission tomography improve clinical decision making in suspected pheochromocytoma. Ann Surg Oncol. 2006;13:187-197.
124. Shulkin B.L., et al. Pheochromocytomas: imaging with 2-[fluorine-18]fluoro-2-deoxy-D-glucose PET. Radiology. 1999;212(1):35-41.
125. Hoegerle S., et al. Pheochromocytomas: detection with 18F DOPA whole body PET—initial results. Radiology. 2002;222:507-512.
126. Lynn M.D., et al. Bone metastases in pheochromocytoma: comparative studies of efficacy of imaging. Radiology. 1986;160:701-706.
127. Bravo E.L. Evolving concepts in the pathophysiology, diagnosis, and treatment of pheochromocytoma. Endocr Rev.. 1994;15:356-368.
128. Mannelli M., et al. Pheochromocytoma in Italy: a multicentric retrospective study. Eur J Endocrinol. 1999;141:619-624.
129. Maurea S., et al. Diagnostic imaging in patients with paragangliomas. Computed tomography, magnetic resonance and MIBG scintigraphy comparison. Q J Nucl Med. 1996;40:365-371.
130. Schmedtje J.F.Jr., et al. Localization of ectopic pheochromocytomas by magnetic resonance imaging. Am J Med. 1987;83:770-772.
131. Kopf D., Goretzki P.E., Lehnert H. Clinical management of malignant adrenal tumors. J Cancer Res Clin Oncol. 2001;127:143-155.
132. Sisson J.C. Radiopharmaceutical treatment of pheochromocytomas. Ann N Y Acad Sci.. 2002;970:54-60.
133. Troncone L., Rufini V. Nuclear medicine therapy of pheochromocytoma and paraganglioma. Q J Nucl Med. 1999;43:344-355.
134. Tato A., et al. Malignant pheochromocytoma, still a therapeutic challenge. Am J Hypertens. 1997;10:479-481.
135. Noshiro T., et al. Two cases of malignant pheochromocytoma treated with cyclophosphamide, vincristine and dacarbazine in a combined chemotherapy. Endocr J. 1996;43:279-284.
136. Scholz T., et al. Clinical review: current treatment of malignant pheochromocytoma. J Clin Endocrinol Metab. 2007;92:1217-1225.
137. Benn D.E., et al. Clinical presentation and penetrance of pheochromocytoma/paraganglioma syndromes. J Clin Endocrinol Metab. 2006;91:827-836.