Chapter 10 Pressure wire and related technologies


INTRODUCTION
The limitations of coronary angiography to assess the functional significance of coronary stenoses have been recognised for more than 20 years.1 Large intra- and inter-observer variability occurs when coronary angiograms are interpreted which accounts for the frequent dissociation between clinical and angiographic findings. Morphological assessment of a coronary lesion does not necessarily reflect the impairment of flow by the stenosis. This dichotomy may occur as the resistance of a coronary stenosis will vary in relation to the fourth power of the luminal radius. Thus a relatively small change in vessel radius, beyond angiographic resolution, may result in a significant alteration in flow. The resistance of a lesion to flow will also be influenced by the length of the stenosis. Furthermore, whether ischaemia is induced by any epicardial stenosis will be determined to a significant extent by the size of the perfused territory that lies beyond the stenosis.
As a result, measurements of coronary flow and pressure have been introduced to improve the functional evaluation of coronary stenoses and interventions.2 Technical progress has permitted intra-coronary measurements to be made using wires with the same dimensions as those of conventional angioplasty guidewires (0.014 inches in diameter) increasing their ease of application in the catheter laboratory.
PRESSURE MEASUREMENT
Blood flow within the coronary vessels is greatly dependent on the haemodynamic status of the patient and may demonstrate significant variations between individual recordings. To overcome this problem the concept of coronary pressure derived myocardial fractional flow reserve (FFR) has been developed. FFR is defined as the maximum myocardial blood flow in the presence of a stenosis expressed as a proportion of the theoretical maximum flow in the absence of any stenosis (Fig. 10.1). The FFR represents the summation of the severity of the epicardial stenosis, the extent of the perfused territory and the contribution of distal collateral blood flow.
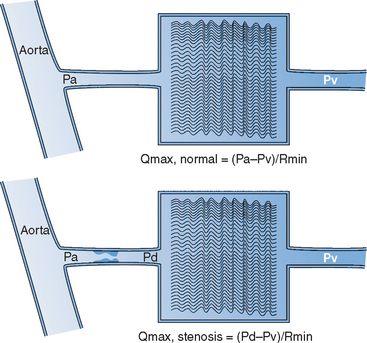

AO, aorta: Pa, Pd and Pv mean aortic, distal coronary and central venous pressure; Qmax, normal, theoretical maximum achievable myocardial flow if the artery were normal; Qmax, stenosis, maximal achievable flow in the presence of a stenosis.
Adapted from Pijls and De Bruyne.22
The standard means for inducing hyperaemia is by the administration of adenosine. This is typically infused intravenously for 1–2 minutes (140 mg/kg/min infused via the femoral vein), though it may be used as an intra-coronary bolus dose.3 Intra-coronary injection of papaverine may also be used.3 This provides a hyperaemic plateau which lasts for 30–60 seconds though is associated with prolongation of the QT-interval and occasionally ventricular arrhythmia. The distal coronary, aortic and right atrial (RA) pressures are then measured simultaneously via the pressure wire, guide catheter and RA catheter respectively, and the FFR calculated (Fig. 10.1). For simplicity of use, the right atrial pressure is now not often recorded and is taken to have a value of 0 mmHg when calculating the FFR. This practice has been demonstrated to reduce the sensitivity of FFR for detecting significant coronary lesions.4 To compensate for this it is usual to accept values of FFR in the ‘grey zone’ of 0.75 to 0.80 as potentially indicative of ischaemia.
As measurement of FFR is expressed as a ratio of the proximal to distal coronary pressure within the same vessel, the possible confounding effects of microvascular disease and the contribution of distal collateral vessels are eliminated. Likewise, it is independent of changes in patient haemodynamics, such as heart rate, blood pressure and myocardial contractility.5 As a normal reference vessel is not required, FFR measurements may be made in multivessel disease. It may also be used to assess the cumulative effect on coronary flow of sequential lesions within a single vessel.
The procedure
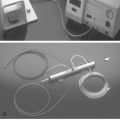
There are currently two widely used systems based on a high-fidelity sensor tipped guidewire.6 Both of these are 0.014 inch wires with the sensor area located 3 cm proximal to the wire tip. With progressive improvement in the performance of these wires they may be used as first-line guidewires during angioplasty.
Application of pressure measurement
The primary indication for the use of coronary pressure measurement is to determine whether a coronary stenosis is flow limiting and as a result is responsible for myocardial ischaemia. It is now well established that an FFR below 0.75 is functionally significant and has been found to correlate well with the presence of ischaemia on perfusion scintigraphy, stress echocardiography and exercise testing in a broad spectrum of clinical settings.5,7,8 However, it may be unreliable in acute ischaemic syndromes due to microvascular injury. Both retrospective and prospective work have demonstrated that lesions with a distal FFR greater than 0.75 may be left untreated without any increase in subsequent adverse events on follow-up.9,10,11
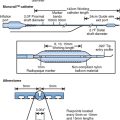
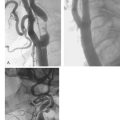
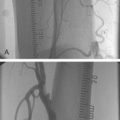
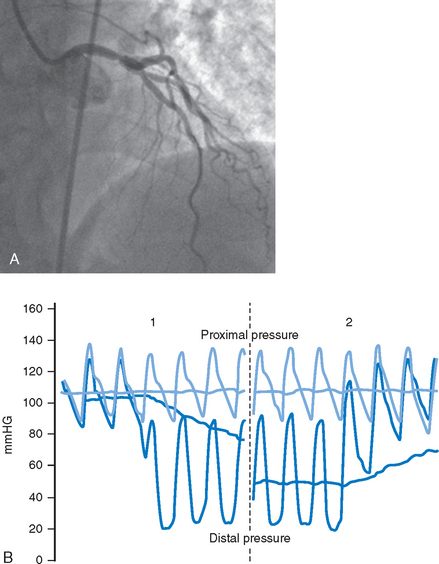
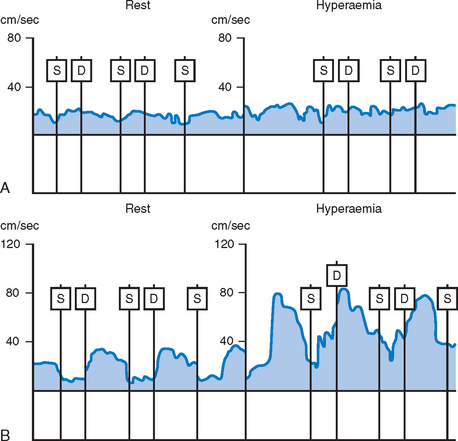
A further use of pressure measurement is to determine the precise location of the lesion under assessment by defining the point at which the measured pressure ‘steps-up’ during pull-back of the wire (Fig. 10.2A and B). A particular area where this has been applied is in the assessment of ostial coronary lesions which may be missed by conventional angiography.
Measurement of the FFR may provide important prognostic information following coronary intervention. An FFR of less than 0.75 implies that the results of the intervention are physiologically unacceptable and would be associated with myocardial ischaemia. An FFR of greater than 0.9 following balloon angioplasty without stenting, has been found to be associated with repeat intervention rates at 6, 12 and 24 months of 12%, 12% and 15% respectively.12 Where the FFR following angioplasty was less than 0.9 the rates of re-intervention at these time points were 24%, 28% and 30%.12 Therefore, even where a satisfactory angiographic appearance has been achieved following balloon angioplasty, obstruction to flow detectable physiologically is associated with an unfavourable outcome.
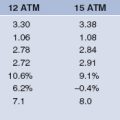
Where a stent has been implanted into a vessel and fully deployed, a pressure drop should no longer be detectable across the treated segment. An FFR across a stent of 0.94 or higher has been found to correlate strongly with optimal stent deployment as determined by intravascular ultrasound (IVUS).13 The concordance rate between the FFR and IVUS parameters was greater than 90% in this study. In contrast, QCA exhibited low concordance rates with both IVUS and FFR, being 48% and 46% respectively.13 Where the FFR was determined immediately following stent implantation, those with an FFR greater that 0.95 had a major adverse event rate of 4.9% at six months follow-up.14 In this study, the event rate rose progressively with successive reductions in post procedural FFR. In those with an FFR between 0.90 and 0.95 the event rate was 6.2%. This rose to 20.3% where the FFR was less than 0.90 and to 29.5% among patients with an FFR under 0.80. These results indicate that the immediate haemodynamic result following coronary intervention exerts an important effect on the subsequent clinical outcome. Measurement of coronary pressure may, therefore, be used to determine both whether intervention is indicated and also if a satisfactory result has been achieved.
FLOW MEASUREMENT
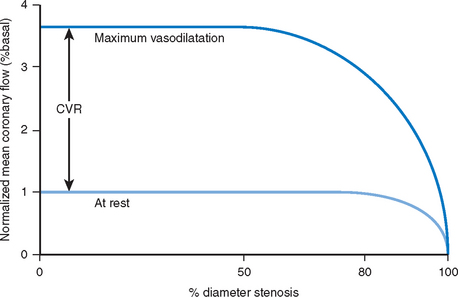
In the presence of significant obstruction to flow within a coronary artery, the downstream microvascular resistance falls to maintain a sufficient regional basal blood flow to meet metabolic demands. This resting dilatation of the microvascular bed results in a reduction in the capacity for further vasodilatation above baseline and reduces the potential maximal flow reserve that is available (Fig. 10.3). Thus any hyperaemic stimulus or increase in myocardial oxygen demand results in a smaller absolute increase in blood flow distal to a stenosis compared to that which would be achieved in a region where no stenosis was present.
Unlike the flow characteristics observed in most arterial beds, coronary blood flow has a distinct phasic pattern. Epicardial blood flow is normally reduced during systole as a result of cardiac contraction.15 The contribution of the systolic component of flow is increased relative to the diastolic component distal to a coronary stenosis.16 Thus the ratio of distal diastolic to systolic flow velocity encountered in normal vessels differs from that found in those with a significant stenosis. However, the application of this finding to the assessment of the haemodynamic significance of coronary stenoses is limited by the differing patterns of flow found in the right and left coronary systems. Also this ratio is sensitive to changes in the contractility of the heart.
As a result of these potentially confounding effects, a doppler derived coronary flow velocity reserve (CVR) has been used to represent the physiological effect of coronary artery stenoses. The CVR is defined as the potential capacity for increased blood flow within both the epicardial coronary vessel and the microvasculature above the resting level (Fig. 10.3). A value of 2.7 +/− 0.6 is typically found for CVR among adults with angiographically normal vessels.17 This figure is relatively constant in differing myocardial regions, even in cardiac transplants. A CVR of less than 2.0 has been found to correspond to the presence of myocardial ischaemia determined by perfusion scanning, stress echocardiography, or exercise testing.18 However, in the absence of epicardial coronary disease the CVR may be abnormal when there is disease of the microvasculature.19 This is typically seen in diabetes mellitus, as a result of ischaemic injury or due to the presence of left ventricular hypertrophy. In the presence of these conditions, the significance of epicardial disease may be overestimated by measurement of CVR alone. When the possibility of microvascular disease exists, the CVR is determined also in a normal reference vessel (CVRreference). The coronary flow velocity reserve in the vessel under investigation may then be expressed relative to that found in the reference vessel:

The normal value of rCVR is typically greater than 0.8.17 As with measurement of the FFR, the rCVR is held to be lesion specific, having removed the contribution of the microvasculature. Both FFR and rCVR have been shown to correlate well with one another across a range of lesion types.20 In a similar fashion to measurement of FFR, the rCVR prior to intervention has been found to bear a strong relationship to the area stenosis as determined by IVUS.20 However, immediately following coronary intervention the relationship between rCVR and IVUS measurements becomes less robust.21 This is in contrast to the strong relationship that exists between FFR and IVUS.
The procedure
Intra-coronary flow velocity is measured with a 0.014 inch guidewire, which has a piezoelectric ultrasound transducer at its tip. Flow velocity is sampled approximately 5 mm from the tip of the wire, the ultrasound beam being approximately 2 mm wide at this point. The wire tip should ideally be positioned coaxially within the artery. However, when the wire is not placed coaxially within the coronary artery, meaningful data may still be obtained. Flow is then recorded both at rest and following the induction of hyperaemia (see Fig. 10.4). This is typically induced by an intra-coronary bolus injection of adenosine, nitrate or papaverine. Assuming that a complete flow velocity profile envelope has been obtained, the mean flow velocity is calculated by dividing the peak velocity by two. The CVR is determined as:
Where rCVR is to be measured, this process is repeated in the reference vessel.
Application of flow measurement
The DEBATE I study (Doppler Endpoints Balloon Angioplasty Trial Europe) demonstrated that a CVR of less than 2.5 following angioplasty combined with a residual percentage diameter stenosis (DS) greater than 35% on IVUS correlated positively with clinical recurrence and need for re-intervention at six months.24 Where a CVR of more than 2.5 was achieved with a satisfactory angiographic result (DS <35%), there was an angiographic restenosis rate and target vessel revascularisation rate of 16% at six months follow-up.24 These later findings are not dissimilar to those observed with the pressure wire. Improvement in the CVR after intervention may, however, not be immediate. In those patients with an initially impaired CVR following angioplasty, it frequently returns to normal during long-term follow-up.21 It has been suggested that this relates to delayed recovery of autoregulation in the microvascular bed following removal of an upstream stenosis. When a coronary stent is deployed, however, the CVR is found to normalise immediately in approximately 80% of patients.25 Stent deployment would be expected to produce a larger, more uniform lumen than balloon angioplasty. It is, therefore, likely that late recovery in CVR following angioplasty relates in part to remodeling of the vessel lumen during follow-up. The DEBATE II study group demonstrated a low CVR following stent deployment to be associated with an adverse short-term outcome.26 This appeared to be related to disturbances in the microvasculature. As with the pressure wire, a suboptimal physiological result following coronary intervention (CVR<2.0) has been found to be predictive of the need for subsequent target lesion revascularisation.27
Coronary intervention may be safely deferred where the CVR is greater than 2.0. In a study by Ferrari et al. 70 patients with intermediate coronary lesions and an indication for angioplasty due to stable angina and/or ischaemia on non-invasive testing underwent study with the doppler wire.28 Patients with a CVR of less than 2.0 underwent balloon angioplasty and in those in whom it was greater than 2.0 the intervention was deferred. During 15 ± 6 months follow-up, a major adverse cardiac event rate of 33.3% was observed among those who had undergone angioplasty compared with 9.1% in those in whom it had been deferred. There was, however, a greater prevalence of angina among those managed medically compared to those in the angioplasty group (60% vs. 47%).
In-direct assessment of flow
In validating this technique a strong correlation has been found between the doppler and thermodilution derived CVR.29 Interestingly in this study an optimal doppler CVR could be obtained in only 69% of patients whereas a thermal CVR was recorded in 97% of patients.
A value for the CVR may be derived from pressure measurements alone when there is a pressure drop within the vessel at rest:30
Though a close relationship has been demonstrated between pressure and thermodilution derived CVR, the pressure-derived technique tends to underestimate CVR.31 This calculation assumes that resistance to flow as a result of friction across a coronary stenosis is negligible.31 However, it is likely that friction at the vessel wall disrupts laminar flow and is an important component of the pressure gradient recorded within a diseased vessel.31
Index of microcirculatory resistance (IMR)
The FFR assesses the effect of epicardial coronary disease on flow and the CVR is altered by both epicardial and microvascular disease (Fig. 10.5). Measurement of IMR allows quantitative assessment of the coronary microcirculation.32 It is calculated after the mean transit time (Tmn) has been determined by bolus injections of saline at hyperaemia:
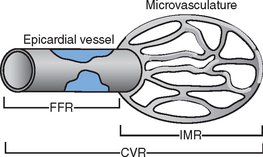

Once collateral flow within the microcirculation has been accounted for, microvascular resistance is independent of epicardial coronary disease.33,34 This technique is not widely used in the clinical setting at the present time. It may in the future, however, become a commonplace technique for the assessment of microvascular damage.
1 Topol EJ, Nissen SE. Our preoccupation with coronary luminology: the dissociation between clinical and angiographic findings in ischaemic heart disease. Circulation. 1995;92:2333-2342.
2 Gould KL, Lipscomb K, Hamilton GW. Physiologic basis for assessing critical coronary stenosis. Instantaneous flow response and regional distribution during coronary hyperemia as measures of coronary flow reserve. Am J Cardiol. 1974;33:87-94.
3 Pijls NH, De Bruyne B, editors. Maximum hyperemic stimuli. Coronary pressure. Kluwer Academic Publishers, Dortrecht, 1997;96-104.
4 Perera D, Biggart S, Postema P, et al. Right atrial pressure: Can it be ignored when calculating fractional flow reserve and collateral flow index? J AM Coll Cardiol. 2004;44:438-442.
5 Pijls NH, Van Gelder B, Van der Voort P, et al. Fractional flow reserve. A useful index to evaluate the influence of an epicardial coronary stenosis on myocardial blood flow. Circulation. 1995;92(11):3183-3193.
6 Pijls NHJ, Kern MJ, Yock PG, De Bruyne B. Practice and potential pitfalls of coronary pressure measurement. Cathet Cardiovasc Interven. 2000;49:1-16.
7 Pijls NH, de Bruyne B, Peels K, et al. Measurement of fractional flow reserve to assess the functional severity of coronary-artery stenoses. N Engl J Med. 1996;334(26):1703-1708.
8 Wilson RF. Assessing the severity of coronary artery stenoses. N Engl J Med. 1996;334:1735-1737.
9 Mates M, Hrabos V, Hajek P, et al. Long-term follow-up after deferral of coronary intervention based on myocardial fractional flow reserve measurement. Coron Artery Disease. 2005;16(3):169-740.
10 Berger A, Botman KJ, MacCarthy PA, et al. Long-term clinical outcome after fractional flow reserve-guided percutaneous coronary intervention in patients with multi-vessel disease. J AM Coll Cardiol. 2005;46(3):438-442.
11 It is necessary to stent non-ischaemic stenoses? Five year follow-up of the DEFER study. Eur Heart J. 26(Suppl.1), 2005.
12 Bech GJW, Pijls NHJ, De Bruyne B, et al. Usefulness of fractional flow reserve to predict clinical outcome after balloon angioplasty. Circulation. 1999;99:883-888.
13 Hanekamp CEE, Koolen JJ, Pijls NHJ, Michels HR, Bonnier HJRM. Comparison of quantitative coronary angiography, intravascular ultrasound, and coronary pressure measurement to assess optimum stent deployment. Circulation. 1999;99:1015-1021.
14 Pijls NH, Klauss V, Seibert U, et al. Coronary pressure measurement after stenting predicts adverse events at follow-up: a multicenter registry. Circulation. 2002;105(25):2950-2954.
15 Sabistorn DCJr, Gregg DE. Effect of cardiac contraction on coronary blood flow. Circulation. 1957;15:14-23.
16 Goto M, Flynn AE, Doucette JW, et al. Effect of intra-coronary nitroglycerin administration on phasic pattern and transmural distribution of flow during coronary artery stenosis. Circulation. 1992;85(6):2296-2304.
17 Kern MJ, Bach RG, Mechem CJ, et al. Variations in normal coronary vasodilatory reserve stratified by artery, gender, heart transplantation and coronary artery disease. J Am Coll Cardiol. 1996;28(5):1154-1160.
18 Heller LI, Cates C, Popma J, et al. Intra-coronary Doppler assessment of moderate coronary artery disease: comparison with 201TI imaging and coronary angiography. FACTS Study Group. Circulation. 1997;96(2):484-490.
19 Strauer BE. The significance of coronary reserve in clinical heart disease. J Am Coll Cardiol. 1990;15(4):775-783.
20 Baumgart D, Haude M, George G, et al. Improved assessment of coronary stenosis severity using the relative flow velocity reserve. Circulation. 1998;98(1):40-46.
21 van Liebergen RAM, Piek JJ, Koch KT, de Winter RJ, Lie KI. Immediate and long-term effect of balloon angioplasty or stent implantation on the absolute and relative coronary blood flow velocity reserve. Circulation. 1998;98(20):2133-2140.
22 Pijls NH, De Bruyne B. Coronary pressure measurement and fractional flow reserve. Heart. 1998;80:539-542.
23 Gould KL, Lipscomb K. Effects of coronary stenoses on coronary flow reserve and resistance. Am J Cardiol. 1974;34:48-55.
24 Serruys PW, Di Mario C, Piek J, et al. Prognostic value of intra-coronary flow velocity and diameter stenosis in assessing the short- and long-term outcomes of coronary balloon angioplasty: the DEBATE Study (Doppler Endpoints Balloon Angioplasty Trial Europe). Circulation. 1997;96(10):3369-3377.
25 Kern MJ, Dupouy P, Drury JH, et al. Role of coronary artery lumen enlargement in improving coronary blood flow after balloon angioplasty and stenting: a combined intravascular ultrasound Doppler flow and imaging study. J Am Coll Cardiol. 1997;29(7):1520-1527.
26 Albertal M, Voskuil M, Piek JJ, et al. Coronary flow velocity reserve after percutaneous interventions is predictive of periprocedural outcome. Circulation. 2002;105(13):1573-1578.
27 Nishida T, Di Mario C, Kern MJ, et al. Impact of final coronary flow velocity reserve on late outcome following stent implantation. Eur Heart J. 2002;23(4):331-340.
28 Ferrari M, Schnell B, Werner GS, Figulla HR. Safety of deferring angioplasty in patients with normal coronary flow velocity reserve. J Am Coll Cardiol. 1999;33(1):82-87.
29 Barbato E, Aarnoudse W, Aengevaren WR, et al. Validation of coronary flow velocity reserve measurements by thermodilution in clinical practice. Eur Heart J. 2004;25(3):219-223.
30 Akasaka T, Yamamuro A, Kamiyama N, et al. Assessment of coronary flow reserve by coronary pressure measurement: comparison with flow- or velocity-derived coronary flow reserve. J Am Coll Cardiol. 2003;41(9):1554-1560.
31 MacCarthy P, Berger A, Manoharan G, et al. Pressure-derived measurement of coronary flow reserve. J Am Coll Cardiol. 2005;45(2):216-220.
32 Fearon WF, Balsam LB, Farouque HM, et al. Novel index for invasively assessing the coronary microcirculation. Circulation. 2003;107(25):3129-3132.
33 Fearon WF, Aarnoudse W, Pijls NH, et al. Microvascular resistance is not influenced by epicardial coronary artery stenosis severity: experimental validation. Circulation. 2004;109(19):2269-2272.
34 Aarnoudse W, Fearon WF, Manoharan G, et al. Epicardial stenosis severity does not affect minimal microcirculatory resistance. Circulation. 2004;110(15):2137-2142.