[level-membership-for-basic-science-category]
CHAPTER 14 Pre- and postnatal development
PRENATAL STAGES
To overcome these difficulties, early embryos have been graded or classified into developmental stages or ‘horizons’, on the basis of both internal and external features. The study of the Carnegie collection of embryos by Streeter (1942, 1945, 1948), and the continuation of this work by O’Rahilly & Müller (1987), provided, and continues to provide, a sound foundation for embryonic study and a means of comparing stages of human development with those of the animals routinely used for experimental study, namely the chick, mouse and rat. Recent use of ultrasound for the examination of human embryos and fetuses in utero has confirmed much of the staging data.
The development of a human from fertilization to birth is divided into two periods, embryonic and fetal. The embryonic period has been defined by Streeter as 8 weeks postfertilization, or 56 days. This timescale is divided into 23 Carnegie stages, a term introduced by O’Rahilly & Müller (1987) to replace developmental ‘horizons’. The designation of stage is based on external and internal morphological criteria and not on length or age.
Embryonic stages
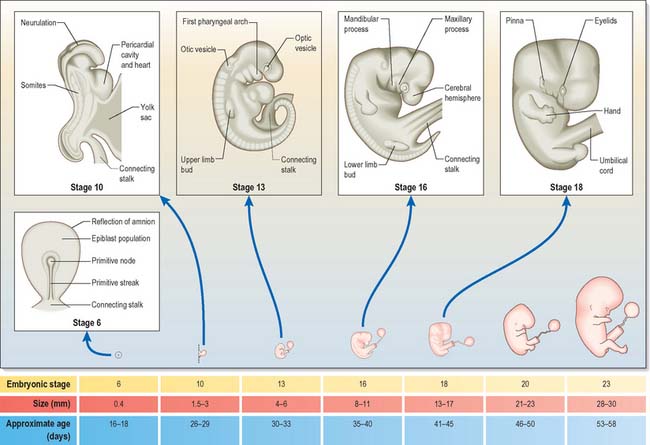
Embryonic stages 1–10 are shown in detail in Fig. 8.1. It should be noted that estimations of embryonic length may be 1–5 mm less than equivalent in vivo estimates, reflecting the shrinkage caused by the fixation procedures that are inevitably used in embryological studies. O’Rahilly & Müller (2000) have revised some of the ages that were previously assigned to early embryonic stages, pointing out that inter-embryonic variation may be greater than had been thought and that consequently some ages may have been underestimated. They note that as a guide, the age of an embryo can reasonably be estimated from the embryonic length within the range 3–30 mm, by adding 27 to the length. Correlating the age of any stage of development to an approximate day may be unreliable, and a generalization using the number of weeks of development might be now more appropriate.
The stages of development encompass all aspects of internal and external morphogenetic change that occur within the embryo within the duration of the stage. They are used to convey a snapshot of the status of the development of all body systems within a particular timeframe. Figure 14.1 shows the external appearance of embryos from stage 6 to stage 23, with details of their size and age in days. The correlation of external appearance of the embryo with internal development is shown in Fig. 14.2.

Fetal staging
Currently there is no satisfactory system of morphological staging of the fetal period of development, and the terminology used to describe this time period reflects this confusion. The terms ‘gestation’, ‘gestational age’ and ‘gestational weeks’ are considered ambiguous by O’Rahilly & Müller (2000) who recommend that they should be avoided. However, they are widely used colloquially within obstetric practice. Staging of fetal development and growth is based on an estimate of the duration of a pregnancy. Whereas development of a human from fertilization to full term averages 266 days, or 9.5 lunar months (28 day units), the start of pregnancy is traditionally determined clinically by counting days from the last menstrual period; estimated in this manner, pregnancy averages 280 days, or 10 lunar months (40 weeks). Figure 14.3 shows the embryonic timescale used in all descriptions of embryonic development and the obstetric timescale used to gauge the stage of pregnancy. Studies that discuss fetal development and the gestational age of neonates, particularly those born before 40 weeks’ gestation, use the clinically estimated stages and age unless they specifically correct for this. If a fetal ageing system is used, it must be remembered that the age of the fetus may be 2 weeks more than a comparable fetus that has been aged from postovulatory days.
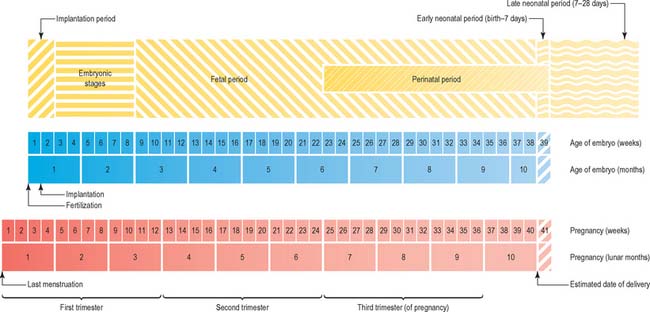
Fig. 14.3 The two timescales used to depict human development. Embryonic development, in the upper scale, is counted from fertilization (or from ovulation, i.e. in postovulatory days; see O’Rahilly & Müller 1987). Throughout this book, times given for development are based on this scale. The clinical estimation of pregnancy is counted from the last menstrual period and is shown on the lower scale; throughout this book, fetal ages relating to neonatal anatomy and growth will have been derived from the lower scale. Note that there is a 2-week discrepancy between these scales. The perinatal period is very long, because it includes all preterm deliveries.
The predicted date of full term and delivery is revised after routine ultrasound examination of the fetus. Early ultrasound estimation of gestation increases the rate of reported preterm delivery (delivery at <37 weeks) compared with estimation based on the date of the last menstrual period (Yang et al 2002), possibly because delayed ovulation is more frequent than early ovulation: the predicted age of a fetus estimated from the date of the last menstrual period may differ by more than 2 weeks from estimates of postfertilization days.
A number of biometric indices used to determine fetal growth in utero have been evaluated ultrasonographically; the consensus appears to be that some revision of fetal gestational age may be required when using charts based on fetal biometry, and that using fewer biometric variables for the estimation produces a larger standard error. First-trimester growth charts based on biparietal diameter, head circumference and abdominal circumference of normal singleton fetuses correlated against crown–rump length (from 45 to 84 mm) are said to be more accurate than gestational age (Salomon et al 2003). O’Rahilly & Müller (2000) recommend that the term ‘crown–rump length’ should be replaced by greatest length, exclusive of lower limbs in ultrasound examination. Femur length/head circumference ratio may be a more robust ratio to characterize fetal proportions than femur length/biparietal diameter (Johnsen et al 2005), and combining kidney length, biparietal diameter, head circumference and femur length also increases the precision of dating (Konje et al 2002). Johnsen et al (2004) reported that analysis of measurements of biparietal diameter and head circumference at 10–24 weeks gestation gave a gestational age assessment of 3–8 days greater than charts in present use.
THE NEONATE
In Western societies, technological advances have enabled successful management of preterm infants, many at ages that were considered non-viable a decade or two previously. Maturational processes involving local interactions and pattern formation still drive development at local and body-system levels in preterm infants. The sudden release of such fetuses into a gaseous environment, of variable temperature, with full gravity and a range of microorganisms, promotes the rapid maturation of some systems and the compensatory growth (in terms of responses to the effect of gravity or enteral feeding or exposure to microorganisms), of others. To understand the multitude of mechanisms that operate within a newly delivered fetus, as much information as possible concerning normal embryological and fetal development is required.
Details of the relative positions of the viscera and the skeleton in a full term neonate are shown in Figs 14.4–14.6. The newborn infant is not a miniature adult, and extremely preterm infants are not the same as full-term infants. There are immense differences in the relations of some structures between the full-term neonate, child and adult, and there are also major differences between the 20-week gestation fetus and the 40-week fetus, just before birth. The study of fetal anatomy at 20, 25, 30 and 35 weeks is vital for the investigative and life-saving procedures carried out on preterm infants today.
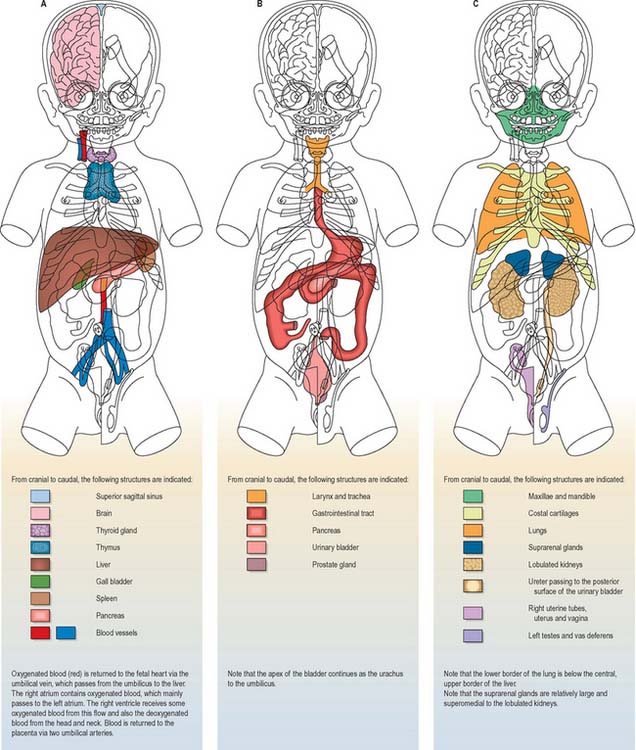
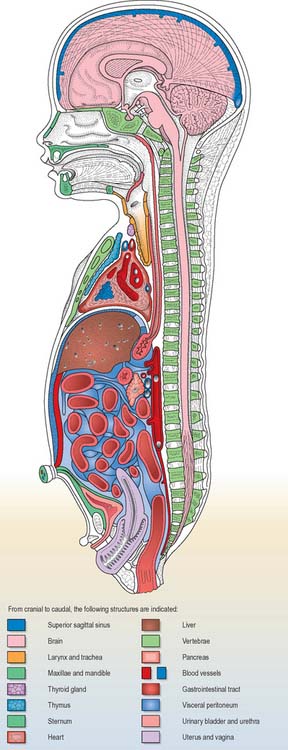
Fig. 14.5 Topographical representation of the anatomy of a full-term female neonate. The cut surfaces of the organs are the same colours as in Fig. 14.4.

Neonatal measurements and period of time in utero
The 10th to 90th centile ranges for length of full-term neonates are 48–53 cm (Fig. 14.7A). Length of the newborn is measured from crown to heel. In utero, length has been estimated either from crown–rump length, i.e. the greatest distance between the vertex of the skull and the ischial tuberosities, with the fetus in the natural curved position, or from the greatest length exclusive of the lower limbs. Greatest length is independent of fixed points and thus much simpler to measure. It is generally taken to be the sitting height in postnatal life, and is the measurement recommended by O’Rahilly & Müller (2000) as the standard in ultrasound examination. The 10th to 90th centile ranges for weight of the full-term infant at parturition ranges are 2700–3800 g (Fig. 14.7B), the average being 3400 g; 75–80% of this weight is body water and a further 15–28% is composed of adipose tissue. After birth, there is a general decrease in the total body water, but a relative increase in intracellular fluid. Normally, the newborn loses about 10% of its birth weight by 3–4 days postnatally, because of loss of excess extra-cellular fluid and meconium. By 1 year, total body water makes up 60% of the body weight.
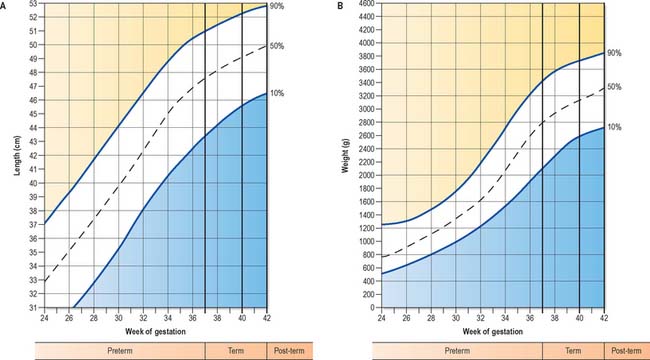
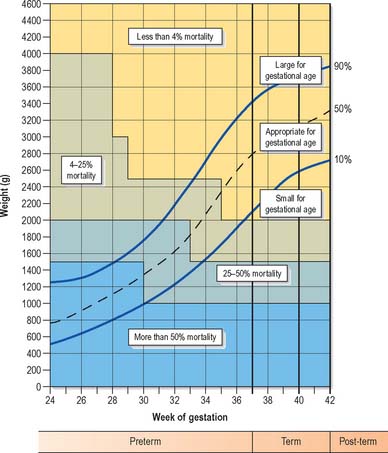
Low birth weight has been defined as less than 2500 g, very low birth weight as less than 1500 g, and extremely low birth weight as less than 1000 g. Infants may weigh less than 2500 g but not be premature by gestational age. Measurement of the range of weights that fetuses may attain before birth has led to the production of weight charts, which allow babies to be described according to how appropriate their birth weight is for their gestational age, e.g. small for gestational age, appropriate for gestational age or large for gestational age (Fig. 14.8). Small for gestational age infants, also termed ‘small-for-dates’, are often the outcome of intrauterine growth retardation. The causes of growth restriction are many and various and beyond the scope of this text.
For both premature and growth-retarded infants, an assessment of gestational age, which correlates closely with the stage of maturity, is desirable. Gestational age at birth is predicted by its proximity to the estimated date of delivery and the results of ultrasonographic examinations during pregnancy. It is currently assessed in the neonate by evaluation of a number of external physical and neuromuscular signs. Scoring of these signs results in a cumulative score of maturity that is usually within ±2 weeks of the true age of the infant. The scoring scheme has been devised and improved over many years. For an account of methods of assessing gestational age in neonates, consult Gandy (1992).
INTEGRATION OF TYPES OF GROWTH DURING DEVELOPMENT
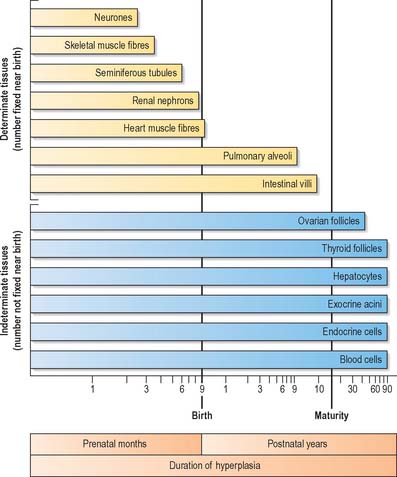
In the later prenatal months and in the postnatal period, the various types of growth occur in differing patterns. The extent of tissue growth in organs depends on the specific duration of multiplicative growth for the cell types (Fig. 14.9). Different cell populations complete their initial developmental proliferation and become differentiated at different times, the final stage of differentiation usually being cessation of cell division.
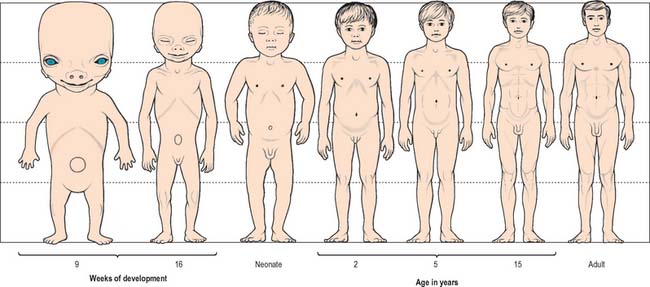
Growth of a body can be described in two ways, isometric and allometric. Isometric growth implies a progressive proportional increase in all organs and systems with time: it does not occur in the developing embryo, which displays differential rates of growth. Allometric growth describes the differences in the relative rates of growth between one part of the body and another, and is most clearly seen in the changes in body proportion between fetuses, neonates, children and adults. Between 6 and 7 weeks after fertilization, the head is nearly one-half of the total embryonic length. It subsequently grows proportionally more slowly, and at birth it is one-quarter of the entire length. During childhood, this pattern of growth continues with lengthening of the torso and limbs until, in adults, the head is one-eighth the length (Fig. 14.10).
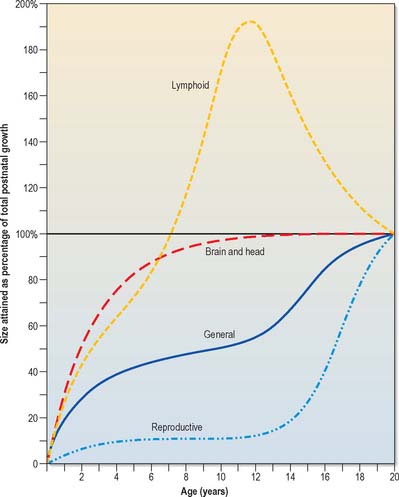
Growth of the liver, spleen and kidneys, and skeletal and muscular tissues generally follow pre- and postnatal growth curves given for the entire body. Other tissues have very different growth rates; the brain, skull, lymphoid tissues and reproductive organs all show differing growth rates during childhood and adolescence (Fig. 14.11).
GROWTH IN UTERO
Alterations in the availability of nutrients to the fetus at particular stages of pregnancy elicit adaptive responses by the fetus that ensure fetal coping, but which may result in pathology in adult life: the nutritional status of pregnant women is therefore of fundamental importance for the health of the next generation. For example, poor nutrition at critical stages of fetal life may permanently alter the normal developmental pattern of a range of organs and tissues, e.g. the endocrine pancreas, liver and blood vessels, resulting in their pathological responses to certain conditions in later adult life (Barker et al 1993). An increase in placental size occurs in pregnancy as an adaptive response to both high altitude and mild undernutrition, particularly during mid-pregnancy. However, although a larger placenta may be better able to deliver the full nutritional requirements of the fetus, the perfusion of a larger placenta is not without problems. It may produce changes in fetal blood flow and placental enzymes, and in the normal structure of the fetal vessel wall or of its responses to circulating trophins, e.g. catecholamines or angiotensin II, which will continue into adult life. Undernutrition in later pregnancy does not produce the same sequelae and placental enlargement does not occur. However, fetal growth slows and fetal wasting may occur as oxygen, glucose and amino-acids are redistributed to the placenta to maintain its function.
It is now thought that the balance of hormonal environment in intrauterine and early postnatal life is necessary for future adult health. The presence of altered concentrations of hormones during critical periods of development may act as endogenous functional teratogens (Plagemann 2004).
Different birth phenotypes have been correlated with different pathological sequelae. Infants who are thin at birth, with a low ponderal index (weight/length3), tend to develop a combination of insulin resistance, hypertension, non-insulin-dependent diabetes and lipid dis-orders, whereas those who are short in relation to head size tend to develop hypertension and high plasma fibrinogen concentrations. These associations have been reported in babies born small for dates, rather than in those born prematurely. Some babies of average weight also develop cardiovascular pathology: they were either small at birth in relation to the size of their placenta, and thin at birth or, although of average weight, were short in relation to head size and had below average weight gain during the first year (Barker et al 1993). For more recent views on this concept the reader is directed to consult Godfrey & Barker (2000) and Gluckman et al (2005).
GROWTH IN CHILDHOOD
The rates of prenatal and postnatal growth can be indicated by increments in body length or weight which, when plotted, form a growth curve (see Fig. 14.7). Growth curves can be plotted for individuals if accurate measurements are taken, preferably by the same person, for the entire period of growth, i.e. a longitudinal study. An alternative method is to collect a series of averages for each year of age obtained from different individuals, i.e. a cross-sectional study. Cross-sectional studies are valuable for the construction of standards for height and weight attained by healthy children at specific ages, and can establish percentile limits of normal growth, but they cannot reveal individual differences in either the rate of growth or the timing of particular phases of growth.
The data from longitudinal and cross-sectional studies can also be used to plot the increments in height or weight from one age to the next. This produces a velocity curve, which reflects a child’s state at any particular time much better than the growth curve, in which each point is dependent on the preceding one. The oldest published longitudinal study, still of great value today, was made by Count Philibert de Montbeillard on his son (Fig. 14.12). It shows that the velocity of growth in height decreases from birth onwards, and that a marked acceleration of growth, the adolescent growth spurt, occurs from 13 to 15 years (see below; Fig 14.13).
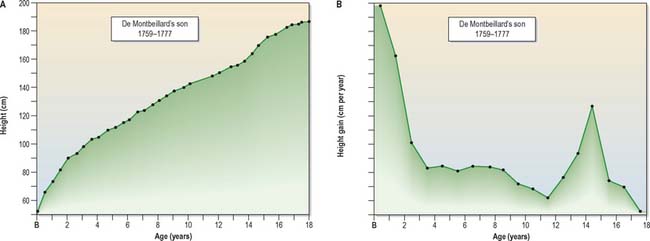
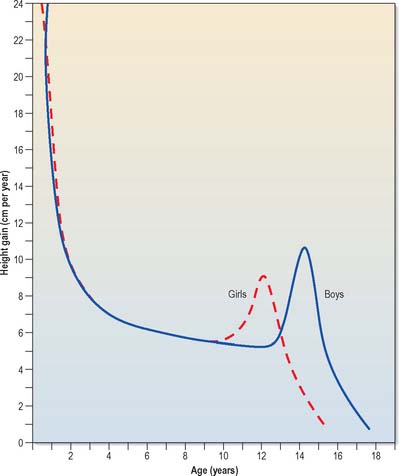
Fig. 14.13 Typical individual velocity curves for height: English boys and girls.
(After Tanner JM, Whitehouse RH, Takaishi IM 1966 Standards from birth to maturity for height, weight, height velocity and weight velocity. Arch Dis Child 41: 454–71, with permission from BMJ Publishing.)
Cross-sectional data permit comparison of prenatal and postnatal growth. Childhood growth charts are used to predict normal childhood development. The velocity curve for the prenatal and postnatal period (Fig. 14.14) shows that the peak velocity for length is reached at about 4 months (note that these prenatal charts use the obstetric measurements of gestational time, in which fetal age is estimated from the last menstrual period, 2 weeks before fertilization). Growth in weight usually reaches its peak velocity after birth.

Growth has always been regarded as a regular process. Tanner (in Harrison et al 1964) noted that the more carefully measurements are taken, the more regular is the succession of points on a growth curve. However, a longitudinal study of growth measured weekly, semi-weekly and daily, recorded that growth in length and head circumference occurred by saltatory increments, with a mean amplitude of 1.01 cm for length (Lampl 2002); growth stasis, steep changes in growth and incremental growth have all been recorded in infancy, childhood and adolescence (Caino et al 2006).
Charts of height and weight correlated to age are compiled from extensive cross-sectional growth studies. Such charts show the mean height or weight attained at each age, termed the 50th centile, and also the centile lines for the 75th, 90th and 97th centiles, in addition to the 25th, 9th and 2nd centiles. The data shown in Fig. 14.15 are derived from United Kingdom cross-sectional references. Any comparison of an individual growth curve with these data must also take into account ethnicity and the nutritional and family history of that individual.
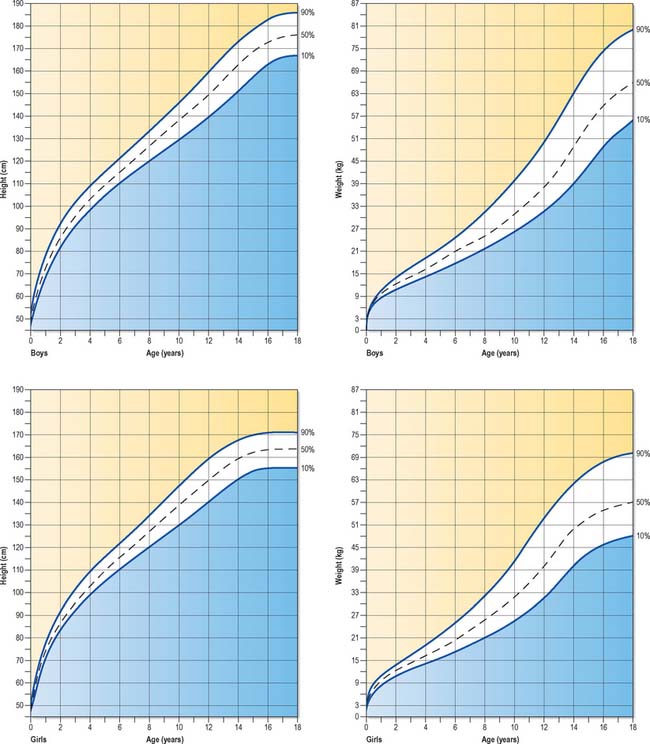
Fig. 14.15 Standard growth charts of boys and girls showing the 90th, 50th and 10th centiles.
(© Child Growth Foundation.)
Plotting the growth of children on such charts provides guidelines for the prediction of normal growth and indicates when investigation of possible growth abnormalities should occur. Children who grow in an environment that does not constrain their growth exhibit a pattern of growth that is mainly parallel to a particular centile, a phenomenon that has been termed homeorhesis or canalization (following the same imaginary ‘canal’ on the growth chart). After deviation from this centile as a consequence of the adolescent growth spurt, most children return to the same centile position in adulthood, a finding that suggests that this pattern is genetically determined within individuals (Cameron 2002). For a comprehensive account on all aspects of postnatal growth the reader is directed to consult Human Growth and Development (Cameron 2002).
ADOLESCENT GROWTH SPURT
Growth charts reveal that body length increases from a neonatal range of 48–53 cm to about 75 cm during the first year after birth, and increases by 12–13 cm in the second year. Thereafter, 5–6 cm is added each year. In individual longitudinal growth curves, an increase in the velocity of growth occurs between 10.5 and 11 years in girls, and 12.5 and 13 years in boys. This rapid increase in growth is the adolescent growth spurt (Figs 14.13 and 14.15). In both sexes it lasts for 2–2.5 years. Girls gain about 16 cm in height during the spurt, with a peak velocity at 12 years of age. Boys gain about 20 cm in height (mostly by growth of the trunk), with a peak velocity at 14 years of age, during which time they may be growing at the rate of 10 cm a year.
Growth in height continues at a slower rate after the adolescent growth spurt. Noticeable growth is said to stop at 18 years in females and 20 years in males (longitudinal studies have indicated that an average figure for this is 16.25 years for girls and 17.75 years for boys, with a normal variation of ±2 years (Harrison et al 1964)). After this time, any increments that occur as a result of appositional growth at the cranial and caudal ends of the vertebral bodies and intervening intervertebral discs are so small as to be difficult to measure. There is a loss of height after middle age.
Barker DJP, Osmond C, Simmonds SJ, Wield GA. The relation of head size and thinness at birth to death from cardiovascular disease in adult life. BMJ. 1993;306:422-426.
Caino S, Kelmansky D, Adamo P, Lejarraga H. Short-term growth in healthy infants, schoolchildren and adolescent girls. Ann Hum Biol. 2006;33:213-226.
Cameron N. Human Growth and Development. New York: Academic Press, 2002.
Gandy GM. Examination of the neonate including gestational assessment. In: Robertson NRC, editor. Textbook of Neonatology. Edinburgh: Churchill Livingstone; 1992:199-215.
Gluckman PD, Hanson MA, Morton SM, Pinal CS. Life-long echoes: a critical analysis of the developmental origins of adult disease model. Biol Neonate. 2005;87:127-139.
Godfrey KM, Barker DJ. Fetal nutrition and adult disease. Am J Clin Nutr. 2000;71:1344S-1352S.
Harrison GA, Weiner JS, Tanner JM, Barnicot NA. Human Biology. Oxford: Clarendon Press, 1964. Ch. 19.
Presents data on the human growth curve..
Johnsen SL, Rasmussen S, Sollien R, Kiserud T. Fetal age assessment based on ultrasound head biometry and the effect of maternal and fetal factors. Acta Obstet Gynecol Scand. 2004;83:716-723.
Johnsen SL, Rasmussen S, Sollien R, Kiserud T. Fetal age assessment based on femur length at 10–25 weeks of gestation, and reference ranges for femur length to head circumference ratios. Acta Obstet Gynecol Scand. 2005;84:725-733.
Konje JC, Abrams KR, Bell SC, Talyor DJ. Determination of gestational age after the 24th week of gestation from fetal kidney length measurements. Ultrasound Obstet Gynecol. 2002;19:592-597.
Lampl M. Saltation and stasis. In: Cameron N, editor. Human Growth and Development. New York: Academic Press, 2002. Ch. 12.
Presents the evidence for saltatory growth in humans..
O’Rahilly R, Müller F. Developmental Stages in Human Embryos. Washington: Carnegie Institution, 1987.
O’Rahilly R, Müller F. The Embryonic Human Brain. An Atlas of Developmental Stages. 2nd edn.. New York: Wiley-Liss; 1999.
O’Rahilly R, Müller F. Minireview: prenatal ages and stages – measures and errors. Teratology. 2000;61:382-384.
Plagemann A. ‘Fetal programming’ and ‘functional teratogenesis’: on epigenetic mechanisms and prevention of perinatally acquired lasting health risks. J Perinat Med. 2004;32:297-305.
Salomon LJ, Bernard JP, Duyme M, Dorion A, Ville Y. Revisiting first-trimester fetal biometry. Ultrasound Obstet Gynecol. 2003;22:63-66.
Streeter GL. Developmental horizons in human embryos. Descriptions of age group XI, 13 to 20 somites, and age group XII, 21 to 29 somites. Contrib Embryol Carnegie Inst Washington. 1942;30:211-245.
Streeter GL. Developmental horizons in human embryos. Description of age group XIII, embryos of about 4 or 5 millimeters long, and age group XIV, period of indentation of the lens vesicle. Contrib Embryol Carnegie Inst Washington. 1945;31:27-63.
Streeter GL. Developmental horizons in human embryos. Description of age groups XV, XVI, XVII, and XVIII, being the third issue of a survey of the Carnegie collection. Contrib Embryol Carnegie Inst Washington. 1948;32:133-203.
Yang H, Kramer MS, Platt RW, Blondel B, Breat G, Mornin I, Wilkins R, Usher R. How does early ultrasound scan estimation of gestational age lead to higher rates of preterm birth? Am J Obstet Gynecol. 2002;186:433-437.
[/level-membership-for-basic-science-category][not-level-membership-for-basic-science-category]
CHAPTER 14 Pre- and postnatal development
PRENATAL STAGES
To overcome these difficulties, early embryos have been graded or classified into developmental stages or ‘horizons’, on the basis of both internal and external features. The study of the Carnegie collection of embryos by Streeter (1942, 1945, 1948), and the continuation of this work by O’Rahilly & Müller (1987), provided, and continues to provide, a sound foundation for embryonic study and a means of comparing stages of human development with those of the animals routinely used for experimental study, namely the chick, mouse and rat. Recent use of ultrasound for the examination of human embryos and fetuses in utero has confirmed much of the staging data.
The development of a human from fertilization to birth is divided into two periods, embryonic and fetal. The embryonic period has been defined by Streeter as 8 weeks postfertilization, or 56 days. This timescale is divided into 23 Carnegie stages, a term introduced by O’Rahilly & Müller (1987) to replace developmental ‘horizons’. The designation of stage is based on external and internal morphological criteria and not on length or age.
Embryonic stages
Embryonic stages 1–10 are shown in detail in Fig. 8.1. It should be noted that estimations of embryonic length may be 1–5 mm less than equivalent in vivo estimates, reflecting the shrinkage caused by the fixation procedures that are inevitably used in embryological studies. O’Rahilly & Müller (2000) have revised some of the ages that were previously assigned to early embryonic stages, pointing out that inter-embryonic variation may be greater than had been thought and that consequently some ages may have been underestimated. They note that as a guide, the age of an embryo can reasonably be estimated from the embryonic length within the range 3–30 mm, by adding 27 to the length. Correlating the age of any stage of development to an approximate day may be unreliable, and a generalization using the number of weeks of development might be now more appropriate.
The stages of development encompass all aspects of internal and external morphogenetic change that occur within the embryo within the duration of the stage. They are used to convey a snapshot of the status of the development of all body systems within a particular timeframe. Figure 14.1 shows the external appearance of embryos from stage 6 to stage 23, with details of their size and age in days. The correlation of external appearance of the embryo with internal development is shown in Fig. 14.2.
Fetal staging
Currently there is no satisfactory system of morphological staging of the fetal period of development, and the terminology used to describe this time period reflects this confusion. The terms ‘gestation’, ‘gestational age’ and ‘gestational weeks’ are considered ambiguous by O’Rahilly & Müller (2000) who recommend that they should be avoided. However, they are widely used colloquially within obstetric practice. Staging of fetal development and growth is based on an estimate of the duration of a pregnancy. Whereas development of a human from fertilization to full term averages 266 days, or 9.5 lunar months (28 day units), the start of pregnancy is traditionally determined clinically by counting days from the last menstrual period; estimated in this manner, pregnancy averages 280 days, or 10 lunar months (40 weeks). Figure 14.3 shows the embryonic timescale used in all descriptions of embryonic development and the obstetric timescale used to gauge the stage of pregnancy. Studies that discuss fetal development and the gestational age of neonates, particularly those born before 40 weeks’ gestation, use the clinically estimated stages and age unless they specifically correct for this. If a fetal ageing system is used, it must be remembered that the age of the fetus may be 2 weeks more than a comparable fetus that has been aged from postovulatory days.
Fig. 14.3 The two timescales used to depict human development. Embryonic development, in the upper scale, is counted from fertilization (or from ovulation, i.e. in postovulatory days; see O’Rahilly & Müller 1987). Throughout this book, times given for development are based on this scale. The clinical estimation of pregnancy is counted from the last menstrual period and is shown on the lower scale; throughout this book, fetal ages relating to neonatal anatomy and growth will have been derived from the lower scale. Note that there is a 2-week discrepancy between these scales. The perinatal period is very long, because it includes all preterm deliveries.
The predicted date of full term and delivery is revised after routine ultrasound examination of the fetus. Early ultrasound estimation of gestation increases the rate of reported preterm delivery (delivery at <37 weeks) compared with estimation based on the date of the last menstrual period (Yang et al 2002), possibly because delayed ovulation is more frequent than early ovulation: the predicted age of a fetus estimated from the date of the last menstrual period may differ by more than 2 weeks from estimates of postfertilization days.
A number of biometric indices used to determine fetal growth in utero have been evaluated ultrasonographically; the consensus appears to be that some revision of fetal gestational age may be required when using charts based on fetal biometry, and that using fewer biometric variables for the estimation produces a larger standard error. First-trimester growth charts based on biparietal diameter, head circumference and abdominal circumference of normal singleton fetuses correlated against crown–rump length (from 45 to 84 mm) are said to be more accurate than gestational age (Salomon et al 2003). O’Rahilly & Müller (2000) recommend that the term ‘crown–rump length’ should be replaced by greatest length, exclusive of lower limbs in ultrasound examination. Femur length/head circumference ratio may be a more robust ratio to characterize fetal proportions than femur length/biparietal diameter (Johnsen et al 2005), and combining kidney length, biparietal diameter, head circumference and femur length also increases the precision of dating (Konje et al 2002). Johnsen et al (2004) reported that analysis of measurements of biparietal diameter and head circumference at 10–24 weeks gestation gave a gestational age assessment of 3–8 days greater than charts in present use.
