11 Posterior segment
Anatomy
Vitreous
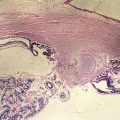
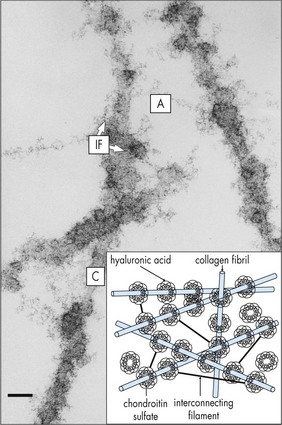
Composed of 99% water and a few type II (mainly) and type IX collagen fibers; viscous, gel-like quality from mucopolysaccharide and hyaluronic acid that is folded into coiled chains and holds water like a sponge; volume ∼4 cm3; syneresis (liquefaction) occurs with aging (Figures 11-1, 11-2).
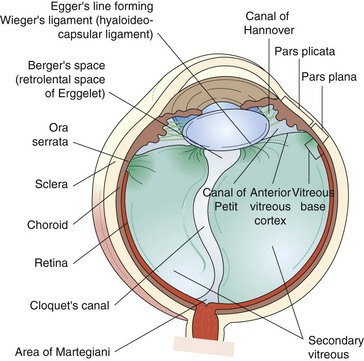
Figure 11-1 Vitreous anatomy according to classic anatomic and histologic studies.
(From Schepens CL, Neetens A: The Vitreous and Vitreoretinal Interface. New York, Springer-Verlag, 1987.)
Retina (Figure 11-3)
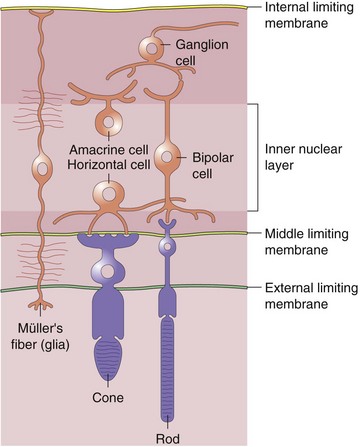
Neurosensory Retina (9 Layers)
Inner refers to proximal or vitreous side of retina
 of retina receives its nourishment from retinal vasculature (outer
  from choroid); contains cell bodies of bipolar, amacrine (confined to inner surface), horizontal (confined to outer surface), and Müller’s (span from ILM [foot processes] to ELM [microvilli, which point toward RPE]) cells
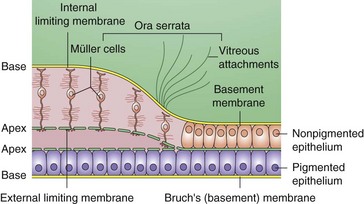
Peripheral Retina
Extends from macula to ora serrata, nonpigmented epithelium is contiguous with pars plana; defined as any area of the retina with a single layer of ganglion cells (Figure 11-5)
Macula
Area of retina in which ganglion cell layer is more than 1 cell thick (5–6 mm in diameter)
Centered 4 mm temporal and 0.8 mm inferior to optic nerve
Differentiation of the macula does not occur until age 4–6 months old
Fovea (Figures 11-6, 11.7)
Central depression of inner retinal surface (1.5 mm in diameter) within macula
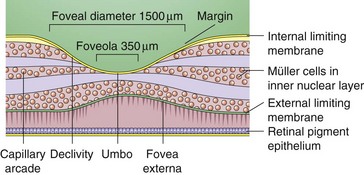
Figure 11-6 Foveal margin, foveal declivity, foveola, and umbo.
(From Schubert HD: Structure and function of the neural retina. In: Yanoff M, Duker JS (eds) Ophthalmology. London, Mosby, 1999.)
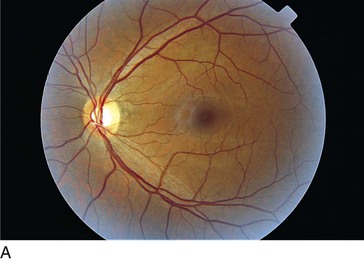
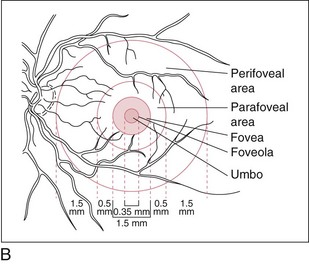
Figure 11-7 Normal fundus with macula encompassed by major vascular arcades.
(From Schubert HD: Structure and function of the neural retina. In: Yanoff M, Duker JS (eds) Ophthalmology. London, Mosby, 1999.)
Foveola
Central area of fovea (350 µm in diameter)
Absence of ganglion cells and other nucleated cells; avascular
Clinical Correlation
Collateral vessels: occur at site of obstruction, across horizontal raphe, and at disc
RPE
Monolayer of hexagonal cells with apical microvilli and basement membrane at base
Merges anteriorly with pigmented epithelium of ciliary body
Functions
RPE cells may undergo hypertrophy, hyperplasia, migration, atrophy, and metaplasia
Choroid
Layers
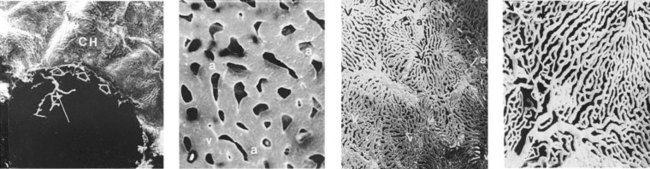
Figure 11-8 Human choriocapillaris, retinal view.
(From Fryczkowski AW: Anatomical and functional choroidal lobuli. Int Ophthalmol 18:131–141, 1994.)
Endothelium is permeable to large molecules
Drains via vortex veins to superior and inferior ophthalmic veins
Physiology
Visual pigments
4 types, each composed of 11-cis-retinal (vitamin A aldehyde) + a protein (opsin); 3 cone pigments and 1 rod pigment (Table 11-1)
| Photoreceptor | Pigment | Peak sensitivity |
|---|---|---|
| Rod | Rhodopsin | 505 nm |
| Red cones | Erythrolabe | 575 nm |
| Green cones | Chlorolabe | 545 nm |
| Blue cones | Cyanolabe | 445 nm |
Rod photoreceptor membranes
lipid bilayer in which rhodopsin is an integral component
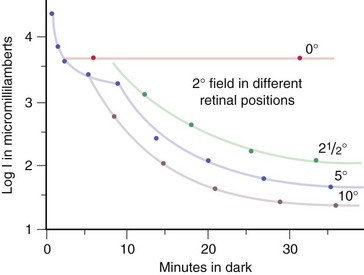
Luminosity curves
Electrophysiology
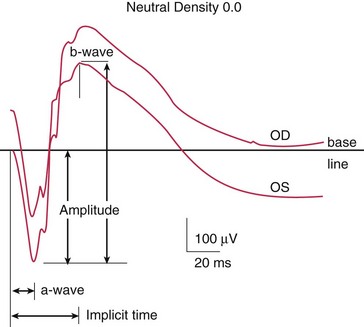
Electroretinogram (ERG)
Measures mass retinal response; useful for processes affecting large areas of retina
Photoreceptors, bipolar and Müller’s cells contribute to flash ERG; ganglion cells do not
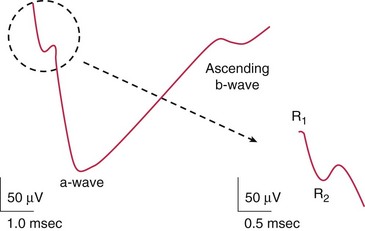
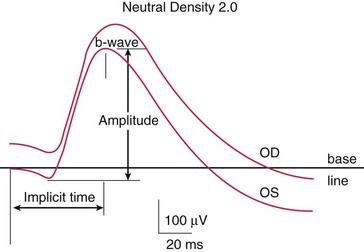
Components (Figure 11-10)
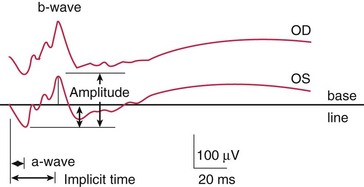
Photopic (light adapted)
Scotopic (dark adapted)
measures rod function; dark adapted for 30 min (Figure 11-12)
Disease states (Figure 11-14, Table 11-2)
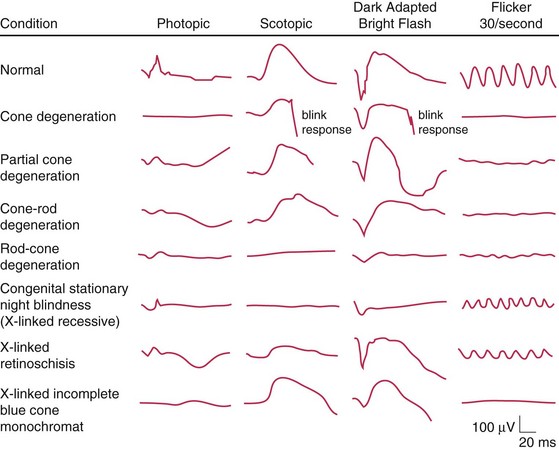
| Extinguished ERG abnormal photopic, normal ERG | Normal a-wave, reduced b-wave | Abnormal photopic, normal scotopic ERG |
|---|---|---|
| RP | CSNB; Oguchi’s disease | Achromotopsia |
| Ophthalmic artery occlusion | X-linked juvenile retinoschisis | Cone dystrophy |
| DUSN | CVO | |
| Metallosis | CRAO | |
| RD | Myotonic dystrophy | |
| Drug toxicity (phenothiazine; chloroquine) | Quinine toxicity | |
| Cancer-associated retinopathy |
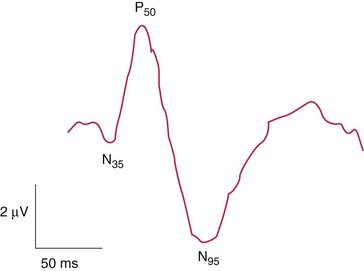
Pattern ERG (PERG)
waveform similar to flash ERG, but different test to measure ganglion cell activity; stimulus is an alternating checkerboard pattern that gives a constant illumination to the retina (Figure 11-15)
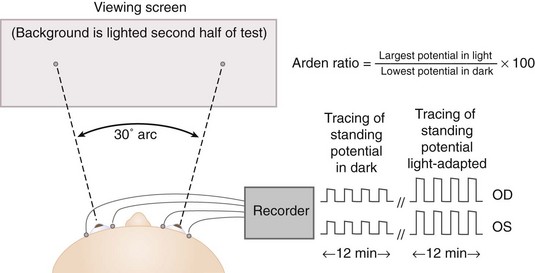
Electro-oculogram (EOG)
Indirect measure of standing potential of eye (voltage difference between inner and outer retina) (Figure 11-16)
Retinal Imaging
Optical Coherence Tomography (OCT)
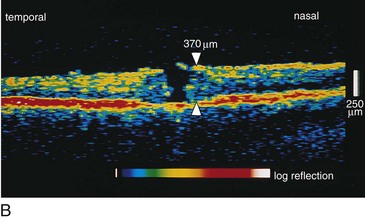
Creates cross-sectional image of tissue using light
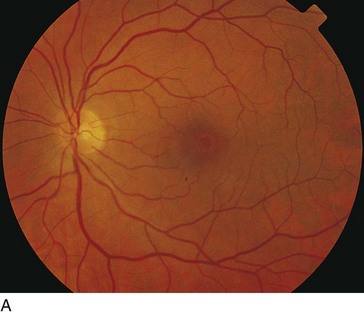
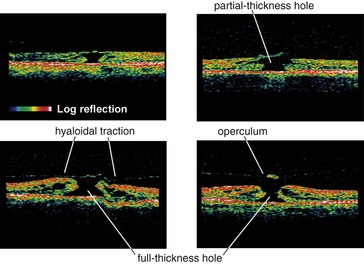
Useful for optic nerve (glaucoma) and macular pathology (edema, hole, pucker); can compare thickness in cases of macular edema from one visit to next; can diagnose and differentiate vitreomacular pathology e.g. stage 1 macular hole vs full-thickness hole (≥stage 2) vs pseudohole or lamellar holes (Figures 11-17, 11-18)
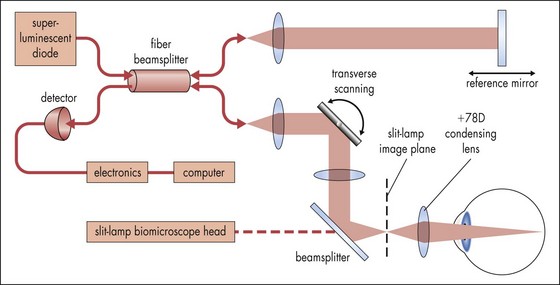
Figure 11-17 Optical coherence tomography principle.
(Adapted from Shuman JS, Hee MR, Puliafito CA et al: Quantification of nerve fiber layer thickness in normal and glaucomatous eyes using optical coherence tomography. Arch Ophthalmol 113:586-596, 1995. From: Yanoff M, Duker JS (eds) Ophthalmology. London, Mosby, 1999.)
Ultrasound
Acoustic imaging of globe and orbit
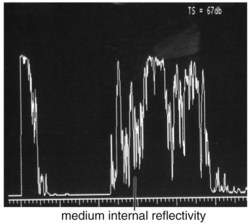
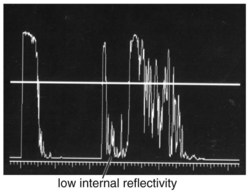
A-scan
1-dimensional display (amplitude of echoes plotted as vertical height against distance) (Figures 11-19 to 11-21)
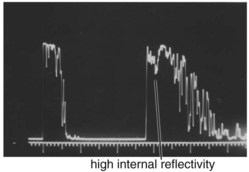
Figure 11-19 A-scan ultrasound demonstrating high internal reflectivity.
(From Friedman NJ, Kaiser PK, Pineda R II: The Massachusetts Eye and Ear Infirmary Illustrated Manual of Ophthalmology. 3rd ed. Philadelphia, Elsevier, 2009.)
B-scan
2-dimensional display (amplitude of echoes represented by brightness on a grey scale image) (Figure 11-22)
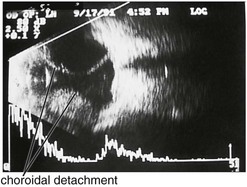
Specific lesions
(Tables 11-3 and 11-4) (Figures 11-22 to 11-27)
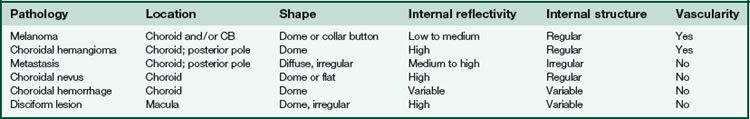
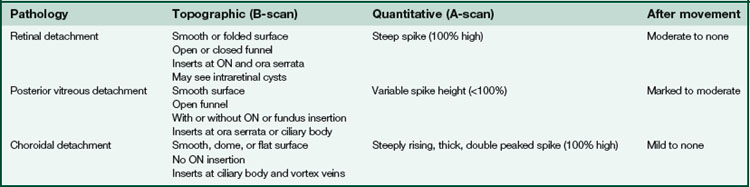
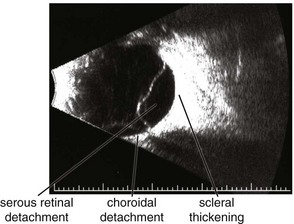
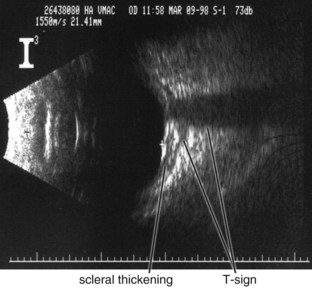
Figure 11-24 B-scan ultrasound demonstrating scleral thickening and the characteristic peripapillary T sign.
(From Kaiser PK, Friedman NJ, Pineda R II: Massachusetts Eye and Ear Infirmary Illustrated Manual of Ophthalmology, 2nd edn. Philadelphia, Saunders, 2004.)
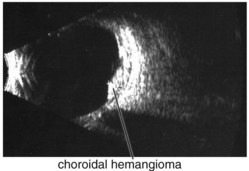
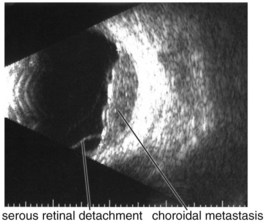
Figure 11-25 B-scan ultrasound demonstrating elevated mass with underlying thickened choroid.
(From Kaiser PK, Friedman NJ, Pineda R II: Massachusetts Eye and Ear Infirmary Illustrated Manual of Ophthalmology, 2nd edn. Philadelphia, Saunders, 2004.)
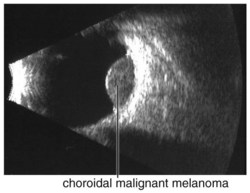
Figure 11-26 B-scan ultrasound demonstrating dome-shaped choroidal mass.
(From Kaiser PK, Friedman NJ, Pineda R II: Massachusetts Eye and Ear Infirmary Illustrated Manual of Ophthalmology, 2nd edn. Philadelphia, Saunders, 2004.)
Fluorescein Angiogram (FA)
Phases
choroidal filling, arterial, venous, recirculation
Characteristics
Indocyanine Green (ICG)
98% bound to serum proteins (80% to globulins); therefore, leaks very slowly from choroidal circulation allowing enhanced imaging of the choroidal circulation; CNV often appears as hot spot (bright area; occurs within 3–5 min, lasts 20 min) (Figure 11-33)
Disorders
Vitreous Abnormalities
Asteroid Hyalosis
Refractile particles (calcium soaps) suspended in vitreous
More common in older patients and those with diabetes; 25% bilateral
Synchisis Scintillans (Cholesterol Bulbi)
Cholesterol crystals derived from old vitreous hemorrhage; with PVD crystals settle inferiorly
Occurs after blunt or penetrating trauma in blind eyes
Crystals sink to bottom of globe because no fixed vitreous framework
Retinal Abnormalities
Trauma
Commotio Retinae (Berlin’s Edema)
Pigmentary changes can occur (RPE hyperplasia); traumatic macular hole may develop; usually resolves without sequelae (Figure 11-34)
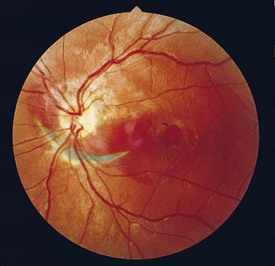
Choroidal Rupture
Tear in choroid, Bruch’s membrane, and RPE due to blunt or penetrating trauma
Retina Sclopetaria
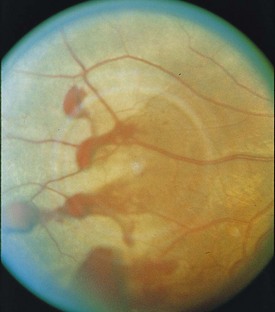
Traumatic Retinal Tear
Most patients are young with formed vitreous that tamponades the tear
As vitreous liquefies over time, fluid passes through breaks, causing retina to detach
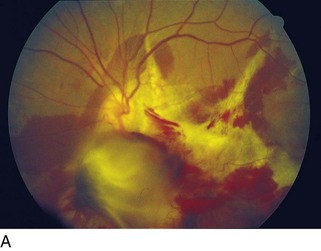
Purtscher’s Retinopathy
Terson’s Syndrome
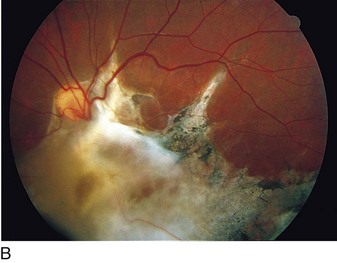
20% of patients with spontaneous or traumatic subarachnoid hemorrhage will present with vitreous hemorrhage; bleeding can also occur between ILM and retina (Figure 11-38)
Macular Diseases
Epiretinal Membrane (Cellophane Maculopathy, Macular Pucker)
Proliferations at vitreoretinal junction, may contract and cause retinal folds and macular edema
Macular Hole
Due to tangential traction on foveal region by posterior cortical vitreous
Most commonly idiopathic (senile); may develop after trauma, surgery, CME, or inflammation
Gass classification (Figure 11-39)
Watzke-Allen sign
shine narrow-slit beam over macular hole, positive if patient perceives ‘break’ in slit beam
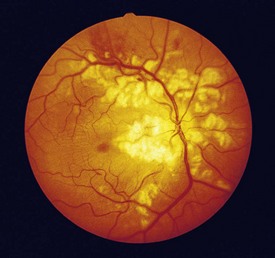
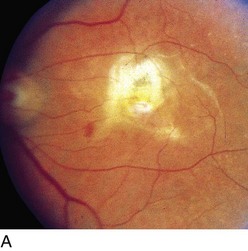
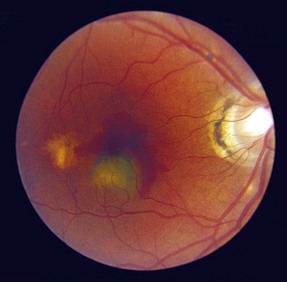
Solar Retinopathy (Figure 11-40)
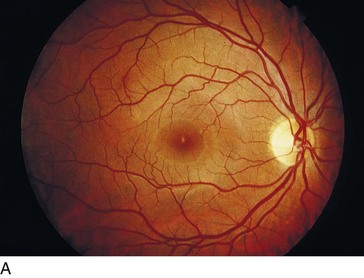
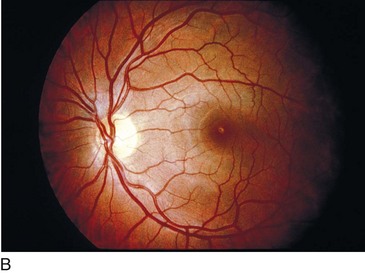
Figure 11-40 Solar retinopathy of both eyes.
(Courtesy of William E. Benson. From Baumal CR: Light toxicity and laser burns. In: Yanoff M, Duker JS (eds) Ophthalmology. London, Mosby, 1999.)
With foveal fixation, retinal image of sun is 160 µm and is usually within the foveola and FAZ
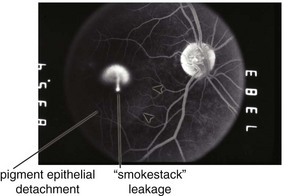
Central Serous Retinopathy / Chorioretinopathy (CSR) / Idiopathic Central Serous Choroidopathy (ICSC)
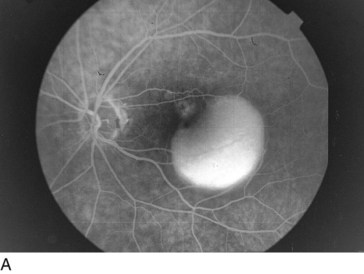
Serous retinal detachment ± retinal pigment epithelium detachment (PED) (Figure 11-42)
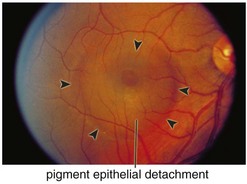
Figure 11-42 Idiopathic central serous retinopathy with large serous retinal detachment.
(From Kaiser PK, Friedman NJ, Pineda R II: Massachusetts Eye and Ear Infirmary Illustrated Manual of Ophthalmology, 2nd edn. Philadelphia, Saunders, 2004.)
Males (80%), typically in 4th–5th decade
Associated with hypertension, steroid use, psychiatric medication use, and type A personality
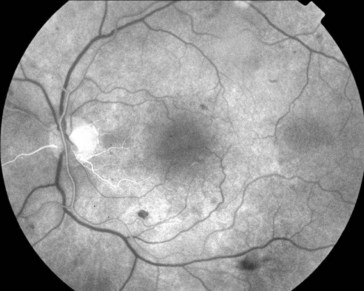
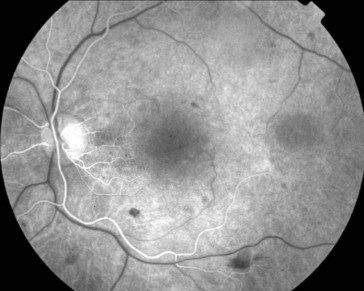
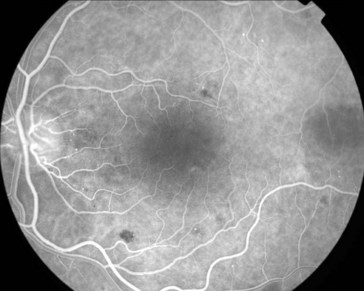
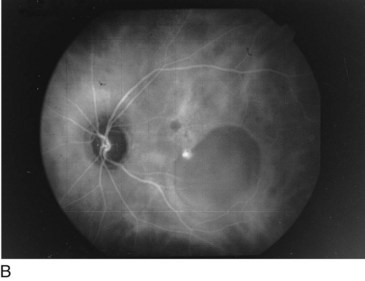
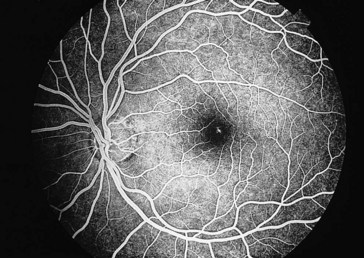
FA
small focal hyperfluorescent dot (leakage of dye from choroid through RPE); later, dye accumulates beneath neurosensory detachment; ’smokestack’ appearance in 10%; expanding dot of hyperfluorescence in 80%, diffuse leakage in the rest (Figure 11-43)
Age-Related Macular Degeneration (ARMD, AMD)
Forms
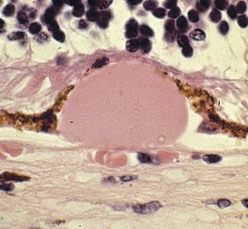
Figure 11-44 Nodular ‘hard’ drusen.
(From Edwards MG, Bressler NM, Raja SC: Age-related macular degeneration. In: Yanoff M, Duker JS (eds) Ophthalmology. London, Mosby, 1999.)
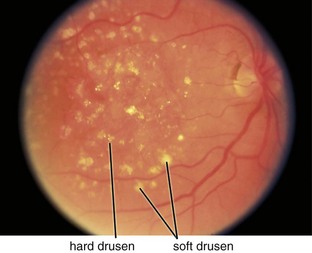
Figure 11-45 Dry, age-related macular degeneration demonstrating drusen and pigmentary changes (category 3).
(From Kaiser PK, Friedman NJ, Pineda R II: Massachusetts Eye and Ear Infirmary Illustrated Manual of Ophthalmology, 2nd edn. Philadelphia, Saunders, 2004.)
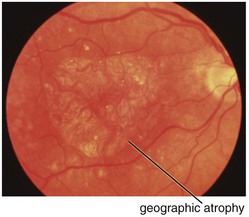
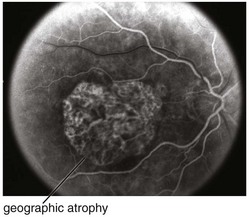
Figure 11-47 Fluorescein angiogram of same patient as in Figure 11-46, demonstrating well-defined window defect corresponding to the area of geographic atrophy.
(From Kaiser PK, Friedman NJ, Pineda R II: Massachusetts Eye and Ear Infirmary Illustrated Manual of Ophthalmology, 2nd edn. Philadelphia, Saunders, 2004.)
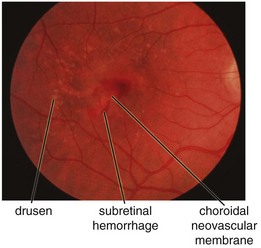
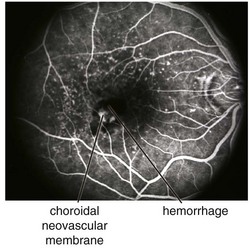
Figure 11-49 Fluorescein angiogram of same patient as in Figure 11-48, demonstrating leakage from the CNV and blockage from the surrounding subretinal blood.
(From Kaiser PK, Friedman NJ, Pineda R II: Massachusetts Eye and Ear Infirmary Illustrated Manual of Ophthalmology, 2nd edn. Philadelphia, Saunders, 2004.)
Types of drusen
Drusen size classification
 that of the average disc) – this corresponds to approximately 15 small drusen from stereo photographs or 5–10 small drusen
 of a disc area (approximately 65, 100 µm diameter drusen)
Signs of CNV
subretinal blood, fluid, and / or lipid; RPE detachment (PED); gray-green subretinal discoloration
Types of CNV
historically defined by appearance of leakage on FA
Location of CNV
Treatment
Prognosis
Major Age-Related Macular Degeneration Clinical Studies
Macular Photocoagulation Study (MPS)
Objective: to evaluate efficacy of laser photocoagulation in preventing visual loss from CNV
Results
Verteporfin in Photodynamic Therapy (VIP) Trial Verteporfin in Photodynamic Therapy–Pathologic Myopia (VIP-PM) Trial
Age-Related Eye Disease Study (AREDS)
Results: 4757 patients enrolled
VEGF Inhibition Study in Ocular Neovascularization trial (VISION)
Objective: to evaluate intravitreal pegaptanib for subfoveal CNV due to neovascular AMD
Conclusions: pegaptanib was better than sham and PDT for neovascular AMD
Minimally Classic / Occult Trial of the Anti-VEGF Antibody Ranibizumab in the Treatment of Neovascular AMD (MARINA) Trial
Other Disorders Associated with Choroidal Neovascular Membrane (CNV)
Presumed Ocular Histoplasmosis Syndrome (POHS)
Macular involvement associated with HLA-B7, HLA-DRw2; however, HLA typing is not commonly used
Findings
POHS consists of the triad of peripapillary atrophy, multiple punched-out chorioretinal scars (‘histo spots,’ may enlarge, 5–10% develop new spots), and maculopathy. No anterior or posterior segment cell; CNV can occur (different from that in AMD in that vessels penetrate Bruch’s membrane and extend over RPE; a second layer of RPE forms [basal side up] and attempts to encircle the CNV) (Figure 11-51)
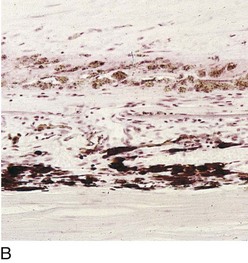
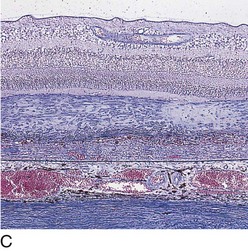
Angioid Streaks
Peripapillary linear cracks in thickened, degenerated, and calcified Bruch’s membrane (Figure 11-52)
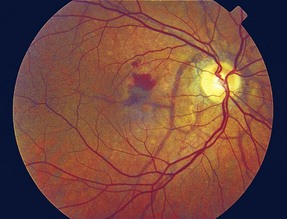
Figure 11-52 Peripapillary angioid streaks.
(From Vander JF: Angioid streaks. In: Yanoff M, Duker JS (eds) Ophthalmology. London, Mosby, 1999.)
Subretinal hemorrhage can occur with minor trauma; patients should consider safety glasses
Etiology
50% associated with systemic condition, 50% idiopathic
Pathologic Myopia
High myopia = Axial length >26 mm; > −6 D of myopia;
Pathologic myopia = Axial length >32.5 mm; > −8 D of myopia;
Approximately 2% of US population; female > male
CNV due to PM commonly occurs in young patients; bilateral common (12–40%)
Vascular Diseases
Retinal Vasculitis
Involvement of retinal arterioles (arteritis), veins (phlebitis), or both (periphlebitis)
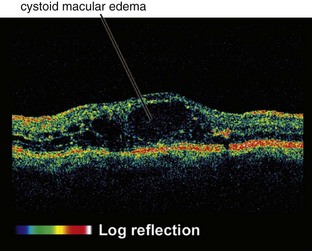
Cystoid Macular Edema (CME)
Intraretinal edema in honeycomb-like spaces; flower-petal pattern due to Henle’s layer
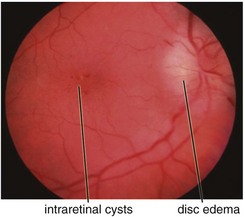
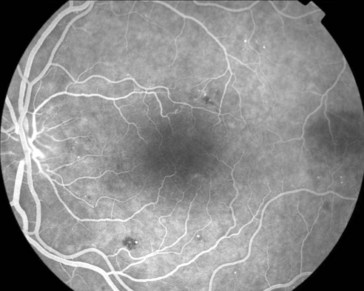
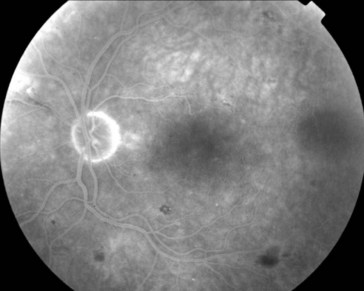
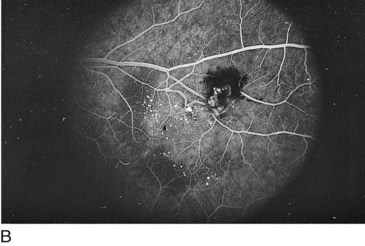
FA
multiple small focal fluorescein leaks early; late pooling of dye in cystoid spaces; classically, flower-petal (‘petalloid’) pattern; staining of optic nerve (Figure 11-54)
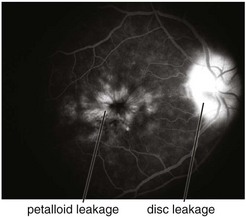
Figure 11-54 Fluorescein angiogram of same patient as in Figure 11-53, demonstrating characteristic petalloid appearance with optic nerve leakage.
(From Kaiser PK, Friedman NJ, Pineda R II: Massachusetts Eye and Ear Infirmary Illustrated Manual of Ophthalmology, 2nd edn. Philadelphia, Saunders, 2004.)
OCT
Parafoveal / Juxtafoveal Telangiectasia (PFT, JXT)
Microaneurysmal and saccular dilation of parafoveal vessels
Classification
 DD centered on FAZ (pseudovitelliform macular degeneration); may develop macular edema that is due to ischemia (not amenable to laser treatment);
  abnormal glucose tolerance test
Retinal Arterial Macroaneurysm (RAM)
Usually, elderly females; most common along temporal arcades; 10% bilateral
Findings
blood in every retinal layer, lipid exudate, artery occlusion downstream (especially following laser treatment), CME (Figure 11-56)
Hypertensive Retinopathy
Associated with microaneurysms or macroaneurysms
Findings
Diabetic Retinopathy (DR)
Leading cause of new blindness in United States, adults aged 20–74 years
Classification
 to
to  disc area
 disc area with vitreous hemorrhage
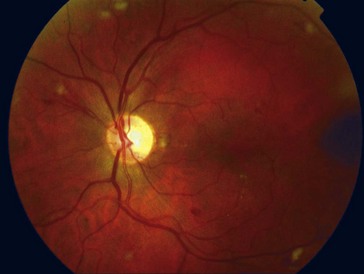
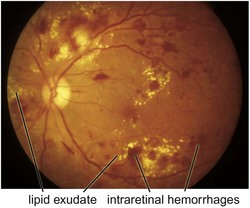
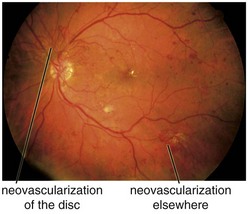
Findings
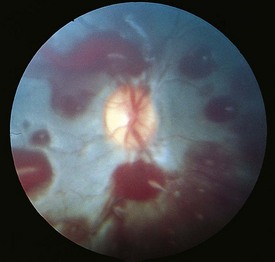
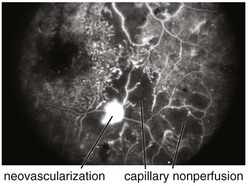
cotton wool spots, lipid exudates (may appear as circinate exudate [ring of hard exudate surrounding leaky focus] or macular star [pattern reflects radial orientation of Henle’s fibers]), hemorrhages (blot [outer plexiform layer], flame [tracks along NFL]), microaneurysms, IRMA (intraretinal microvascular abnormalities; shunts [arteriole to venule]), venous beading and loops, neovascularization (disc [NVD], elsewhere in retina [NVE], iris [NVI]) (Figure 11-60)
Clinically significant macular edema (CSME) definition
Asymmetric diabetic retinopathy is usually due to carotid disease (on either side)
Main causes of vision loss in PDR
tractional RD (TRD), neovascular glaucoma (NVG), vitreous hemorrhage (VH)
Other sequelae
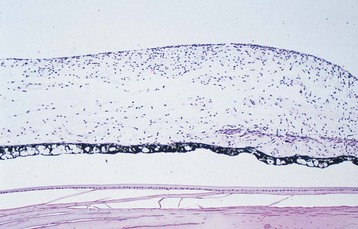
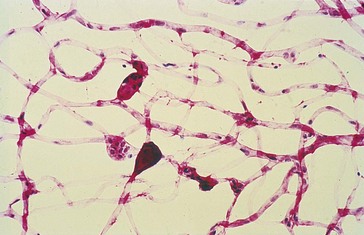
Pathology
selective loss of pericytes, no endothelial cells or pericytes in nonperfused areas; thickening of retinal capillary basement membranes; microaneurysm formation; retinal capillary closure; breakdown of blood–retinal barrier; lacy vacuolization of iris pigment epithelium; intraepithelial vacuoles contain glycogen; gitter cells (lipid-laden macrophages) (Figures 11-61, 11-62)
Treatment
Based on results from several important studies:
 to
to  disc area
 disc area with vitreous hemorrhage
Prognosis
risk of progression without treatment from preproliferative to proliferative DR over 2 years is 50%
Severe NPDR has 50% risk of progression to proliferative disease in 12–18 months
Follow HbA1c (serum glycosylated hemoglobin [provides 3-month view of blood sugar levels])
Major Diabetic Retinopathy Clinical Studies
Diabetic Retinopathy Study (DRS)
Results: 1727 patients enrolled
NVD (new vessels on or within 1 disc diameter of the disc) ≥ of disc area (standard photo 10A)
Any NVD with vitreous or preretinal hemorrhage
NVE (new vessels elsewhere) ≥ of disc area (standard photo 7) with vitreous or preretinal hemorrhage
Early Treatment Diabetic Retinopathy Study (ETDRS)
Patients were excluded if they had high-risk proliferative diabetic retinopathy
Results: 3711 patients enrolled
Conclusions: treat all patients with CSME regardless of vision
Diabetic Retinopathy Vitrectomy Study (DRVS)
Diabetes Control and Complications Trial (DCCT)
Epidemiology of Diabetes Interventions and Complications (EDIC) Trial
Objective: to gain further follow-up of patients from the DCCT