[level-membership-for-radiology-category]Chapter 1
Physics
Principles, Practice and Artefacts
A number of techniques have been developed which exploit the shift in frequency of ultrasound when it is reflected from moving blood. This frequency shift is known as the ‘Doppler effect’.1 Five types of diagnostic Doppler instrument are usually distinguished:
1. Continuous wave (CW) Doppler
4. Colour Doppler imaging (CDI; colour velocity imaging, colour flow imaging)
The characteristics of an ultrasound beam, the propagation of ultrasound in tissue and the design of transducers as found in B-mode imaging are all relevant for Doppler techniques.2–6
The Doppler Effect and Its Application
For all waves such as sound or light the Doppler effect is a change in the observed frequency of the wave because of motion of the source or observer. This is due either to the source stretching or compressing the wave or the observer meeting the wave more quickly or slowly as a result of their motion. In basic medical usage of the Doppler effect, the source and observer (receiver) are a transmitting and a receiving element usually positioned next to each other in a hand-held transducer (Fig. 1-1A). A continuous cyclic electrical signal is applied to the transmitting element and therefore a corresponding CW ultrasound beam is generated. When the ultrasound is scattered or reflected at a moving structure within the body, it experiences a Doppler shift in its frequency and returns to the receiving (detecting) element. Reflected ultrasound is also detected from static surfaces within the body but it has not suffered a Doppler shift in frequency. After the reflected ultrasound is received, the Doppler instrument separates the signals from static and moving structures by exploiting their different frequency.
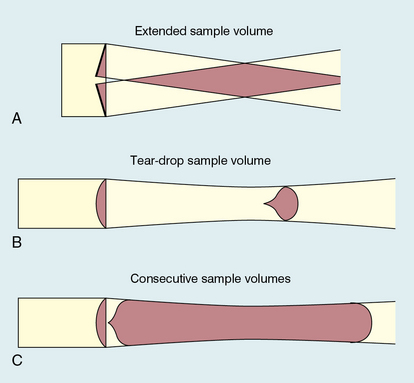
FIGURE 1-1 Sample volumes in Doppler techniques. (A) For dual crystal continuous wave Doppler unit. (B) For pulsed wave Doppler unit. (C) Neighbouring sample volumes along a beam for imaging Doppler units.
where ft is the transmitted frequency, fr is the received frequency, c is the speed of ultrasound and u.cosθ (i.e. u × cosineθ) is the component of the velocity of the reflecting agent along the ultrasonic beam direction. For a typical case of blood flow in a superficial vessel:
Transmitted frequency, ft = 5 MHz = 5 × 10⁶ Hz
Velocity of sound in soft tissue, c = 1540 m/s
Velocity of blood movement, u = 30 cm/s
Angle between ultrasonic beam and direction of flow, θ = 45°
The Doppler shift is therefore:
The shift in frequency is small and within the audible range. In an ultrasonic Doppler instrument, the electronics are designed to extract the difference in frequency, fD = ft – fr (the Doppler shift frequency). The instrument can therefore feed a signal of frequency fD to some output device such as a loudspeaker or frequency analyser.
In the PW Doppler technique, the electrical excitation signal is applied to the transmitter element at regular intervals as pulses, each containing typically 10 cycles, and therefore a corresponding train of pulses of ultrasound are transmitted, separated by non-transmission intervals of duration around 20 times that of each pulse. Regularly spaced echoes are then received back from a reflector and they can be regarded as samples of the signal which would be received if a continuous wave had been transmitted. If the reflector is moving the system electronics can extract a Doppler shift signal from the samples. The Doppler equation again applies to this Doppler shift and can be used to calculate the speed of the reflector.7
Continuous and Pulsed Wave Doppler Instruments
The transmitted ultrasound field and the zone of maximum receiving sensitivity overlap for a particular range in front of the transducer (Fig. 1-1A). Any moving structure within this region of overlap will contribute a component frequency to the total Doppler signal. The shape of the region of overlap (the beam shape) can be considered as having a crude focus which depends on the field and zone shapes and on their angle of orientation to each other. In practice, the beam shapes are rarely well known for CW Doppler transducers. A 5 MHz blood flow instrument might be focused at a distance of 2 or 3 cm from the transducer and a 10 MHz device at a distance of 0.5–1 cm. CW Doppler instruments normally have ultrasonic output intensities (Ispta) of less than 10 mW cm−2 although they may be significantly higher when used in conjunction with duplex systems to measure high velocities.
Since the ultrasound is pulsed and the excitation time is short, a stand-alone PW unit uses a single crystal transducer for transmission and reception (Fig. 1-1B). On setting the electronic gate to select a signal from a specific range, reflectors within a volume, known as the sample volume, contribute to the signal. The shape and size of the sample volume are determined by a number of factors: the transmitted pulse length, the beam width, the gated range length, and the characteristics of the electronics and transducer. The sample volume is often described as a tear drop in shape (Fig. 1-1B). Sample volume lengths are usually altered by changing the gated range length. In a blood flow unit for superficial vessels, the sample volume length may be as short as 1 mm, whereas in a transcranial device it can be 1 or 2 cm; however, the precise lengths are rarely known.
A summary of technical factors relating to the use of continuous wave and pulsed wave Doppler instruments is given in Box 1-1.
Imaging and Doppler
There are three types of imaging used with Doppler techniques. The first, known as ‘duplex Doppler’, uses a real-time B-scanner to locate the site at which blood flow is to be examined then a Doppler beam interrogates that site. The second type creates an image from Doppler information, i.e. an image of velocities in regions of blood flow.8 Known as ‘colour Doppler’, ‘colour flow imaging’ or ‘colour velocity imaging’, it is normally combined with a conventional real-time B-scan so that both tissue structure and areas of flow are displayed. The third type of Doppler imaging is similar to colour Doppler, but generates an image of the power of the Doppler signal from pixel locations throughout the field of view and is known as ‘power Doppler imaging’ (power Doppler).9 A power Doppler image depicts the amount of blood moving in each region, i.e. an image of the detected blood pool.
DUPLEX INSTRUMENTS
Duplex systems link CW or PW Doppler features and real-time B-scanners so that the Doppler beam can interrogate specific locations in the B-scan image (Fig. 1-2). CW duplex is normally only used where very high velocities have to be measured without the aliasing artefact, for example in the estimation of the velocity of a jet through stenosed heart valves. The direction of the CW beam is shown as a line across the B-scan image. In the case of PW Doppler, markers on the beam line show the position of the sample volume. The Doppler beam is often directed across the field of view so that it does not intersect the blood flow at 90°.
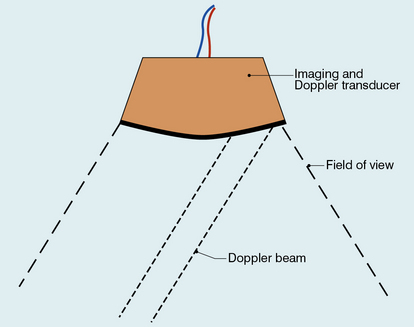
FIGURE 1-2 Duplex system combining real-time B-mode (- – – – ) and a Doppler beam (—-) of variable position across the B-mode field of view.
A summary of technical factors relating the use of duplex Doppler instruments is given in Box 1-2.
COLOUR DOPPLER IMAGING
Pulsed Doppler techniques require between 50 and 100 ultrasonic pulses to be transmitted in each beam direction for the determination of velocities of blood in a sample volume. It is therefore not possible to move the beam rapidly through the scan plane to build up real-time Doppler images of velocity of flow. Such imaging became possible when signal processing was developed which could quickly produce a measure of mean blood velocity at each sample volume from a small number of ultrasonic echo pulses. A technique called ‘autocorrelation processing’ of the signals from blood quickly gives the mean velocity in each small sample volume along the beam (Fig. 1-1C). This real-time colour Doppler imaging processes between 2 and 16 echo signals from each sample volume. In addition, the direction of flow is obtained by examining the signals for the direction of the shift as for CW and PW Doppler devices. Each image pixel is then colour-coded for direction in relation to the transducer and mean Doppler shift (Fig. 1-3A).
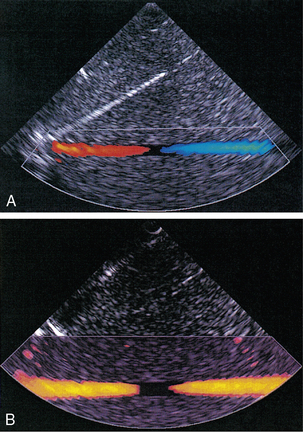
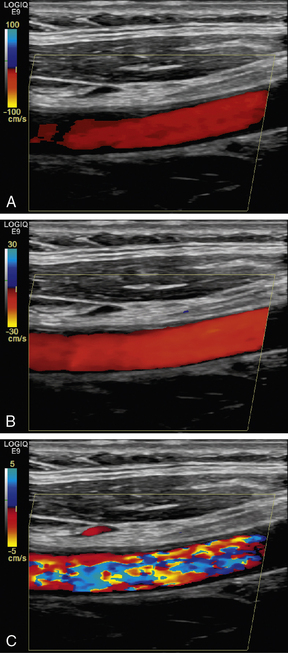
FIGURE 1-3 (A) Colour flow image of flow from left to right in a straight tube. When the flow velocity component is along the beam towards the transducer it is colour-coded red, when the component along the beam is away from the transducer it is coded blue. (B) Power Doppler image of flow in a straight tube. Direction of flow is not measured so it is not colour-coded.
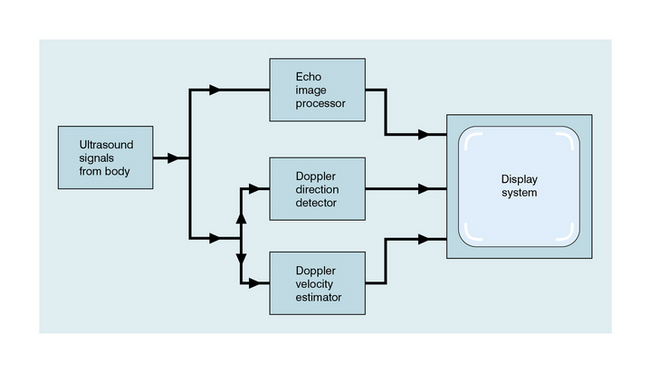
B-scanning and Doppler imaging are carried out with the common types of real-time transducer. Echo signals from the blood and tissues are processed along two signal paths in the system electronics (Fig. 1-4). Going along one path, the signals produce the real-time B-scan image; going along the other path, autocorrelation function processing and direction flow sensing are employed to give a colour flow image. An important exclusion circuit in the autocorrelation path separates large-amplitude signals which arise from tissue and excludes them from the blood velocity processing. The B-mode and mean velocity images are then superimposed in the final display. Strictly speaking, the flow image is of the mean Doppler shift frequency and not the mean velocity, since the beam–vessel angles throughout the field of view are not measured. Colour shades in the image can indicate the magnitude of the velocity, for example light red for high velocity and dark red for low velocity. Turbulence, related to the range of velocities in each sample volume, may be presented as a different colour or as a mosaic of colours.
A summary of technical factors relating to the use of colour Doppler imaging is given in Box 1-3.
POWER DOPPLER IMAGING
The power of the Doppler signal from each small sample volume in the field of view may be displayed rather than the mean frequency shift (Fig. 1-3B). The power of the signal from each point relates to the number of moving blood cells in that sample volume. The power Doppler image may be considered to be an image of the blood pool. The power mode does not measure velocity or direction and therefore the image shows little angle dependence, nor does it suffer from aliasing; however, it obviously presents less information about blood flow. The attraction of power Doppler images is that they suffer less from noise than velocity images, as the power of the background noise for any sample volume with no blood flow signal is less than the power of the background noise plus Doppler signal when blood flow is present. The background noise may be used to set a threshold above which signals are accepted for Doppler flow. Noise from sample volume regions lacking blood flow is therefore reduced in the power image by a threshold detector. However, when the same signal is used in the velocity imaging mode, the noise will produce a mean velocity value which the machine will treat as a genuine blood velocity and which will therefore appear in the image. The power Doppler mode is therefore less prone to noise and hence more sensitive and can be used to detect small vessels. Further sensitivity can be obtained by averaging power images over several frames to reduce spuriously distributed noise even more. In velocity imaging there is interest in showing quick changes in blood flow and hence less averaging is used.
A summary of technical factors relating to the use of power Doppler imaging is given in Box 1-4.
Ultrasonic Microbubble Contrast Agents
A number of agents have been considered which can enhance the scattering of ultrasound from blood and hence could be employed as echo-enhancing or contrast agents. Ophir and Parker10 have reviewed contrast agents. From this review and more recent experience it has become obvious that agents in the form of encapsulated microbubbles are by far the most likely to be successful echo-enhancing agents in the immediate future. This is due to the large difference in acoustic impedance between the gas in the bubbles and the surrounding blood. In addition, bubbles of a few microns in diameter have a fundamental resonance frequency of a few megahertz. For example, 4 μm diameter bubbles resonate at 4 MHz, which is well within the range of medical ultrasound systems. Bubbles of these dimensions are important since, even with only very thin wall encapsulation, they are able to pass through the capillaries of the lung into the systemic circulation. An investigation by a committee of the American Society of Echocardiography concluded that contrast echocardiography carried a minimal risk for patients and that there were few residual or complicating side-effects.11 Other studies have confirmed these conclusions; however, more work is required on new agents as they become available.12
The development around 1990 of contrast agent microbubbles that can be used by percutaneous venous injection was the breakthrough which gave rise to the current high level of activity in this field. Table 1-1 gives examples of agents which are currently under commercial development. Large gas molecules are encapsulated in some agents to reduce the rate of diffusion and so increase the lifetime of the bubbles. Typically the lifetime in blood ranges from 2–3 min up to 20–30 min. An attraction of contrast agents is the ability to increase the signal obtained from small blood vessels which are difficult to detect by conventional Doppler methods, such as cerebral or renal vessels. There is also interest in perfusion studies, for example to observe and measure the wash-in and wash-out of agent in the myocardium in a manner analogous to nuclear medicine studies.
TABLE 1-1
Properties of Some Commercially Available Ultrasound Contrast Agents
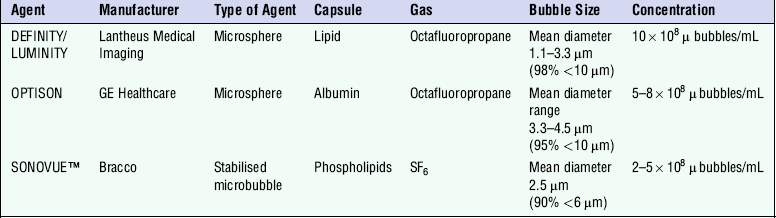
By courtesy of CM Moran, University of Edinburgh.
Enhanced scattering is obtained if a bubble is insonated with ultrasound of a frequency equal to that of the fundamental resonance frequency of the bubble. At low power (that is low ultrasonic wave pressure amplitudes) the oscillations of the bubble are about its centre and are directly in proportion to the size of the pressure fluctuations in the ultrasound wave. However, at higher powers the oscillations become distorted and ultrasound at frequencies different from that of the incident wave is generated by the bubbles. These frequencies are known as harmonics and are simply related to the fundamental resonance frequency of the bubble, so that the second harmonic frequency is twice the fundamental frequency. There is considerable interest in detecting and using the second harmonic, since tissue does not produce this effect to any great extent and the second harmonic signal comes predominantly from the echo-enhancing agent in the blood vessels. Both pulse–echo and Doppler systems have been designed to pick out the second harmonic component in the ultrasound returned to the transducer and use it to enhance the signal from the agent in blood, possibly by as much as 20–30 dB. These systems are being evaluated in clinical practice.13
The scattering from contrast agents can also be enhanced if the acoustic pressure fluctuations in the beam are large enough to damage the microbubbles, causing them to leak. An unencapsulated gas bubble then forms next to the original one; however, since it has no outer shell, the scattering from it is undamped and can be around 1000 times higher than that from the encapsulated bubble. This effect has been exploited in a technique known as ‘intermittent’ or ‘transient’ imaging, which allows time for the damaged bubbles to be replaced between sweeps of the ultrasound beam.14
A summary of technical factors relating to the use of microbubble contrast agents is given in Box 1-5.
Information from Doppler Signals
THE SPECTRUM ANALYSER
A Doppler signal may be analysed into its frequency components in order to give a display of the velocities of the blood cells at each instant (Fig. 1-5).2 Short time intervals of the Doppler signal are analysed, for example a segment of 5 ms duration. This produces an instantaneous spectrum of the frequencies in the sample volume for that time period. If an angle correction is then applied, this spectrum will represent the range of velocities in the sample volume. The frequencies in each spectrum are displayed along a vertical line on which the power of each frequency component is presented as a shade of grey. The consecutive velocity spectra are then displayed as side-by-side grey-shade vertical lines. In this way a spectral display, or spectrogram, is built up (Fig. 1-6). Note the difference between the instantaneous velocity spectrum which tells us about the pattern of velocities in the sample volume at that instant and the spectral display, or spectrogram, which shows how the velocity pattern varies with time. Spectrograms are generated in real time during the clinical examination and it is usually possible to store a few seconds of the trace in an analyser for subsequent review.
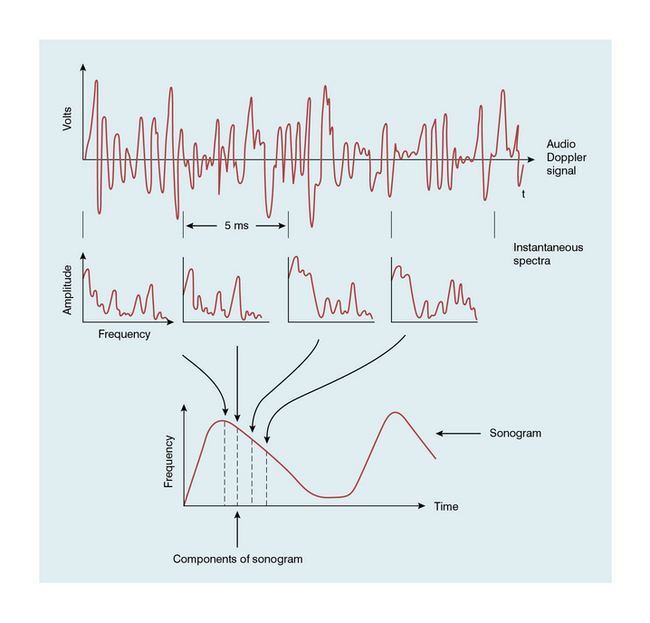
FIGURE 1-5 Schematic representation of the analysis of a Doppler signal to form a sonogram (spectrogram). (From McDicken2, Copyright Elsevier 1991)
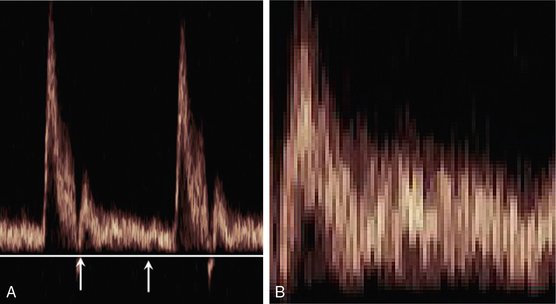
FIGURE 1-6 A normal sonogram (A); (B) a magnified view of the segment between the arrows illustrating the pixel structure and speckle pattern.
A summary of technical factors relating to spectral analysis is given in Box 1-6.
Spectrograms (Sonograms) and Indices
WAVEFORM INDICES
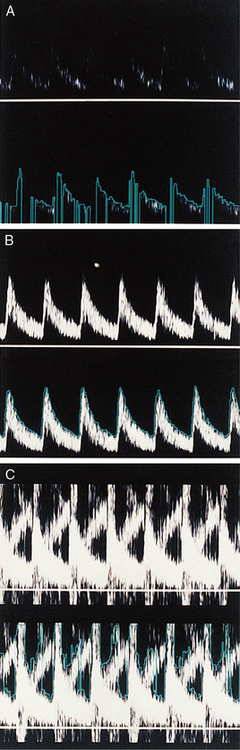
Waveform indices are derived from a combination of a few dominant features of the waveform.3 Indices that have the same or similar names in the literature are occasionally defined differently, so a first step is to check the definition of any index to be used. In practice only two classes of index are used to any great extent, those related to the degree of diastolic flow and others related to spectral broadening. The variation in time of the maximum velocity displayed in a spectrogram is commonly used as a source of data for the derivation of an index (Fig. 1-7). Since the maximum velocity is not always clearly apparent in a spectrogram, some analysers produce a trace which is closely related to the maximum velocity trace. One example is a trace showing the upper velocity boundary below which the velocity components contain seven-eighths of the power of the Doppler signal.
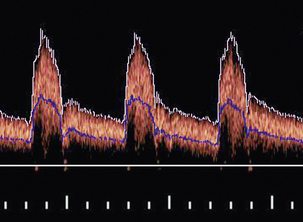
FIGURE 1-7 A spectral waveform showing maximum velocity trace (white) and mean velocity trace (blue).
The mean velocity waveform (average velocity waveform) is also employed (Fig. 1-7). To calculate the mean velocity at each instant, the values of velocity and the intensities of the signal for each velocity component in the instantaneous spectrum are used. The mean velocity is used together with the vessel cross-sectional area to calculate blood flow rate. However, it is difficult to measure mean velocity accurately and there are several other problems associated with calculating flow rates; these are discussed further in Chapter 2.
A number of the most commonly encountered indices are briefly discussed below:
A/B Ratio
The A/B ratio is defined as the ratio of two specified velocities, e.g. maximum velocities, at two points in the cardiac cycle (Fig. 1-8). It is usually employed where there is no reverse flow in the waveform.
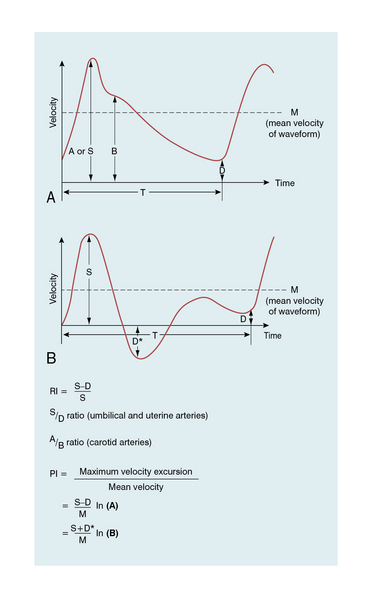
Resistance Index (RI)

High resistance in the distal vessels produces low diastolic flow in the supplying artery and results in a high value for this index; a low resistance results in a low value as there is higher diastolic flow. It is also known as the Pourcelot index.
Pulsatility Index (PI)
The pulsatility index (PI) is defined as:
This ratio is used in vessels where reverse flow may occur, for example in the lower limbs (Fig. 1-8). The PI may typically have a value of 10 for the normal common femoral artery but be around 2 when proximal disease severely dampens the waveform.
Damping Factor

The numerical value of this index increases as disease becomes more severe, a value of 2 being typical of a high degree of damping. This index is mentioned for completeness, it is not widely used.
Spectral Broadening

Conclusions with regard to the presence of turbulence should be made with caution and only after familiarity has been gained with the patterns for laminar and plug flow for the particular instrument being used. Other technical factors can cause spectral broadening: for example ‘geometrical spectral broadening’, which results from the range of Doppler angles which any given blood corpuscle subtends to different points on the face of the transducer.
Artefacts in Doppler Techniques
The most important artefacts are mentioned here and methods of dealing with them are suggested. Further details can be found in other texts.2,5 Artefacts are usually dealt with by explaining their origin or by recognising that they occur fairly frequently and are not of significance.
OVERESTIMATION OF MAXIMUM VELOCITY
The maximum blood velocity is often of clinical interest since it is of physiological significance and often easy to identify on a spectrogram. However large errors can occur in its measurement if steps are not taken to avoid them. If maximum velocity is measured in the laboratory using a string phantom, which simulates a line of blood cells passing through a sample volume, it is found that the velocity is overestimated (Fig. 1-9A) and the error increases markedly as the angle approaches 90°. As an active array segment has a finite length, typically 20–40% of the full array, so different elements will register different beam–vessel angles and therefore Doppler shifts, as shown in Fig. 1-9B; the elements with the higher angles will also be more affected by the angle error shown in Fig. 1-9A. The highest Doppler shift and hence the highest measured velocity will be registered by the elements with the smallest beam–vessel angles. Strictly speaking a correction should be applied to allow for the fact that the maximum velocity is not measured by ultrasound travelling along the central axis of the beam, as assumed in the basic Doppler equation, but manufacturers have not adopted this approach. The errors in maximum velocity estimation shown in Fig. 1-9 are typical of modern linear arrays. The errors for phased arrays, which are used in cardiology, are smaller due to their smaller Doppler apertures. In clinical practice with linear arrays, errors are reduced by the use of small angles (typically 45–60°) and by the use of indices employing velocity ratios as described in Fig. 1-8.15,16
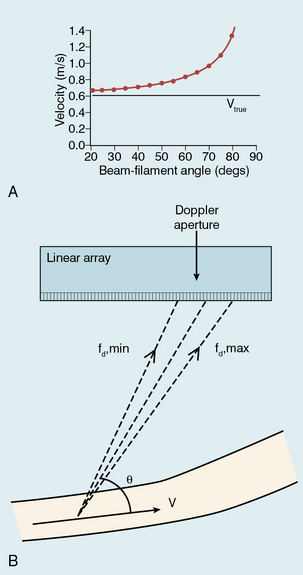
FIGURE 1-9 Overestimation of maximum velocity: (A) Velocity errors measured using a string phantom. The true string velocity is 0.61 m/s but the velocity measured using Doppler ultrasound is overestimated, with the degree of overestimation increasing as the beam-filament angle approaches 90°. (B) Geometrical spectral broadening due to the finite size of the active area of an array. Higher Doppler shifts are received at one end of the Doppler aperture, smaller shifts at the other end. The Doppler system will usually perform angle correction with respect to the centre of the aperture.
SPECKLE AND THE SPECTRAL DISPLAY
The speckled appearance of a sonogram results from fluctuations in the power levels of the velocity components in neighbouring pixels (Fig. 1-6). These fluctuations are due to variations in the ultrasonic signal received from the random distribution of blood cells. Due to this speckle noise, the power level in a pixel cannot be directly related to the number of cells moving with a particular velocity. Averaging the power levels in neighbouring pixels gives a more accurate measure of the number of cells moving with each velocity.
FILTERING
Filters are used to reduce low frequencies, such as those obtained from arterial walls. Filters also remove information on slow-moving blood but this is not usually a serious problem unless it is desired to measure mean velocity accurately or slow flow specifically (Fig. 1-10).
HARMONIC GENERATION BY LARGE SIGNAL DISTORTION
The harmonics of a frequency are higher multiples of that frequency; for example, harmonics of 100 Hz are 200 Hz, 300 Hz, etc. If a signal is too large to be handled by the electronics it becomes distorted and then contains additional harmonic frequency components. When such a distorted signal is analysed, the harmonics appear at regular frequency intervals in the spectral display. Strong blood flow signals exhibit harmonic components as a higher frequency part of the sonogram above that which would probably be obtained if the gain were reduced (Fig. 1-11).
HIGH OR LOW SENSITIVITY
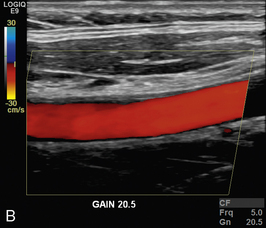
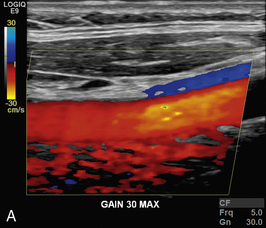
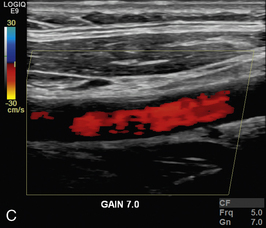
In colour Doppler and power Doppler imaging, setting up the system with too low a sensitivity causes blood flow signal to be lost. Too high a sensitivity causes spurious echoes to be colour-coded as blood (Fig. 1-12).
ALIASING
Pulsed Doppler and colour Doppler units have to reconstruct the Doppler shift signal from regularly timed samples of information, rather than the complete signal as used in CW units. The sampling rate is equal to the PRF (pulse repetition frequency) of the Doppler unit. If the sampling rate is too low, less than half the Doppler shift frequency, then the frequency of the reconstructed Doppler signal is in error and the direction of flow is presented wrongly. In a spectral display or flow image, this is known as an ‘aliasing’ artefact (Figs 1-13 and 1-14).
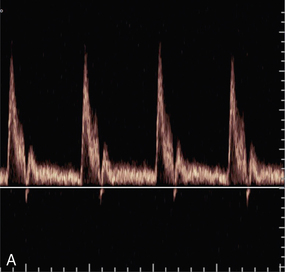
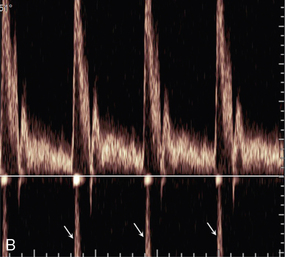
FIGURE 1-13 Aliasing in a sonogram. (A) Satisfactory PRF and spectral display. (B) PRF is too low and the highest velocity signals appear in the reverse channel (arrows).
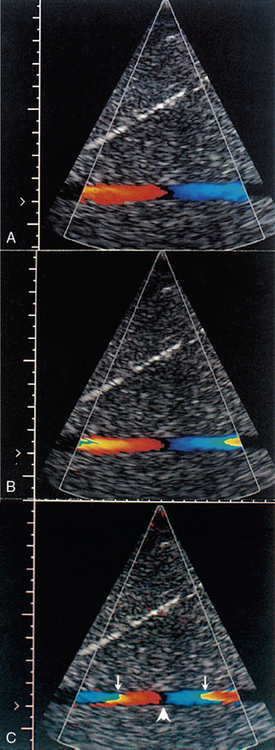
FIGURE 1-14 Increase in aliasing in a colour Doppler velocity image. Note that there is no black space between the red and blue pixels in the lateral colour displays (arrows), indicating that the pixel colour-coding has gone off the top of the red colours and wrapped round to the blue colours. However, there is a black space between the colour displays centrally (arrowhead), indicating reversal of flow direction in relation to the transducer.
EFFECT OF BEAM ANGLE TO FLOW DIRECTION
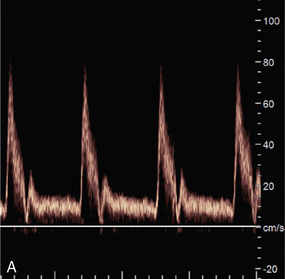
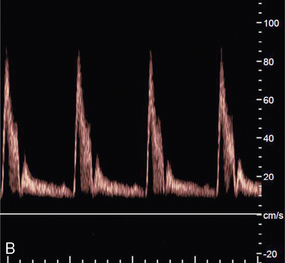
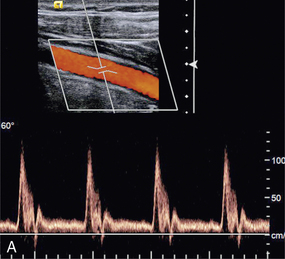
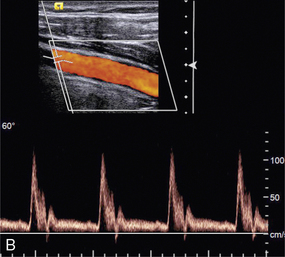
The quality of a Doppler signal depends on beam–vessel angle and above 70° it degrades quite rapidly (Fig. 1-15). If the direction of an ultrasound beam is at 90° to the direction of the flowing blood, no Doppler signal is expected since, in the Doppler equation, cos90° = 0. However, a poor-quality Doppler signal is usually obtained for two reasons. First, the ultrasound beam may converge or diverge slightly from the beam axis, so all of it is never at 90° to the flow. Second, there may be some turbulence in the flow, in which case the blood cells are not all travelling in parallel paths at 90° to the beam.
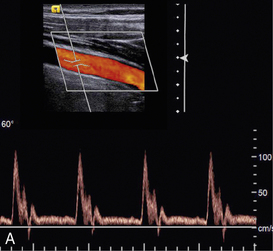
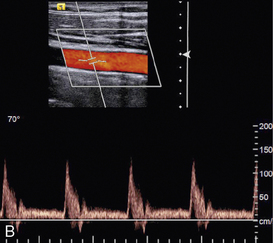
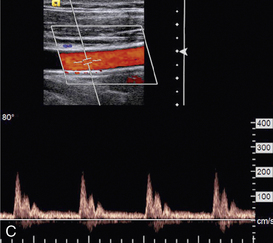
FIGURE 1-15 Variation of quality of signal with beam–vessel angle: (A) at 60°; (B) at 70°; (C) at 80°.
Colour Doppler images obtained at 90° to the direction of flow appear dark or noisy, corresponding to anabsent or small Doppler shift (Fig. 1-3). Power Doppler images are relatively insensitive to angle, except near 90°, where the low Doppler frequencies may fall below the clutter filter and no power signal is displayed (Fig. 1-3).
In a vessel in which the direction of flow alters with respect to the ultrasound beam, different regions of the vessel will be colour-coded differently. Note that this may be due to a genuine change in flow direction as seen in the normal carotid bulb, or merely due to the changing beam angle (see Fig. 4-7) which is particularly common in sector scan imaging.
EFFECT OF VELOCITY SCALE
The choice of velocity scale can dramatically change the appearance of a colour Doppler image (Fig. 1-16). The scale should be chosen to accommodate the range of velocities thought to be present. Too low a scale will cause aliasing and too high a scale results in the flow being depicted as a few dark colours in colour Doppler imaging.
UNEXPECTED MACHINE ARTEFACTS
Doppler technology is developing rapidly and can still have gremlins in it. The operator must therefore check the performance and calibration of the instrument. This is most readily done in a situation where the flow pattern is considered to be well understood, such as in a clearly seen normal blood vessel or a flow test-object. Figure 1-17 shows an unexpected artefact in which the maximum velocity measured varies with the beam position in the field of view. This has arisen because the transducer aperture used by the system is a different size in the different positions, resulting in a different amount of spectral broadening.
TWINKLE ARTEFACT
This artefact is seen as an intense, rapidly changing mixture of colour signals behind strongly reflective stationary structures such as renal calculi (see Figs 9-7, 9-8 and 13-24). This artefact is thought to be produced by factors relating to the irregularity of the reflecting media, multiple reflections and tiny random variations in the clock that synchronises pulse transmissions (clock jitter). These factors result in fluctuating returned signals which the electronics present on the display as similar to colour-coded Doppler signals. The effect is highly machine and control setting dependent.17,18
Safety and Prudent Use of Doppler Instruments
There is a considerable amount of literature on bioeffects and safety of diagnostic ultrasound.19 The literature is scrutinised by several national and international bodies who produce statements on safety and the prudent use of ultrasound. Organisations actively monitoring the safety of ultrasound are the World Federation for Ultrasound in Medicine and Biology (WFUMB),20 the European Federation of Societies for Ultrasound in Medicine and Biology (EFSUMB),21 the British Medical Ultrasound Society22 and the American Institute of Ultrasound in Medicine (AIUM). It is still true to say that there are no confirmed harmful effects of diagnostic ultrasound. Often the possibility of an effect is reported but it is not confirmed by further work. There is a need for well-controlled studies but these are increasingly difficult to conduct since unscanned control populations are almost non-existent in the developed world. Although no harmful effects have been confirmed, there is some concern that the outputs of machines have been increasing by factors of as much as 3 or 5 since 1991, as manufacturers seek to produce better B-mode images and more sensitive Doppler units.23 The situation is summed up in a commentary by ter Haar.24
Until the early 1990s, attempts were made to specify the maximum intensities permissible for different clinical applications. This proved to be both limiting and impractical, so the approach now is to use the ALARA principle (As Low As Reasonably Achievable) borrowed from the field of ionising radiations. The user is now informed of the output of the machine and has the responsibility to keep the exposure to a low value which will still give a diagnosis. Many systems now display the output on the screen in terms of a thermal index (TI), related to tissue heating, and a mechanical index (MI), related to the possibility of producing cavitation. These indices are defined in the Output Display Standard (ODS) developed jointly by the AIUM and the National Electrical Manufacturers Association (NEMA) in the USA.25 The Food and Drug Administration (FDA) in the USA requires adherence to this standard and this is followed by many countries throughout the world. MI is also used to provide a measure of output during contrast agent studies and hence helps to describe the technique. When a new technique is to be implemented clinically, attention should be paid to the TI and MI values used by its developers. Transducer heating was a problem with some devices in the past due to inefficient conversion of electrical energy into acoustic energy. It is worth checking that the transducer face is not hot.
A summary of technical factors relating the prudent use and safety of ultrasound is given in Box 1-8.
Future Instrumentation
At an interrogated blood flow site, techniques are being developed to measure velocity components in more than one direction (Fig. 1-18). Beam direction and interrogation sites can be altered very rapidly so that it is possible to interrogate flow sites across the scan plane and measure velocity components in quick succession. From these components the speed and true direction of flow at sites in the scan plane can be calculated, i.e. the velocity vector in the scan plane is obtained for each site. A quantity is called a vector in mathematics when its magnitude (speed in the present case) and direction are known. The velocity vector at each site in a blood vessel is then presented on the display as an arrow whose length is the magnitude of the velocity and whose direction is the direction of flow (Fig. 1-18). High frame rate vector Doppler images are possible because of the speed with which modern electronics can excite transducer elements and computers can process received echoes. High frame rates are very desirable in situations where flow patterns change quickly throughout the cardiac cycle, indeed low frame rates can be very misleading in such situations.
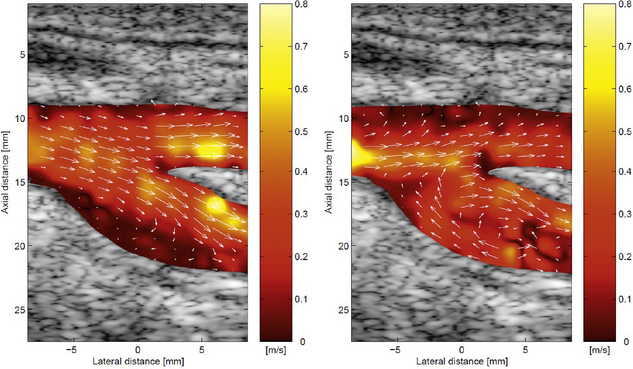
FIGURE 1-18 Vector colour Doppler images of the carotid bifurcation. The arrows show the direction of flow and their length represents the velocity at that point. (By courtesy of J Jensen, DTU Electro, Lyngby, Denmark.)
Advanced prototypes have been produced for both high frame rate colour Doppler flow and vector Doppler in blood vessels and the heart. The signal processing is more complex than that usually encountered in ultrasonic imaging and a number of different approaches have still to be evaluated.26
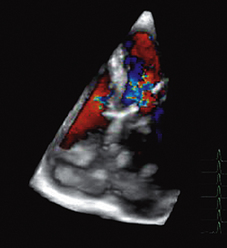
THREE-DIMENSIONAL DOPPLER FLOW IMAGING
Just as 2D colour Doppler flow imaging can be performed by scanning an ultrasound beam through a 2D plane, a 3D colour flow image can be produced by scanning a beam through a 3D volume. At present 3D images are often produced by stacking 2D images next to each other, i.e. a series of parallel scans. These images are proving useful for example in the study of flow through a cardiac valve or complex vascular bed (Fig. 1-19). However true 3D flow imaging would involve measurement of the three velocity components of flow at each sample volume, i.e. at each voxel in the scanned volume. True 3D flow imaging is still at the laboratory development phase and quite far from clinical application.
TISSUE DOPPLER IMAGING
All Doppler instruments can be adapted to study tissue motion rather than blood flow. The echo signals from tissue are larger than from blood and the velocities do not reach the high values encountered in blood flow. Nevertheless the signal processing techniques remain valid for Doppler tissue motion.27,28 Most commonly it is the myocardium that is studied by both PW Doppler and colour Doppler imaging (Fig. 1-20). The velocity information in 2D tissue Doppler images can be further analysed to give images of strain and strain rate in the myocardium.29 Doppler tissue techniques have been incorporated in most cardiac imaging instruments.

CATHETER DOPPLER
High-frequency transducers can be miniaturised to dimensions of less than 1 mm making them suitable for insertion into arteries. PW Doppler catheters operating at 20 to 40 MHz have been commercially available for a number of years. The small transducer crystal is designed to transmit ultrasound along the artery in the direction of the axis of the catheter wire.30 In practice it can be difficult to know exactly how the ultrasound beam is interrogating the blood flow but high-quality low-noise signals may be obtained due to the catheter being immersed in the blood. Experimental systems have been made which combine Doppler imaging and grey shade B-mode imaging.
REFERENCES
1. White, D. N. Johann Christian Doppler and his effect – a brief history. Ultrasound Med Biol. 1982; 8:583–591.
2. McDicken, W. N. Diagnostic Ultrasonics: Principles and Use of Instruments. London: Churchill Livingstone; 1991.
3. Evans, D. H., McDicken, W. N. Doppler Ultrasound: Physics, Instrumentation and Clinical Applications. Chichester: Wiley; 2000.
4. Hoskins, P. R. Measurement of arterial blood flow by Doppler ultrasound. Clin Phys Physiol Measure. 1990; 11:1–26.
5. Taylor, K. J. W., Burns, P. N., Wells, P. N. T. Clinical Applications of Doppler Ultrasound. New York: Raven Press; 1988.
6. Fish, P. Physics and Instrumentation of Diagnostic Medical Ultrasound. Chichester: Wiley; 1990.
7. Wells, P. N. T. A range-gated ultrasonic Doppler system. Med Biol Eng. 1969; 7:641–652.
8. Kasai, C., Namekawa, K., Koyano, A., et al. Real-time two-dimensional blood flow imaging using an autocorrelation technique. Institute of Electrical and Electronics Engineers Trans Sonogr Ultrasonogr. 1985; 32:458–464.
9. Rubin, J. M., Bude, R. O., Carson, P. L., et al. Power Doppler US: a potentially useful alternative to mean-frequency based colour Doppler US. Radiology. 1994; 190:853–856.
10. Ophir, J., Parker, K. J. Contrast agents in diagnostic ultrasound. Ultrasound Med Biol. 1989; 15:319–333.
11. Bommer, W. J., Shah, P., Allen, H., et al. The safety of contrast echocardiography – report of the Committee on Contrast Echocardiography for the American Society of Echocardiography. J Am Coll Cardiol. 1984; 3:6–13.
12. Williams, A. R., Kubowicz, G., Cramer, E., et al. The effects of the microbubble suspension SHU 454 (Echovist) on ultrasound-induced cell lysis in a rotating tube exposure system. Echocardiography. 1991; 8:423–433.
13. Burns, P. N., Powers, J. E., Fritzsch, T. Harmonic imaging; new imaging and Doppler method for contrast-enhanced ultrasound. Radiology. 1992; 182:142.
14. Porter, T. A., Xie, F. Transient myocardial contrast after initial exposure to diagnostic ultrasound pressures with minute doses of intravenously injected microbubbles. Circulation. 1995; 92:2391–2395.
15. Hoskins, P. R. Measurement of blood velocity, volumetric flow and wall shear rate. Ultrasound. 2011; 19:120–129.
16. Oates, C. P., Naylor, A. R., Hartshone, T., et al. Joint recommendations for reporting carotid ultrasound investigations in the United Kingdom. Eur J Vasc Endovasc Surg. 2009; 37:251–261.
17. Kamaya, A., Tuthill, T., Rubin, J. M. Twinkling artefact on color Doppler sonography: dependence on machine parameters and underlying cause. Am J Roentgenol. 2003; 180:215–222.
18. Rahmouni, A., Bargoin, R., Herment, A., et al. Color Doppler twinkling artefact in hyperechoic regions. Radiology. 1996; 199:269–271.
19. Starritt, H., Duck, F. A., Safety. 3rd ed. Clinical Ultrasound; vol. 1. Churchill Livingstone, Edinburgh, 2011. [[chapter 4]].
20. Barnett, S. B., Ter Haar, G. R., Ziskin, M. C., et al. International recommendations and guidelines for the safe use of diagnostic ultrasound in medicine. Ulltrasound Med Biol. 2000; 26:355–366.
21. Piscaglia, F., Nolsøe, C., Dietrich, C. F., et al. The EFSUMB Guidelines and Recommendations on the Clinical Practice of Contrast Enhanced Ultrasound (CEUS): Update 2011 on non-hepatic applications. Ultraschall Med. 2012; 33:33–59.
22. http://www.bmus.org/policies-guides/BMUS-Safety-Guidelines-2009-revision-FINAL-Nov-2009.pdf.
23. Henderson, J., Willson, K., Jago, J. R., et al. A survey of the acoustic outputs of diagnostic ultrasound equipment in current clinical use. Ultrasound Med Biol. 1995; 21:669–705.
24. ter Haar, G. Commentary: safety of diagnostic ultrasound. Br J Radiol. 1996; 69:1083–1085.
25. American Institute of Ultrasound in Medicine/National Electrical Manufacturers AssociationStandard for real-time display of thermal and mechanical acoustic output indices on diagnostic ultrasound equipment. Rockville, MD: Am Institute of Ultrasound in Medicine, 1992.
26. Hansen, K. L., Udesen, J., Oddershede, N., et al. In vivo comparison of three ultrasound vector velocity techniques to MR phase contrast angiography. Ultrasonics. 2009; 49:659–667.
27. Anderson, T., McDicken, W. N. Measurement of tissue motion. Proc Instn Mech Engrs. 1999; 213(Part H):181–191.
28. McDicken, W. N., Sutherland, G. R., Moran, C. M., et al. Colour Doppler velocity imaging of the myocardium. Ultrasound Med Biol. 1992; 18:651–654.
29. Heimdal, A., Stoylen, A., Torp, H., et al. Real-time strain rate imaging of the left ventricle by ultrasound. J Am Soc Echocardiogr. 1998; 11:1013–1019.
30. Doucette, J. W., Corl, P. D., Payne, H. M., et al. Validation of Doppler guide wire for intravascular measurement of coronary artery flow velocity. Circulation. 1992; 85:1899–1911.
[/level-membership-for-radiology-category][not-level-membership-for-radiology-category]Chapter 1
Physics
Principles, Practice and Artefacts
A number of techniques have been developed which exploit the shift in frequency of ultrasound when it is reflected from moving blood. This frequency shift is known as the ‘Doppler effect’.1 Five types of diagnostic Doppler instrument are usually distinguished:
1. Continuous wave (CW) Doppler
4. Colour Doppler imaging (CDI; colour velocity imaging, colour flow imaging)
The characteristics of an ultrasound beam, the propagation of ultrasound in tissue and the design of transducers as found in B-mode imaging are all relevant for Doppler techniques.2–6
The Doppler Effect and Its Application
For all waves such as sound or light the Doppler effect is a change in the observed frequency of the wave because of motion of the source or observer. This is due either to the source stretching or compressing the wave or the observer meeting the wave more quickly or slowly as a result of their motion. In basic medical usage of the Doppler effect, the source and observer (receiver) are a transmitting and a receiving element usually positioned next to each other in a hand-held transducer (Fig. 1-1A). A continuous cyclic electrical signal is applied to the transmitting element and therefore a corresponding CW ultrasound beam is generated. When the ultrasound is scattered or reflected at a moving structure within the body, it experiences a Doppler shift in its frequency and returns to the receiving (detecting) element. Reflected ultrasound is also detected from static surfaces within the body but it has not suffered a Doppler shift in frequency. After the reflected ultrasound is received, the Doppler instrument separates the signals from static and moving structures by exploiting their different frequency.
FIGURE 1-1 Sample volumes in Doppler techniques. (A) For dual crystal continuous wave Doppler unit. (B) For pulsed wave Doppler unit. (C) Neighbouring sample volumes along a beam for imaging Doppler units.
where ft is the transmitted frequency, fr is the received frequency, c is the speed of ultrasound and u.cosθ (i.e. u × cosineθ) is the component of the velocity of the reflecting agent along the ultrasonic beam direction. For a typical case of blood flow in a superficial vessel:
Transmitted frequency, ft = 5 MHz = 5 × 10⁶ Hz
Velocity of sound in soft tissue, c = 1540 m/s
Velocity of blood movement, u = 30 cm/s
Angle between ultrasonic beam and direction of flow, θ = 45°
The Doppler shift is therefore:
The shift in frequency is small and within the audible range. In an ultrasonic Doppler instrument, the electronics are designed to extract the difference in frequency, fD = ft – fr (the Doppler shift frequency). The instrument can therefore feed a signal of frequency fD to some output device such as a loudspeaker or frequency analyser.
In the PW Doppler technique, the electrical excitation signal is applied to the transmitter element at regular intervals as pulses, each containing typically 10 cycles, and therefore a corresponding train of pulses of ultrasound are transmitted, separated by non-transmission intervals of duration around 20 times that of each pulse. Regularly spaced echoes are then received back from a reflector and they can be regarded as samples of the signal which would be received if a continuous wave had been transmitted. If the reflector is moving the system electronics can extract a Doppler shift signal from the samples. The Doppler equation again applies to this Doppler shift and can be used to calculate the speed of the reflector.7
Continuous and Pulsed Wave Doppler Instruments
The transmitted ultrasound field and the zone of maximum receiving sensitivity overlap for a particular range in front of the transducer (Fig. 1-1A). Any moving structure within this region of overlap will contribute a component frequency to the total Doppler signal. The shape of the region of overlap (the beam shape) can be considered as having a crude focus which depends on the field and zone shapes and on their angle of orientation to each other. In practice, the beam shapes are rarely well known for CW Doppler transducers. A 5 MHz blood flow instrument might be focused at a distance of 2 or 3 cm from the transducer and a 10 MHz device at a distance of 0.5–1 cm. CW Doppler instruments normally have ultrasonic output intensities (Ispta) of less than 10 mW cm−2 although they may be significantly higher when used in conjunction with duplex systems to measure high velocities.
Since the ultrasound is pulsed and the excitation time is short, a stand-alone PW unit uses a single crystal transducer for transmission and reception (Fig. 1-1B). On setting the electronic gate to select a signal from a specific range, reflectors within a volume, known as the sample volume, contribute to the signal. The shape and size of the sample volume are determined by a number of factors: the transmitted pulse length, the beam width, the gated range length, and the characteristics of the electronics and transducer. The sample volume is often described as a tear drop in shape (Fig. 1-1B). Sample volume lengths are usually altered by changing the gated range length. In a blood flow unit for superficial vessels, the sample volume length may be as short as 1 mm, whereas in a transcranial device it can be 1 or 2 cm; however, the precise lengths are rarely known.
A summary of technical factors relating to the use of continuous wave and pulsed wave Doppler instruments is given in Box 1-1.
Imaging and Doppler
There are three types of imaging used with Doppler techniques. The first, known as ‘duplex Doppler’, uses a real-time B-scanner to locate the site at which blood flow is to be examined then a Doppler beam interrogates that site. The second type creates an image from Doppler information, i.e. an image of velocities in regions of blood flow.8 Known as ‘colour Doppler’, ‘colour flow imaging’ or ‘colour velocity imaging’, it is normally combined with a conventional real-time B-scan so that both tissue structure and areas of flow are displayed. The third type of Doppler imaging is similar to colour Doppler, but generates an image of the power of the Doppler signal from pixel locations throughout the field of view and is known as ‘power Doppler imaging’ (power Doppler).9 A power Doppler image depicts the amount of blood moving in each region, i.e. an image of the detected blood pool.
DUPLEX INSTRUMENTS
Duplex systems link CW or PW Doppler features and real-time B-scanners so that the Doppler beam can interrogate specific locations in the B-scan image (Fig. 1-2). CW duplex is normally only used where very high velocities have to be measured without the aliasing artefact, for example in the estimation of the velocity of a jet through stenosed heart valves. The direction of the CW beam is shown as a line across the B-scan image. In the case of PW Doppler, markers on the beam line show the position of the sample volume. The Doppler beam is often directed across the field of view so that it does not intersect the blood flow at 90°.
FIGURE 1-2 Duplex system combining real-time B-mode (- – – – ) and a Doppler beam (—-) of variable position across the B-mode field of view.
A summary of technical factors relating the use of duplex Doppler instruments is given in Box 1-2.
COLOUR DOPPLER IMAGING
Pulsed Doppler techniques require between 50 and 100 ultrasonic pulses to be transmitted in each beam direction for the determination of velocities of blood in a sample volume. It is therefore not possible to move the beam rapidly through the scan plane to build up real-time Doppler images of velocity of flow. Such imaging became possible when signal processing was developed which could quickly produce a measure of mean blood velocity at each sample volume from a small number of ultrasonic echo pulses. A technique called ‘autocorrelation processing’ of the signals from blood quickly gives the mean velocity in each small sample volume along the beam (Fig. 1-1C). This real-time colour Doppler imaging processes between 2 and 16 echo signals from each sample volume. In addition, the direction of flow is obtained by examining the signals for the direction of the shift as for CW and PW Doppler devices. Each image pixel is then colour-coded for direction in relation to the transducer and mean Doppler shift (Fig. 1-3A).
FIGURE 1-3 (A) Colour flow image of flow from left to right in a straight tube. When the flow velocity component is along the beam towards the transducer it is colour-coded red, when the component along the beam is away from the transducer it is coded blue. (B) Power Doppler image of flow in a straight tube. Direction of flow is not measured so it is not colour-coded.
B-scanning and Doppler imaging are carried out with the common types of real-time transducer. Echo signals from the blood and tissues are processed along two signal paths in the system electronics (Fig. 1-4). Going along one path, the signals produce the real-time B-scan image; going along the other path, autocorrelation function processing and direction flow sensing are employed to give a colour flow image. An important exclusion circuit in the autocorrelation path separates large-amplitude signals which arise from tissue and excludes them from the blood velocity processing. The B-mode and mean velocity images are then superimposed in the final display. Strictly speaking, the flow image is of the mean Doppler shift frequency and not the mean velocity, since the beam–vessel angles throughout the field of view are not measured. Colour shades in the image can indicate the magnitude of the velocity, for example light red for high velocity and dark red for low velocity. Turbulence, related to the range of velocities in each sample volume, may be presented as a different colour or as a mosaic of colours.
A summary of technical factors relating to the use of colour Doppler imaging is given in Box 1-3.
POWER DOPPLER IMAGING
The power of the Doppler signal from each small sample volume in the field of view may be displayed rather than the mean frequency shift (Fig. 1-3B). The power of the signal from each point relates to the number of moving blood cells in that sample volume. The power Doppler image may be considered to be an image of the blood pool. The power mode does not measure velocity or direction and therefore the image shows little angle dependence, nor does it suffer from aliasing; however, it obviously presents less information about blood flow. The attraction of power Doppler images is that they suffer less from noise than velocity images, as the power of the background noise for any sample volume with no blood flow signal is less than the power of the background noise plus Doppler signal when blood flow is present. The background noise may be used to set a threshold above which signals are accepted for Doppler flow. Noise from sample volume regions lacking blood flow is therefore reduced in the power image by a threshold detector. However, when the same signal is used in the velocity imaging mode, the noise will produce a mean velocity value which the machine will treat as a genuine blood velocity and which will therefore appear in the image. The power Doppler mode is therefore less prone to noise and hence more sensitive and can be used to detect small vessels. Further sensitivity can be obtained by averaging power images over several frames to reduce spuriously distributed noise even more. In velocity imaging there is interest in showing quick changes in blood flow and hence less averaging is used.
A summary of technical factors relating to the use of power Doppler imaging is given in Box 1-4.
Ultrasonic Microbubble Contrast Agents
A number of agents have been considered which can enhance the scattering of ultrasound from blood and hence could be employed as echo-enhancing or contrast agents. Ophir and Parker10
[/not-level-membership-for-radiology-category]
