[level-membership-for-critical-care-medicine-category]
4 Pharmacokinetics and Pharmacodynamics
 Be sure to check out the supplementary content available at
 Pearls
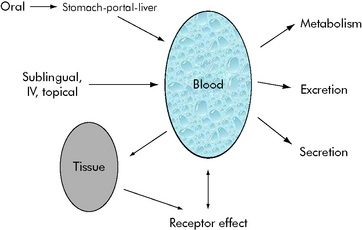
• Pharmacokinetics describes how the body alters drug concentration, including how the drug is dispersed in and removed from the body; it is the effect that the body has on the drug. Pharmacokinetics involves drug absorption, distribution, and elimination.
• Pharmacodynamics describes the relationship between drug concentration and drug effect; it is the effect the drug has on the body.
• The steady state is a state of equilibrium between how much of the drug is administered and how much is being removed from the body. In drugs with first-order kinetics (i.e., the systems that eliminate the drug are not saturated), steady state can be predicted from the drug half-life (t1/2).
• The drug half-life is the time it takes for half of the drug to be eliminated from the body. In each half-life, the drug concentration in the blood will fall by half. You can use the half-life to predict the time to steady state and to know when to anticipate drug effects or changes in effects.
• In general, when administering a drug by continuous infusion, a blood concentration of 90% of steady-state value is achieved in approximately four to five half-lives of the drug. Drugs with long half-lives will require a longer time to achieve steady state unless a loading dose is provided.
Principles of pharmacokinetics
The effects of drug administration vary with both the drug and the patient. There have been many attempts to model these processes using mathematical equations to guide clinical therapy. In addition, understanding of developmental changes in drug metabolism and excretion and emerging information about pharmacogenetics enable more accurate prediction of pediatric drug dosing and effects.2–5
Mathematical modeling of drug paths
Michaelis-Menten Kinetics
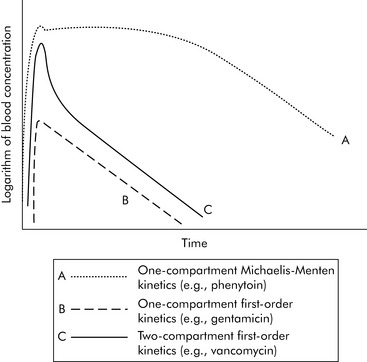
A common drug governed by Michaelis-Menten kinetics is phenytoin. With even a single dose of phenytoin, the enzymes that metabolize the drug (the cytochrome P450 enzymes) are typically saturated, so the phenytoin blood concentration will initially fall slowly after administration. However, once the blood concentration falls sufficiently, the enzymes responsible for metabolism are no longer saturated and the blood concentration will then fall quickly (Fig. 4-2, curve A). Giving too much of a drug initially or giving additional doses too soon can increase the drug concentration and risk of toxicity and prolong effects and elimination time. Implications of phenytoin kinetics with repeated dosing are discussed in the next section.
First Order Kinetics
With first-order kinetics, drugs behave similarly to radioactive decay, and elimination is described in terms of the drug’s half-life (t1/2). The drug half-life is the time it takes for half of the drug to be eliminated from the body. When a half-life is listed in a drug database, the drug has first-order kinetics (see section, Half-life). See Box 4-1 for a metaphor to further explain first- and zero-order kinetics. Many of the principles described in the following sections (e.g., time to study state, volume of distribution, filtration rates) apply chiefly to drugs with first-order kinetics.
Volume of Distribution
Generally speaking, when injecting an intravenous drug, the first compartment it occupies is the blood. If the drug is primarily distributed in the blood (e.g., gentamicin), that is where the drug remains until it is eliminated; these kinetics are described as one-compartment kinetics. The graph of the logarithm of blood concentration over time shows a rise when the drug is administered and a straight line as the drug is eliminated (see Fig. 4-2, curve B).
If a drug is distributed in the blood and the tissues (e.g., vancomycin), intravenous administration temporarily increases the concentration of the drug in the blood. Initially, blood levels decline rapidly as the drug moves into tissue, and then a more gradual decline occurs as the drug is eliminated. This drug activity is called two-compartment kinetics (see Fig. 4-2, curve C).
Implications of Multicompartment Distribution
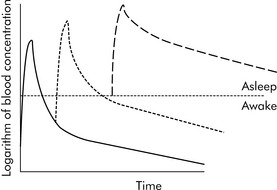
Drugs can disappear rapidly from the blood if they are distributed in the tissue. The best example of this is sodium thiopental (Pentothal). In clinical practice, a single dose of intravenous thiopental has a short effect. However, the drug has a long final half-life. The explanation for this apparent contradiction is that most thiopental elimination occurs after the drug concentration is below the level needed to keep the patient asleep (i.e., anesthetized). If several doses of thiopental are administered in a short period of time in an attempt to produce anesthesia, the tissues will become saturated and no distribution will occur. If the drug concentration increases to sufficiently high levels, the clinical effect (i.e., anesthesia) may last a long time (see Fig. 4-3).
Frequently Used Terms
Steady State
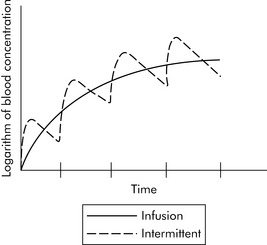
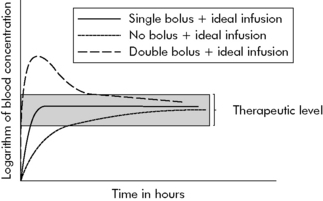
When multiple doses of any medication are given, there is a period of accumulation before the drug reaches what is referred to as steady state. The steady state is a state of equilibrium between the amount of drug administered and the amount of drug being removed from the body. In drugs with first-order kinetics (i.e., the systems that eliminate the drug are not saturated), steady state can be predicted from the drug half-life. When a drug is administered as a continuous infusion, 50% of steady state is achieved during the first half-life of the drug. By the end of the second half-life of the drug, 75% of steady state will be achieved. If there is a need to achieve steady state more rapidly, administer a bolus prior to initiation of the drug infusion (see section, Bolus Plus Infusion Kinetics). Note that the average blood concentration at which steady state ultimately is achieved is the same regardless of whether the drug is given by continuous infusion or intermittent dosing (see Fig. 4-4).
Bolus Plus Infusion Kinetics
Critical care nurses often administer analgesics, sedatives, and vasoactive agents by continuous infusion, and these drugs are titrated to clinical effect. As a result, nurses should be familiar with the effects of continuous infusions and loading doses on drug concentration, as shown in Fig. 4-5.
Michaelis-Menten or Non-linear Kinetics and Dosing
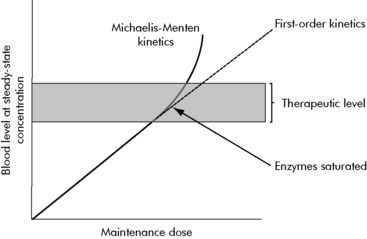
A few common drugs do not obey the basic rules of steady-state equilibrium and can produce toxicity in unexpected ways. The most common of these is phenytoin and its precursor fosphenytoin. At low concentrations, phenytoin has a predictable relationship of dose to steady-state concentration (Fig. 4-6). However, as the dose increases, enzymes that normally inactivate the drug eventually become saturated. At that point, the steady-state concentration begins to rise out of proportion to the increase in dose, and even small increases in dose are then likely to substantially increase drug concentration and produce toxicity.
Additional factors affecting drug elimination
Maturation of Kinetic Processes
Developmental changes associated with hepatic drug metabolism and renal secretion or filtration can accelerate or decelerate drug elimination. Several metabolic processes mature during the first months of life (Fig. 4-7); many drug elimination pathways continue to mature during the first years of life. Failure to recognize these developmental changes in children can lead to drug complications.
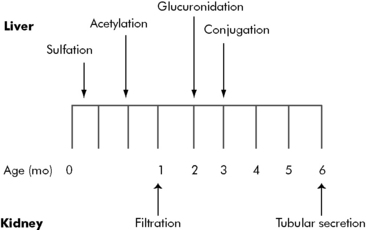
By the end of the first year of life, liver metabolism and drug clearance is similar to that reported in older children and adults. The child’s glomerular filtration rate does not reach adult levels (in mL/min per m2 body surface area) until approximately 3 years of age (Table 4-1)1,6.
| Age | Glomerular Filtration Rate (mL/min per 1.73 m2) |
| Premature infant | 6 |
| Full-term newborn | 8-60 |
| 1 month | 26-90 |
| 1 year | 63-150 |
| 3 years | 89-179 |
| 6 years | 79-170 |
| Adult male | 110-152 |
Consistent with values from Barakat AY, Ichikawa I: Laboratory data. In Ichikawa I, editor: Pediatric textbook of fluids and electrolytes, Baltimore, 1990, Williams and Wilkins; and Tan JM: Nephrology. In Custer JW, Rau RE, editors: The Johns Hopkins Hospital Harriet Lane Handbook, ed 18, Philadelphia, 2009, Mosby-Elsevier.
Drug Excretion
The premature infant has markedly reduced renal function, glomerular filtration rate, and drug clearance, even when compared with a full-term infant. These renal dynamics improve significantly during the first 3 years of life (see Table 4-1). Dosing requirements for a number of drugs change during infancy, even from week to week during the first months of life. In general, for seriously ill or injured infants, the combination of immature renal function and disease state will likely slow drug elimination.
Practical clinical considerations
Dosing Changes
Drugs often demonstrate a variety of kinetics and compartments of distribution. Table 4-2 includes a short list of common pediatric critical care drugs with different kinetics and distribution.
| Drug | Kinetics | Distribution |
| Gentamicin | First order | One compartment |
| Vancomycin | First order | Two compartment |
| Phenytoin | Michaelis-Menten | One compartment |
| Phenobarbital | First order | One compartment |
| Fentanyl | First order | Two compartment |
| Midazolam | First order | Two compartment |
| Digoxin | First order | Multicompartment |
| Pentobarbital | First order | Two compartment |
Drug Monitoring and Dosing
Make Conservative Changes in Dose
When drug concentrations are obtained in the clinical setting, the nurse must interpret the concentrations in light of the patient’s condition. It is particularly dangerous to overinterpret a low drug concentration and make a large increase in dose. Many variables in the patient’s condition and in the blood sampling process in a critical care unit can introduce error and create a falsely low value. A substantial increase in the dose of a drug such as phenytoin can markedly increase the drug concentration (see Fig. 4-6, earlier).
Drug information in databases
Pharmacodynamics
Pharmacodynamics is the description of the effects of the drug on the body. Mathematically there is a sigmoidal (S-shaped) relationship between the receptor activation causing a drug response (i.e., clinical effects) and the logarithm of its blood concentration. This relationship is relatively flat at low concentrations, until enough of the drug is present to produce effects. The relationship is also flat at high concentrations, once receptors are saturated and maximal effects are obtained. At moderate doses (i.e., the center part of this S), there is a nearly direct relationship between drug concentration and drug effects. In other words, increasing the dose increases the effects (see Pharmacodynamics in the Chapter 4 Supplement on the Evolve Website for more information and Chapter 6 for additional information about titration of vasoactive infusions).
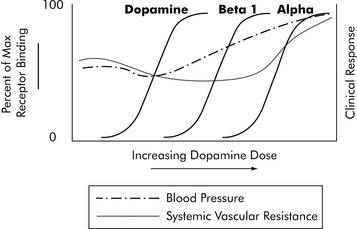
One of the most complex drugs that requires pharmacodynamic assessment is dopamine. Dopamine interacts with three different receptors: the dopamine receptor, the beta-1 receptor, and the alpha receptor. It has a different range of affinities for binding to these three receptors. For each receptor there is a typical S-shaped relationship between the logarithm of dopamine concentration and receptor binding that produces drug effects (Fig. 4-8). As dopamine blood concentration increases, one receptor nears saturation; at the same time, dopamine begins to bind with another receptor, producing additional clinical effects. The net effect on a variable such as systemic vascular resistance is not a typical S because stimulation of different receptors will produce different effects. The key to dopamine titration is understanding that dopamine’s pharmacodynamic effect is modulated by three receptor systems (see Chapter 6).
Summary
The more that critical care nurses understand the potential effects of drug distribution and the child’s age and other factors (e.g., clinical condition) that influence drug elimination, the more they will be able to avoid the problems of drug side effects and toxicities. Through knowledge of basic principles of pharmacokinetics and pharmacodynamics in clinical practice, the nurse can better titrate drugs to maximize therapeutic effects and minimize adverse or toxic drug effects.2–5
1 Barakat A.Y., Ichikawa I. Laboratory data. In: Ichikawa I., editor. Pediatric textbook of fluids and electrolytes. Baltimore: Williams and Wilkins, 1990.
2 Bauer L.: Applied clinical pharmacokinetics. ed 2. New York; McGraw-Hill:2008
3 Birkett D.J. Pharmacokinetics made easy. North Ryde NSW Australia: McGraw-Hill Australia; 2002.
4 Burton M.E., et al, editors. Applied pharmacokinetics and pharmacodynamics, principles of therapeutic drug monitoring. Baltimore: Lippincott Williams & Wilkins, 2006.
5 Potts A.L., et al. Dexmedetomidine pharmacokinetics in pediatric intensive care—a pooled analysis. Paediatr Anaesth. 2009;19(11):1119-1129.
6 Tan J.M. Nephrology. In Custer J.W., Rau R.E., editors: The Johns Hopkins Hospital Harriet Lane Handbook, ed 18, Philadelphia: Mosby-Elsevier, 2009.
[/level-membership-for-critical-care-medicine-category][not-level-membership-for-critical-care-medicine-category]
4 Pharmacokinetics and Pharmacodynamics
Pearls
• Pharmacokinetics describes how the body alters drug concentration, including how the drug is dispersed in and removed from the body; it is the effect that the body has on the drug. Pharmacokinetics involves drug absorption, distribution, and elimination.
• Pharmacodynamics describes the relationship between drug concentration and drug effect; it is the effect the drug has on the body.
• The steady state is a state of equilibrium between how much of the drug is administered and how much is being removed from the body. In drugs with first-order kinetics (i.e., the systems that eliminate the drug are not saturated), steady state can be predicted from the drug half-life (t1/2).
• The drug half-life is the time it takes for half of the drug to be eliminated from the body. In each half-life, the drug concentration in the blood will fall by half. You can use the half-life to predict the time to steady state and to know when to anticipate drug effects or changes in effects.
• In general, when administering a drug by continuous infusion, a blood concentration of 90% of steady-state value is achieved in approximately four to five half-lives of the drug. Drugs with long half-lives will require a longer time to achieve steady state unless a loading dose is provided.
Principles of pharmacokinetics
The effects of drug administration vary with both the drug and the patient. There have been many attempts to model these processes using mathematical equations to guide clinical therapy. In addition, understanding of developmental changes in drug metabolism and excretion and emerging information about pharmacogenetics enable more accurate prediction of pediatric drug dosing and effects.2–5
Mathematical modeling of drug paths
Michaelis-Menten Kinetics
A common drug governed by Michaelis-Menten kinetics is phenytoin. With even a single dose of phenytoin, the enzymes that metabolize the drug (the cytochrome P450 enzymes) are typically saturated, so the phenytoin blood concentration will initially fall slowly after administration. However, once the blood concentration falls sufficiently, the enzymes responsible for metabolism are no longer saturated and the blood concentration will then fall quickly (Fig. 4-2, curve A). Giving too much of a drug initially or giving additional doses too soon can increase the drug concentration and risk of toxicity and prolong effects and elimination time. Implications of phenytoin kinetics with repeated dosing are discussed in the next section.
First Order Kinetics
With first-order kinetics, drugs behave similarly to radioactive decay, and elimination is described in terms of the drug’s half-life (t1/2). The drug half-life is the time it takes for half of the drug to be eliminated from the body. When a half-life is listed in a drug database, the drug has first-order kinetics (see section, Half-life). See Box 4-1 for a metaphor to further explain first- and zero-order kinetics. Many of the principles described in the following sections (e.g., time to study state, volume of distribution, filtration rates) apply chiefly to drugs with first-order kinetics.
Volume of Distribution
Generally speaking, when injecting an intravenous drug, the first compartment it occupies is the blood. If the drug is primarily distributed in the blood (e.g., gentamicin), that is where the drug remains until it is eliminated; these kinetics are described as one-compartment kinetics. The graph of the logarithm of blood concentration over time shows a rise when the drug is administered and a straight line as the drug is eliminated (see Fig. 4-2, curve B).
If a drug is distributed in the blood and the tissues (e.g., vancomycin), intravenous administration temporarily increases the concentration of the drug in the blood. Initially, blood levels decline rapidly as the drug moves into tissue, and then a more gradual decline occurs as the drug is eliminated. This drug activity is called two-compartment kinetics (see Fig. 4-2, curve C).
Implications of Multicompartment Distribution
Drugs can disappear rapidly from the blood if they are distributed in the tissue. The best example of this is sodium thiopental (Pentothal). In clinical practice, a single dose of intravenous thiopental has a short effect. However, the drug has a long final half-life. The explanation for this apparent contradiction is that most thiopental elimination occurs after the drug concentration is below the level needed to keep the patient asleep (i.e., anesthetized). If several doses of thiopental are administered in a short period of time in an attempt to produce anesthesia, the tissues will become saturated and no distribution will occur. If the drug concentration increases to sufficiently high levels, the clinical effect (i.e., anesthesia) may last a long time (see Fig. 4-3).
