Perinatal and maternal mortality
Perinatal mortality
Introduction
Definitions
• Live birth: complete expulsion or extraction from its mother of a product of conception, irrespective of the duration of the pregnancy, which, after such separation, breathes or shows any other evidence of life, such as beating of the heart, pulsation of the umbilical cord, or definite movement of voluntary muscles, whether or not the umbilical cord has been cut or the placenta is attached; each product of such a birth is considered live born.
• Stillbirth or fetal death: death prior to the complete expulsion or extraction from its mother of a product of conception, irrespective of the duration of pregnancy; the death is indicated by the fact that after such separation the fetus does not breathe or show any other evidence of life, such as beating of the heart, pulsation of the umbilical cord or definite movement of voluntary muscles.
• Perinatal period: commences at 22 completed weeks (154 days) of gestation and ends seven completed days after birth.
• Neonatal period: begins with birth and ends 28 complete days after birth. Neonatal deaths may be subdivided into early neonatal deaths, occurring during the first seven days of life (0–6 days), and late neonatal deaths, occurring after the seventh day but before the 28th day of life (7–27days).
In the UK the definitions are different, reflecting the survival rates and concept of viability. The present legal definitions that apply to England and Wales are as follows:
• Stillbirth: A baby delivered without signs of life after 23+6 weeks of pregnancy.
• Neonatal death: death of a liveborn infant occurring within 28 days of birth; an early neonatal death is defined as death during the first week of life (0–6 completed days inclusive).
• Perinatal death: death of a fetus or a newborn in the perinatal period that commences at 24 completed weeks gestation and ends before 7 completed days after birth.
In Australia and New Zealand, stillbirth is defined as ‘Death prior to the complete expulsion or extraction from its mother of a product of conception of 20 or more completed weeks of gestation or of 400 g or more birth weight where gestation is not known. The death is indicated by the fact that after such separation the fetus does not breathe or show any other evidence of life, such as beating of the heart, pulsation of the umbilical cord, or definite movement of voluntary muscles’.
Mortality rates
The current definitions are as follows:
• Perinatal mortality rate (PNMR): the number of stillbirths and early neonatal deaths (those occurring in the first week of life) per 1000 total births (live births and stillbirths)
• Stillbirth rate (SBR): the number of stillbirths per 1000 total births
• Neonatal mortality rate (NMR): the number of neonatal deaths occurring within the first 28 days of life per 1000 live births.
Incidence
WHO publishes global estimates on perinatal mortality rates by level of development and geographical regions. For comparison, the regions are divided into the ‘More developed, Less developed and Least developed’ with figures demonstrating a stark contrast between the regions (Table 5.1). In countries where no data collection takes place, models are produced to estimate mortality based on demographic and health surveys conducted by several agencies. Worldwide, there are over 6.3 million perinatal deaths annually, almost all of which occur in developing countries, and 27% occurring in the least developed countries alone, i.e. the sub-Saharan regions of central Africa. In developing countries, the PNMR is five times greater than in developed countries; in the least developed countries it is six time higher. It is highest in Africa, with 62 deaths per 1000 births, especially in middle and western Africa, with rates as high as 76 per 1000 births. The perinatal mortality rate in Asia is 50 per 1000 total births, with a peak of 65 per 1000 in South-central Asia.
Table 5.1
Global comparison of perinatal and neonatal mortality rates by WHO regions in 2000
| Region | Perinatal mortality rate (per 1000 births) | Stillbirth rate (per 1000 births) | Early neonatal rate (per 1000 live births) | Neonatal mortality rate (per 1000 live births) |
| More developed | 10 | 6 | 4 | 5 |
| Less Developed | 50 | 26 | 25 | 33 |
| Least Developed | 61 | 31 | 31 | 42 |
| World | 47 | 24 | 23 | 41 |
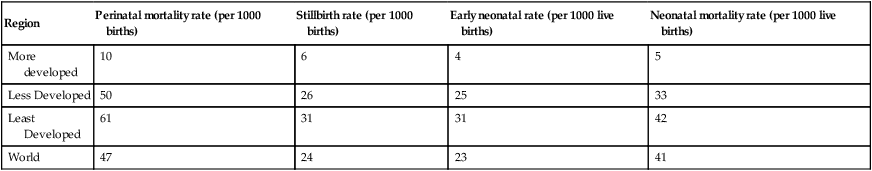
(Source: World Health Organization (2006) Neonatal and Perinatal Mortality: Country, Regional and Global Estimates. WHO Press, Geneva.)
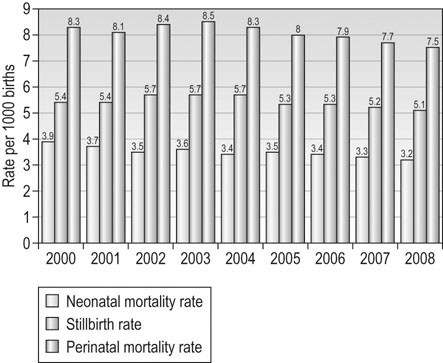
Developed countries (Western Europe, North America, Japan, Australia and New Zealand) have seen a steady fall in the PNMR over the last 30 years. In the UK, the Centre for Maternal and Child Enquiries (CMACE) publishes annual perinatal reports and showed a statistically significant downward trend in the perinatal mortality rate, from 8.3 in 2000 to 7.5 per 1000 total births in 2008. This is due to both a statistically significant decrease in the early neonatal mortality rate (from 2.9 in 2000 to 2.5 in 2008 per 1000 live births) and a statistically significant decrease in the stillbirth rate ( from 5.4 to 5.1 per 1000 live births, respectively) (Fig. 5.1).
Sociodemographic factors and perinatal mortality
Factors that are known to affect perinatal mortality in the UK and Australia include the sociodemographic characteristics of the mother such as maternal age, deprivation, ethnicity (Table 5.2). Smoking also has a significant adverse effect on birth weight and perinatal mortality.
Table 5.2
Sociodemographic characteristics of mothers: England, Wales, Northern Ireland and the Crown Dependencies, 2008
| Stillbirth rate (per 1000 births) | Neonatal death rate (per 1000 live births) | |
| Maternal age | ||
| <20 | 5.6 | 3.7 |
| 20–24 | 5.2 | 3.3 |
| 25–29 | 4.4 | 2.9 |
| 30–34 | 4.6 | 2.6 |
| 35–39 | 5.3 | 2.6 |
| 40+ | 7.8 | 2.9 |
| Deprivation (England) | ||
| 1 (Least deprived) | 3.9 | 1.9 |
| 2 | 3.9 | 2.4 |
| 3 | 4.7 | 2.5 |
| 4 | 5.3 | 3.1 |
| 5 (most deprived) | 6.5 | 4.0 |
| Ethnicity (England) | ||
| White | 4.2 | 2.4 |
| Black | 9.9 | 5.7 |
| Asian | 7.4 | 4.1 |
| Chinese | 4.3 | 1.4 |
| Mixed | 5.4 | 3.7 |
| Others | 5.9 | 2.0 |
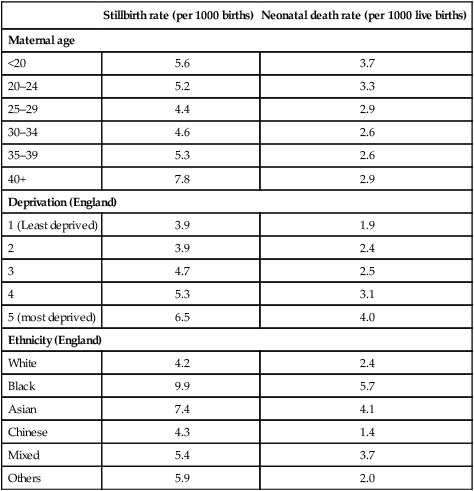
(Source: Centre for Maternal and Child Enquiries (CMACE) (2010) Perinatal Mortality 2008 United Kingdom. CMACE, London.)
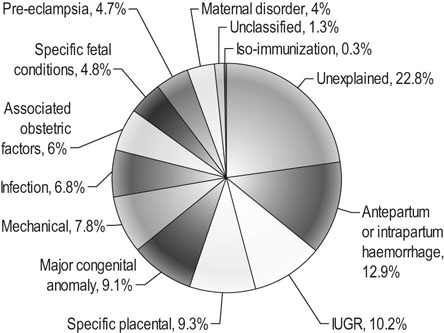
Causes of stillbirths
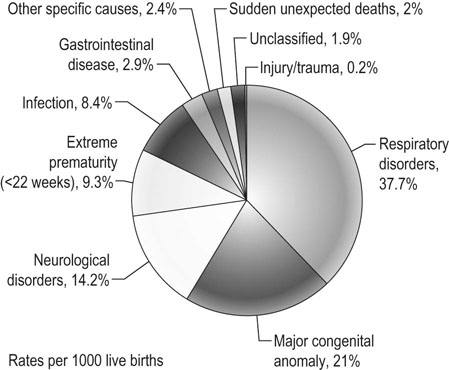
Recognizing the importance of understanding the causes of stillbirths better, CMACE came up with a new classification in the 2008 Perinatal Mortality report that had an increased focus on placental pathology in attempting to recognize patterns in causes of death or identifying preventable causes. As a result of this new classification, 23% of stillbirths were unexplained. The main causes identified in the CMACE classification were (Fig. 5.2):
Causes of neonatal deaths
In the UK, the neonatal classification used by CMACE looked at the primary cause and associated factors for neonatal deaths. In the past, nearly half of the neonatal deaths were due to immaturity, but the new classification restricted extreme prematurity to only cases below 22 weeks gestation, resulting in only 9.3% of neonatal deaths falling within this category. The major causes of neonatal deaths in the 2008 report are as follows (Fig. 5.3):
Maternal mortality
Definition
Maternal deaths are further subdivided into the following groups:
• Direct deaths: those resulting from conditions or complications or their management that is unique to pregnancy, occurring during the antenatal, intrapartum or postpartum periods.
• Indirect deaths: those resulting from previously existing disease, or disease that develops during pregnancy not as the result of direct obstetric causes, but which were aggravated by physiological effects of pregnancy.
• Late: deaths occurring between 42 days and 1 year after abortion, miscarriage or delivery that are the result of direct or indirect maternal causes.
• Coincidental (fortuitous): Deaths from unrelated causes that occur in pregnancy or the puerperium.
Maternal mortality rates
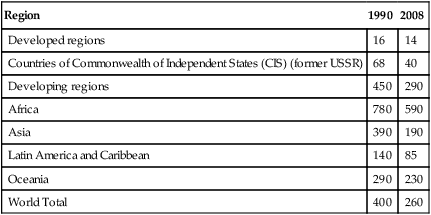
In the 2010 report issued by WHO (Table 5.3), the United Nations Children’s Fund (UNICEF), the United Nations Population Fund (UNFPA) and the World Bank report entitled ‘Trends in Maternal Mortality: 1990–2008’, it is encouraging to note that the number of maternal deaths had decreased by 34% from an estimated 546 000 in 1990 to 358 000 in 2008. However, this rate of decline still falls short of the target set for MDG 5, meaning that there should be continued effort and investment in women’s health in order to achieve the goals by 2015. The report showed that 99% of all maternal deaths in 2008 occurred in developing regions, with Sub-Saharan Africa and South Asia accounting for 57% and 30% of all deaths, respectively. Globally, the four major causes of maternal death are:
Table 5.3
Maternal mortality rates* by United Nations regions, 1990 and 2008
| Region | 1990 | 2008 |
| Developed regions | 16 | 14 |
| Countries of Commonwealth of Independent States (CIS) (former USSR) | 68 | 40 |
| Developing regions | 450 | 290 |
| Africa | 780 | 590 |
| Asia | 390 | 190 |
| Latin America and Caribbean | 140 | 85 |
| Oceania | 290 | 230 |
| World Total | 400 | 260 |
(Source: World Health Organization (2010) Trends in Maternal Mortality: 1990 to 2008. Estimates Developed by WHO, UNICEF, UNFPA and The World Bank. WHO Press, Geneva.)
In the UK, the Confidential Enquiry into maternal deaths has been publishing triennial reports since it was introduced in England and Wales in 1952. Since the UK-wide Enquiry was started, the eighth Report of the Confidential Enquiries into Maternal Deaths in the United Kingdom in the Triennium 2006–2008 was published in 2011. Published by CMACE, it investigated the deaths of 261 women who died from causes directly or indirectly related to pregnancy. In Australia similar data on maternal mortality are reported every three years by the Australian Institute of Health and Welfare.
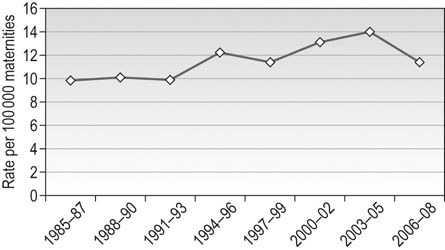
There has been a significant reduction in the overall UK maternal death rates from 13.95 per 100 000 maternities in the previous triennium to 11.39 per 100 000 maternities in the 2006–2008 triennium (Fig 5.4). Compared with the international classification of maternal deaths from death certification alone, the UK MMR was 11.26 per 100 000 live births for 2006–2008. Downward trends were noted in maternal mortality for women from the deprived population and also in the ethnic minority groups. Similar trends have occurred in Australia with a fall in the MMR from 12.7 per 100 000 maternities in 1973–1975 to 8.4 in 2003–2005. The MMR in indigenous women (21.5 per 100 000) remains more than two and half times higher than in the non-indigenous population (7.9 per 100 000).
Major causes of maternal death in the UK
Although an overall decrease in the number of direct maternal deaths is noted, there has been a worrying rise in the numbers of deaths related to genital tract sepsis, particularly from community-acquired Group A streptococcal disease, making this the commonest cause of direct maternal deaths in the UK.
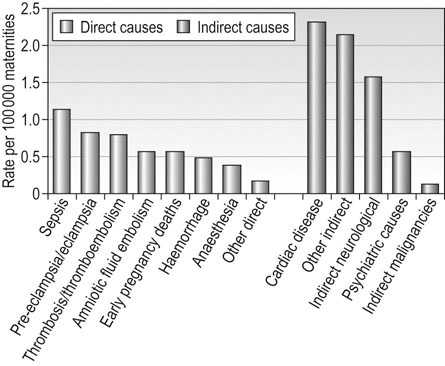
The number of indirect maternal deaths has remained largely unchanged since the last triennium. The commonest three indirect causes of maternal death in the year following delivery are cardiac disease, other indirect causes and neurological conditions. Many of the women with cardiac disease had lifestyle-related risk factors such as obesity, smoking and maternal age (Fig 5.5).
 Essential information