[level-membership-for-anesthesiology-category]
Pericardium and Extra-Cardiac Structures
Anatomy and Pathology
Enrique Pantin and F. Luke Aldo
There are so many things surrounding the heart that no one pays attention to!
It is all about the heart though, so who cares about all that other stuff. Right? Wrong!
The Pericardium
 Surrounds, protects, supports, limits chamber dilation, and lubricates, allowing the free motion of the heart.
 Provides entry and exit passages to the heart.
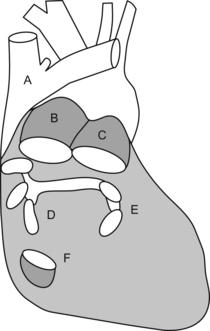
 Is a medium-sized bag with lots of holes and tubes crossing it to enter or exit the heart:


 Upper abdominal aorta and its branches.


 Spine, vertebral disks, and spinal cord (just bits of it can be seen).
 Stomach and its content or lack of it.


 Other stuff like the tongue could be seen but it won’t be TEE but oral ultrasound!
 Starting from the esophageal entrance we can see the main neck vessels (the carotid arteries and internal jugular veins)
 can be used to guide central line placement, though I would NOT recommend this in the awake patient!
 In the esophageal upper 1/3, we can see part or all of the arch vessels


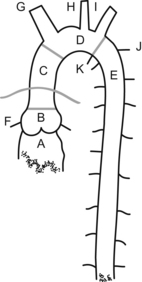
L = left and R = right; PA = pulmonary artery, P = pulmonary veins, H = heart, L = liver, S = spleen, and K = kidney.
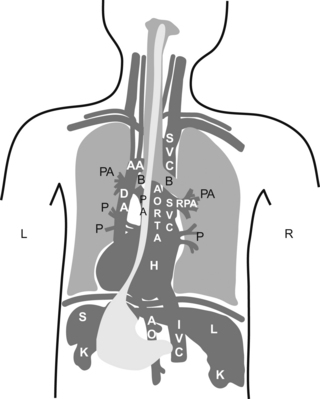
 Did you understand the drawing?, I didn’t… If you didn’t, don’t kill yourself over it, it is a pretty bad drawing. My partner did the drawing, so call him and let him know you are happy he is a doctor and not an artist!

 All potential spaces in the chest and abdomen (pericardial, pleural, abdominal, sub-diaphragmatic, and hepato-renal) have the potential for fluid accumulation.


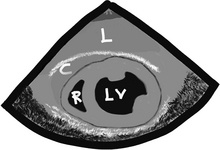
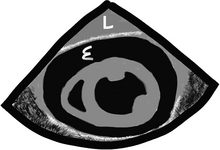
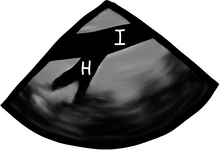
In a transgastric mid-short-axis view below, we can see lots of stuff besides the heart!
 Gastric lining at the top, note the gastric rugae (those very tiny indentations in the very top of the echo image).

 Pericardial reflection (that white line between “L” and the heart).
 Moderate-sized focal image “C”, suggestive of clotted blood:

 looks very similar to a layer of epicardial fat and can trick even the experts!
 the history and additional findings will help define what the heck this is.


 “Is there a pericardial effusion or not?” and if there is,

 “Is there an aortic dissection?”


 “Is there a clot in the pulmonary artery or other evidence of a pulmonary embolism?”

The Pericardium—we are back here again!

 Is difficult to see by echo unless there is fluid on both sides of it or it is very thickened.
 Can elicit some extra brightness on echo like it has its own light.
 Has two layers (fibrous and serous).
 Serous layer has visceral and parietal aspects:
 serous parietal layer is tightly bound to the fibrous pericardium that separates it from the rest of the chest structures

 The layers extend a couple of centimeters, incorporating the aorta and main pulmonary artery.


 When the oil level is too high, we call this a pericardial effusion.
 Several types of “oil” can fill the pericardial space:
 serum, sero-sanguineous fluid, blood, pus, solid things like metastatic tumors, fibrinous strands, etc.

 idiopathic causes, inflammation, infection, post heart attack, systemic conditions, malignancy, post trauma, surgery, radiation, congestive heart failure, etc.

 can be all around the heart (“E” in the image below) or just localized in an area (focal accumulation or loculated)
 effusion can squeeze the whole heart or just a particular area


 Pericardial-cardiac filling pressures are intimately related to breathing.


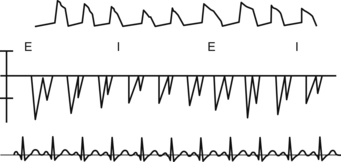
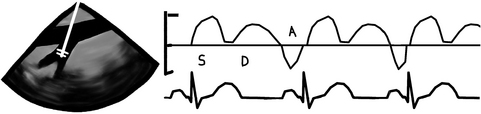
 During MECHANICAL ventilation, the intrathoracic pump-sucking effect created by the negative pressure during SPONTANEOUS inspiration is lost and things get much worse for the blood pressure if there is tamponade. During MECHANICAL ventilation, the ventilation-pericardial pressure/cardiac filling relationship is reversed and the inspiratory thoracic pump is GONE! All this stuff is easily seen if the patient has an arterial line (top tracing) and also if left ventricular filling patterns are measured using PWD (middle tracing) through the mitral valve. “I” = inspiration; “E” = expiration.


The Aorta
 Is the strongest tube we have, and one of the longest.


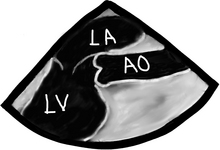
 The ascending is contained, with the pulmonary artery trunk, in the pericardial sac and can be divided into the root with its sinus of Valsalva, sinotubular junction, and ascending aorta.

 The coronary arteries are the only branches of the ascending aorta.


 CT and MRI provide excellent views of the aorta, its branches, and of all extra cardiac structures, but they require IV contrast. Additionally, the MRI/MRA requires lots of time. CT and MRI are also both very “difficult” to do in the operating room!


 We are not going to give you the TEE multiplane angles “recommended”. Instead you should try to:


Aortic aneurysm, dissection, and atheroma are the 3 big things. The good thing is that we know what these things look like in the anatomic specimen. With TEE it is only black-and-white images.
Aortic Aneurysm


Aortic Pseudoaneurysm
 Aortic pseudoaneurysm is a contained rupture of the aorta where the aneurysm wall is made of non aortic tissues (surrounding tissues).
 Usually has a narrow neck, like in the case of a ventricular pseudoaneurysm.
 Can be spontaneous, secondary to an aneurysm, trauma, post surgery, iatrogenic, or infection.
Aortic Dissection
 Dissection occurs when a breach in the intima allows pressurized blood to separate the intima from the medial layers. In the image below note the double wall in the ascending aorta, typical of dissection.
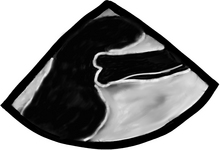
 Blood can propagate proximally, distally, or both between the intima and medial layers.


 all dissections involving the ascending aorta or arch are considered life-threatening emergencies and must be taken to the operating room as soon as possible. These can rupture or extend and cause tamponade, aortic insufficiency, myocardial or cerebral ischemia or infarct, or exsanguination


Aortic Plaque
Aortic plaque or atherosclerosis is a common finding in our older or vascular patients.
 Hypertension, diabetes, smoking, high cholesterol, and poor diet (usually a Western diet; i.e. most of us!!!! I’ll take a Big Mac and fries please. Oh and can you supersize that! STAT!) are all risk factors.
 Plaque is often located in the arch and descending aorta, and is less common in the ascending aorta.


 The bigger and more mobile they are, the higher risk for stroke and embolic phenomena there is.


Aortic Trauma
 Most commonly occurs after blunt chest trauma, usually due to high-speed impact.


 If the transection is complete, kaput you are DEAD!

 TEE can miss small tears in the arch and ligamentum area as they are difficult to see with TEE due to tracheal interposition. Anyway aortic shape disruption, adventitial hematoma, small evagination of the wall, intraluminal hematoma, small flaps or tears can be seen.


Pulmonary Artery
 It can tell us a bit about the chronic pulmonary vasculature strain it suffers with chronic severe mitral regurgitation, pulmonary hypertension (primary or secondary to asthma, COPD, etc.), acute or chronic pulmonary embolism, etc. In all chronic cases it gets BIG, and we don’t mean fat, but dilated like a nice round Italian sausage.

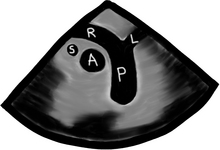
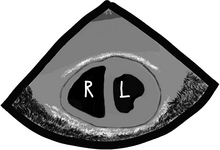
 As a rule made by us, the right (“R”) and left (“L”) pulmonary artery should be 2/3 the diameter of the main pulmonary artery (“P”), and the main PA and SVC (“S” = short-axis superior vena cava) should be 2/3 of the ascending aorta (“A” = short-axis ascending aorta). This “2/3” rule also applies to many other chambers and tubes in the heart.


Now what? We looked at the tubes going out of the heart. Now it’s time for the incoming pipes.
Superior Vena Cava, Inferior Vena Cava, and their Cousins the Hepatic Veins
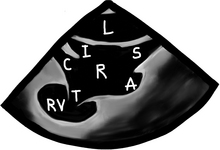
In this modified bicaval view, we can see the left atrium (“L”), the interatrial septum and its thinner/thinner area (the fossa ovalis), the right atrium (“R”), the SVC (“S”), the IVC (“I”), the entrance of the coronary sinus (“C”), and the right atrial appendage with its typical broad base (“A”). The tricuspid valve (“T”) can also be partially seen, as well as some of the right ventricle (“RV”).
 Like the pulmonary venous flow, has 3 main waves, the “S”, “D”, and “A” waves.


Well, well we are not done, but from here on it is much easier!
 The azygos vein, trachea, thymus (in children), and spine can be seen, but add very little in acute care.

 From the gastric window, the liver and spleen are easily identified.

 if there is a lack of IVC diameter change or the IVC is dilated this is suggestive of elevated CVP. This is an easy way to have an idea about what is going on with the right heart.

 We leave the lung and pleural space for last.
 TEE exam is never complete if we do not look at the left and right pleural spaces
 lung can be seen with its typical aerated pattern
 if there is lung atelectasis or condensation it looks like liver. Remember?
 pneumothorax is much more difficult to diagnose and we will leave that for you to research!
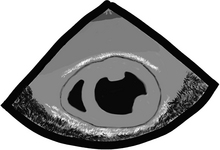
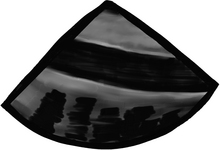
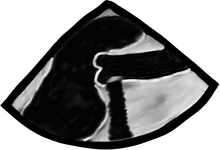
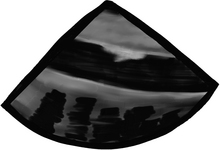
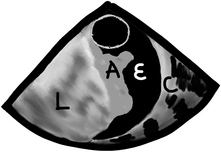
 pleural effusions are easy to see, but we need to look for them. The best view to start looking for pleural effusions is in the descending aorta short-axis view. Anything we see in this location, we will know belongs to the left chest, as seen in the following image. This is a short-axis view of the descending aorta with normal lung (“L”), atelectatic lung which looks very similar to the liver in echo (“A”), pleural effusion (“E”), and the chest wall with the ribs and all (“C”).

[/level-membership-for-anesthesiology-category][not-level-membership-for-anesthesiology-category]
Pericardium and Extra-Cardiac Structures
Anatomy and Pathology
Enrique Pantin and F. Luke Aldo
There are so many things surrounding the heart that no one pays attention to!
It is all about the heart though, so who cares about all that other stuff. Right? Wrong!
The Pericardium
Surrounds, protects, supports, limits chamber dilation, and lubricates, allowing the free motion of the heart.
Provides entry and exit passages to the heart.
Is a medium-sized bag with lots of holes and tubes crossing it to enter or exit the heart:
Upper abdominal aorta and its branches.
Spine, vertebral disks, and spinal cord (just bits of it can be seen).
Stomach and its content or lack of it.
Other stuff like the tongue could be seen but it won’t be TEE but oral ultrasound!
Starting from the esophageal entrance we can see the main neck vessels (the carotid arteries and internal jugular veins)
can be used to guide central line placement, though I would NOT recommend this in the awake patient!
In the esophageal upper 1/3, we can see part or all of the arch vessels
L = left and R = right; PA = pulmonary artery, P = pulmonary veins, H = heart, L = liver, S = spleen, and K = kidney.
Did you understand the drawing?, I didn’t… If you didn’t, don’t kill yourself over it, it is a pretty bad drawing. My partner did the drawing, so call him and let him know you are happy he is a doctor and not an artist!
All potential spaces in the chest and abdomen (pericardial, pleural, abdominal, sub-diaphragmatic, and hepato-renal) have the potential for fluid accumulation.
In a transgastric mid-short-axis view below, we can see lots of stuff besides the heart!
Gastric lining at the top, note the gastric rugae (those very tiny indentations in the very top of the echo image).
Pericardial reflection (that white line between “L” and the heart).
Moderate-sized focal image “C”, suggestive of clotted blood:
looks very similar to a layer of epicardial fat and can trick even the experts!
the history and additional findings will help define what the heck this is.
“Is there a pericardial effusion or not?” and if there is,
“Is there an aortic dissection?”
“Is there a clot in the pulmonary artery or other evidence of a pulmonary embolism?”
The Pericardium—we are back here again!
Is difficult to see by echo unless there is fluid on both sides of it or it is very thickened.
Can elicit some extra brightness on echo like it has its own light.
Has two layers (fibrous and serous).
Serous layer has visceral and parietal aspects:
serous parietal layer is tightly bound to the fibrous pericardium that separates it from the rest of the chest structures
The layers extend a couple of centimeters, incorporating the aorta and main pulmonary artery.
When the oil level is too high, we call this a pericardial effusion.
Several types of “oil” can fill the pericardial space:
serum, sero-sanguineous fluid, blood, pus, solid things like metastatic tumors, fibrinous strands, etc.
idiopathic causes, inflammation, infection, post heart attack, systemic conditions, malignancy, post trauma, surgery, radiation, congestive heart failure, etc.
[/not-level-membership-for-anesthesiology-category]
