Chapter 11 Pericardial, Myocardial, and Pulmonary Syndromes
A wide variety of major disease processes may affect the ECG. Particularly important are conditions affecting the pericardium (acute pericarditis, pericardial effusion, and chronic constrictive pericarditis), the myocardium itself (not including ischemia and infarction, which are discussed in Chapters 8 and 9), and the lungs (acute pulmonary embolism and chronic obstructive pulmonary disease).
Acute Pericarditis, Pericardial Effusion, and Chronic Constrictive Pericarditis
Acute Pericarditis
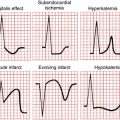
As mentioned in Chapter 8, the ECG patterns of pericarditis resemble those seen with acute MI. The early phase of acute pericarditis is usually characterized by ST segment elevations. This type of current of injury pattern results from inflammation of the heart’s surface (epicardium), which often accompanies inflammation of the overlying pericardium (Fig. 11-1).
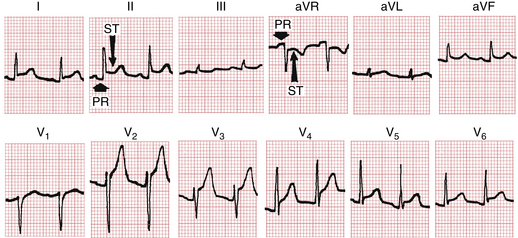
A major difference between these elevations and the ones occurring with acute MI is their distribution. The ST segment elevations with acute MI are characteristically limited to the anterior or inferior leads because of the localized area of the infarct. The pericardium envelops the heart, and the ST-T changes occurring with pericarditis are therefore usually more generalized. ST segment elevations are typically seen in both anterior and inferior leads. For example, in Figure 11-1 notice the elevations in leads I, II, aVL, aVF, and V2 to V6.
Not only does acute pericarditis affect ventricular repolarization (the ST segment), it also affects repolarization of the atria, which starts during the PR segment (the end of the P wave to the beginning of the QRS complex) (see Fig. 11-1). In particular, pericardial inflammation often causes an atrial current of injury, reflected by elevation of the PR segment in lead aVR and depression of the PR segment in other extremity leads and the left chest leads (V5 and V6).
The ST segment elevations seen with acute pericarditis are sometimes followed (after a variable time) by T wave inversions (Fig. 11-2). This sequence of elevations and inversions is the same as that described for MI. In some cases the T wave inversions caused by pericarditis resolve completely with time and the ECG returns to normal. In other cases the T wave inversions persist for long periods.
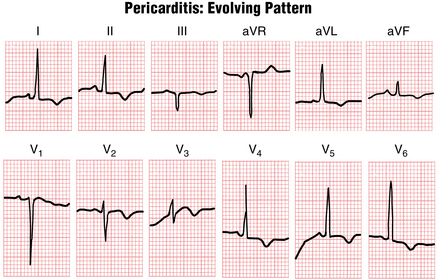
The similarity between the ECG patterns of acute pericarditis and acute MI has been emphasized because both conditions may produce ST segment elevations followed by T wave inversions. As noted, however, the ST-T changes with pericarditis tend to be more diffuse than the localized changes of MI. Another major difference is that pericarditis does not produce abnormal Q waves, such as those seen with certain infarcts. With MI, abnormal Q waves occur because of the death of heart muscle and the consequent loss of positive depolarization voltages (see Chapter 8). Pericarditis, on the other hand, generally causes only a superficial inflammation and does not produce actual myocardial necrosis. Thus, abnormal Q waves never result from pericarditis alone.
Pericardial Effusion
Pericardial effusion refers to an abnormal accumulation of fluid in the pericardial sac. In most cases this fluid accumulates as the result of pericarditis. In some cases, however, such as myxedema (hypothyroidism) or rupture of the heart, pericardial effusion may occur in the absence of pericarditis. The major clinical significance of pericardial effusion is the danger of cardiac tamponade, in which the fluid actually “chokes off” the heart, leading to a drop in blood pressure and sometimes to cardiac arrest with pulseless electrical activity (see Chapter 19).
The criteria for high voltage were mentioned in the discussion of hypertrophy patterns (see Chapter 6). Low voltage is said to be present when the total amplitude of the QRS complexes in each of the six extremity leads is 5 mm (0.5 mV) or less. Low voltage in the extremity leads may or may not be accompanied by low voltage in the chest leads, defined as a peak-to-trough QRS amplitude of 10 mm or less in each of leads V1 to V6.
Figure 11-2 shows an example of low voltage. A listing of other factors that can produce low QRS voltage is presented in one of the Instant Review boxes in Chapter 24.
For example, obesity can cause low voltage because of the fat tissue that lies between the heart and the chest wall. Patients with emphysema have increased inflation of the lungs. This extra air acts to insulate the heart. Of the causes of low voltage listed, obesity, anasarca (generalized edema), pleural effusions, and emphysema are among the most common. However, when you see low voltage (particularly with sinus tachycardia), you always need to consider pericardial effusion because it can lead to fatal tamponade (see also Chapter 19).
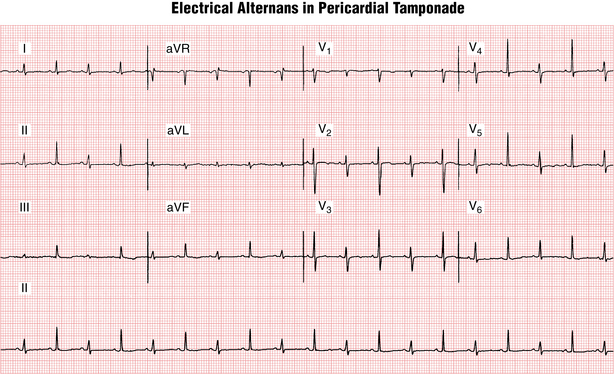
Electrical alternans is another very important pattern that can occur with pericardial effusion and tamponade (Fig. 11-3). This pattern is characterized by a beat-to-beat shift in the QRS axis associated with mechanical swinging of the heart to-and-fro in a relatively large accumulation of fluid. Electrical alternans with sinus tachycardia is virtually diagnostic of cardiac tamponade, although not every patient with tamponade shows this pattern (high specificity, modest sensitivity).
Chronic Constrictive Pericarditis
Some conditions causing pericardial inflammation can lead to fibrosis and calcification of the pericardial sac. Causes include cardiac surgery, trauma, infections such as tuberculosis (especially prevalent in developing nations), viral infections (that may not be noted at the acute phase), malignancy, connective tissue diseases, sarcoid, uremia (renal failure), and asbestosis. In some cases, no cause is evident (idiopathic).
Chronic Heart Failure
• Prominent Q waves and typical ST-T changes suggest underlying ischemic heart disease with extensive underlying infarction.
• Left ventricular hypertrophy patterns (see Chapter 6) may occur with hypertensive heart disease, aortic valve disease (stenosis or regurgitation), or mitral regurgitation.
• The combination of left atrial enlargement (or atrial fibrillation) and signs of right ventricular hypertrophy (RVH) strongly suggest mitral stenosis (see Fig. 23-1).
• Left bundle branch block (LBBB) (see Chapter 7) may occur with CHF caused by ischemic heart disease, valvular abnormalities, hypertension, or cardiomyopathy.
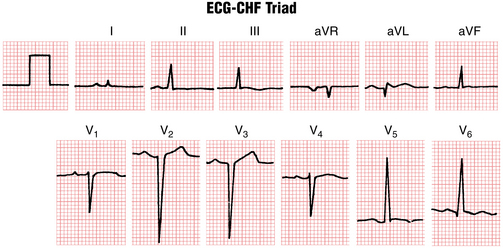
1. Relatively low voltages in the extremity leads, such that the QRS in each of the six extremity leads is 8 mm or less in amplitude
2. Relatively prominent QRS voltages in the chest leads, such that the sum of the S wave in either lead V1 or lead V2 plus the R wave in V5 or V6 is 35 mm or more
3. Very slow R wave progression defined by a QS- or rS-type complex in leads V1 to V4
When the ECG-CHF triad is present (Fig. 11-4), it strongly suggests underlying cardiomyopathy but does not indicate a specific cause. The triad may occur not only with primary dilated cardiomyopathy but also with severe heart disease caused by previous infarction or significant valvular dysfunction. Furthermore, the ECG-CHF triad has only modest sensitivity; that is, its absence does not exclude underlying cardiomyopathy.
Pulmonary Embolism
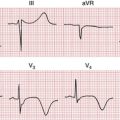
The ECG is not a sensitive test for pulmonary embolism. In some cases the obstruction produced by an embolus in the pulmonary artery system can lead to ECG changes, but generally no single pattern is always diagnostic. All of the following patterns may be seen (Fig. 11-5):
• Sinus tachycardia (Arrhythmias such as ventricular ectopy and atrial fibrillation also occur.)
• A right ventricular overload (formerly called “strain”) pattern (inverted T waves in leads V1 to V4)
• The so-called S2Q3T3 pattern, with an S wave in lead I and a new Q wave in lead III with T wave inversion in that lead (This pattern, which may simulate that produced by acute inferior wall MI, is probably due to acute right ventricular dilation.)
• Shifting of the QRS axis to the right
• ST segment depressions consistent with subendocardial ischemia (Chapter 9)
• An incomplete or complete right bundle branch block (RBBB) pattern (wide rSR′ in lead V1)
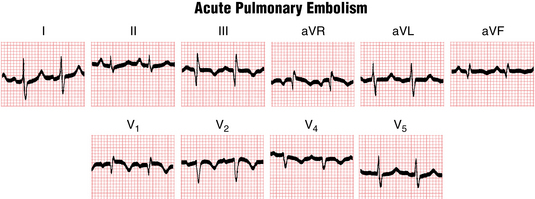
The appearance of these changes, particularly in combination, is suggestive but not diagnostic of pulmonary embolism. Many patients with massive pulmonary emboli have only minor, relatively nonspecific changes on their ECG. Thus, both the diagnostic sensitivity and the specificity of the ECG with pulmonary embolism are limited. Figure 11-5 shows a classic example of the changes seen with pulmonary embolism. These findings may also be due to other causes of acute or subacute right ventricular overload (cor pulmonale) due, for example, to severe pneumonia or extensive pulmonary malignancy.
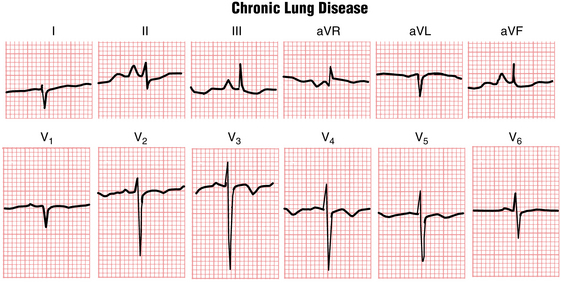
Chronic Lung Disease (Emphysema)
Patients with severe chronic obstructive lung disease from emphysema often have a relatively characteristic constellation of ECG findings (Fig. 11-6), including (1) low QRS voltage, (2) slow R wave progression in the chest leads, (3) a vertical or rightward QRS axis in the frontal plane, and (4) right atrial overload. Excessive pulmonary air trapping causes the low voltage. The slow R wave progression results, in part, from the downward displacement of the diaphragm. Thus, the chest leads are actually placed relatively higher than usual. In addition, right ventricular dilation may contribute to the delayed chest lead transition zone. Finally, the anatomically vertical position of the heart in the chest of a patient with emphysema (and sometimes right ventricular enlargement) causes the mean QRS axis to be vertical or even rightward (greater than +100°). Tall, relatively narrow P waves caused by right atrial overload (see Fig. 11-6) may be present, with a vertical or rightward P wave axis (+90° or so).