Perfusion Imaging and Magnetoencephalography
Perfusion Imaging
In the cerebrovascular literature, perfusion imaging refers to an all-encompassing term of various methods to measure hemodynamically derived functional parameters in the brain.1,2 In radiology, the three most common parameters that are assessed and utilized clinically are cerebral blood volume (CBV), cerebral blood flow (CBF), and mean transit time (MTT). CBV refers to the amount (volume) of blood within a given mass of brain tissue at a given time and is measured in mL/100 g. CBF refers to the flow of blood through an area of the brain and is usually measured in mL/100 g of brain tissue per minute. MTT refers to the time it takes for blood to flow between the arterial inflow and venous outflow in the brain, that is, the time that blood spends in the cerebral capillary circulation, and is often measured in seconds. The general relationship between these three parameters is depicted by the central volume theorem:

Evaluation of these various perfusion parameters can give us an understanding of the physiological state of the brain and cerebral vasculature in various disorders and help in patient management. Cerebral perfusion can be measured by a variety of methods including magnetic resonance imaging (MRI), computed tomography (CT), and nuclear medicine techniques. These techniques differ in terms of image acquisition duration, spatial resolution, the types of endogenous or exogenous tracers used, and their ability or accuracy in measuring different perfusion parameters.1 The clinical applications of perfusion imaging include investigation of cerebrovascular disease, brain tumors, and the effect of other diseases on cerebral perfusion.
Perfusion MRI
Dynamic Susceptibility Contrast Perfusion MRI
Dynamic susceptibility contrast (DSC) perfusion MRI is based on susceptibility effects using T2-weighted or, more commonly, T2*-weighted images and is the most commonly studied and clinically used perfusion technique in assessment of brain masses and stroke. This method is based on the principle that the signal change that occurs during passage of a high-concentration bolus of gadolinium contrast material in the vessels causes a difference in susceptibility between the vessels that contain contrast material and brain tissue and that this signal change can be converted to a relaxation rate change proportional to the fraction of blood volume within each voxel.3,4 Data generally are acquired during first-pass perfusion over approximately 1 minute, during which time a high-concentration bolus of gadolinium chelate is rapidly injected intravenously. Time-signal intensity curves drawn during this acquisition will show a rapid decline in signal as the contrast enters the brain, with return of the signal to near baseline after the first pass (Fig. 28-1). These measurements are used to construct a relative CBV map, and the time signal intensity curve can be used to derive other perfusion parameters by various mathematical methods.1,5,6
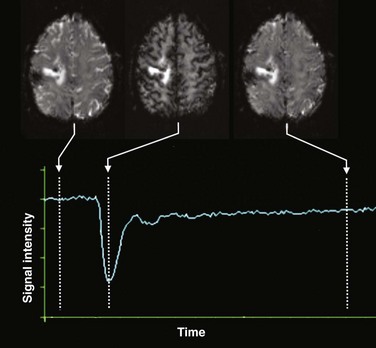
Figure 28-1 Acquisition of dynamic susceptibility contrast perfusion magnetic resonance imaging.
Typically, a rapid echo planar acquisition is obtained through the head continuously over the course of approximately 1 or 1.5 minutes. A rapid injection of gadolinium-based contrast material is injected, which results in a transient dip in the signal intensity during the course of the first pass of contrast through the brain. After this first pass, the signal returns toward normal, although often not completely. A time-signal intensity curve is plotted before, during, and after the first pass bolus for each voxel, including brain tissue and vascular structures, which in turn is used to derive various perfusion parameters.
To provide adequate temporal resolution during dynamic contrast administration, most centers currently use gradient echo planar imaging sequences to perform clinical DSC perfusion MRI.7–9 This technique is very sensitive to structures that cause magnetic field inhomogeneity such as blood, calcium, bone, metals, or air interfaces such as the skull base. The use of DSC imaging entails multiple technical considerations.10,11 Accuracy of CBV maps can vary substantially depending on the acquisition and postprocessing methods used.6 It is important to take into consideration the type of acquisition used in applying research results for characterization of lesions, because the results and thresholds may vary.12 Derivation of the perfusion parameters also depends on the mathematical models used by the various processing software, and caution must be exercised in comparing results from different calculation methods.13,14 Sometimes a small prebolus dose of contrast material is given before the actual DSC acquisition to correct for leakage and more accurate calculation of the perfusion parameters.6,10
DSC perfusion applications are used predominantly to assess cerebrovascular disease and in brain tumor management (e-Fig. 28-2). DSC perfusion can assess the ischemic penumbra in persons who have had an acute stroke and aid in the imaging triage and management of these patients.15,16 DSC perfusion has been used in differentiation of brain tumors from other masslike lesions in the brain, preoperative grading of brain tumors, differentiation of primary from metastatic tumors, assessment of treatment response, and differentiation of radiation necrosis from a recurrent tumor.1,17–23
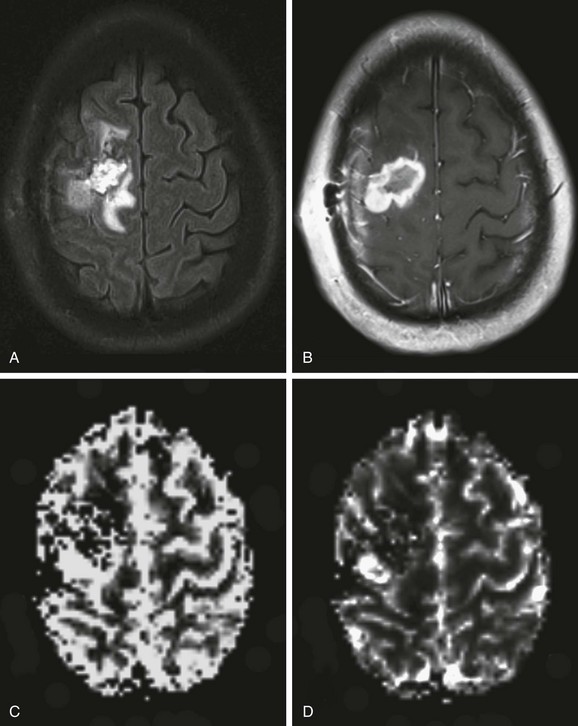
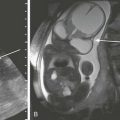
e-Figure 28-2 Perfusion magnetic resonance (MR) imaging in a 17-year-old patient with an anaplastic astrocytoma a few months after surgical resection and chemoradiation therapy.
An axial fluid-attenuated inversion recovery image (A) and postcontrast T1-weighted image (B) demonstrate a surgical resection cavity with signal abnormality and enhancement around the cavity. Relative blood volume (C) and blood flow (D) maps derived from dynamic susceptibility contrast MR perfusion demonstrate a focus of abnormally increased perfusion posterolateral to the surgical resection cavity consistent with recurrence and progression of the neoplasm.
Arterial Spin Labeling Perfusion MRI
ASL perfusion imaging does not require exogenous contrast injection. It uses magnetically labeled arterial blood water as an endogenous flow tracer.24 A general scheme of the ASL technique is illustrated in Figure 28-3. Two sets of images are obtained, one as a baseline image of the brain and the other after labeling (or tagging) blood arterial water protons in the neck using an inversion or saturation radiofrequency pulse. This second set is obtained after a short delay time that allows the labeled blood to flow into the imaging slices. If the baseline and postlabel images are subtracted from each other, the resulting subtracted image is proportional to blood flow that has entered the brain. Quantitative measures of CBF can then be derived from the subtracted images. Numerous schemes exist for ASL tagging and imaging; however, the details are beyond the scope of this chapter.25 Typically, echoplanar or spiral nonechoplanar techniques are used for image acquisition. ASL imaging takes significantly longer than DSC perfusion MRI because the signal change resulting from the arterial spin label is very small (in the order of 0.5% to 3%), and therefore numerous signal averages need to be acquired to gain acceptable signal to noise. Imaging at 3 Tesla significantly increases the signal and quality of ASL images. Given the requirement for image subtraction and longer acquisition times, ASL perfusion is very sensitive to motion artifacts.
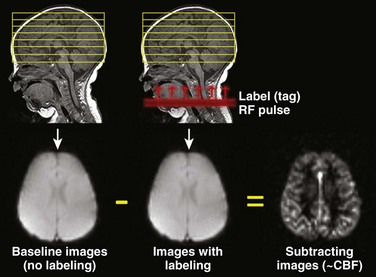
Figure 28-3 A schematic demonstration of the general principle of arterial spin labeling perfusion magnetic resonance imaging.
Images of the head are obtained once without and once with labeling of blood water protons using a radiofrequency (RF) pulse. The labeled (or tagged) blood flows into the brain, and if the images without and with label are subtracted from each other, the difference image results from these labeled blood protons and is proportional to cerebral blood flow (CBF).
Applications of ASL perfusion include cerebrovascular disease, detection of changes during complicated migraine (Fig. 28-4), hypoxic-ischemic injury, depiction of hypoperfusion in mesial temporal sclerosis, and emerging applications in brain tumors.26–32 Further work is needed to establish the role of ASL imaging in pediatrics.
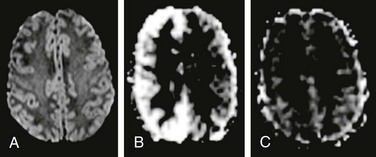
Figure 28-4 Arterial spin labeling (ASL) in a child with hemiplegic migraine.
The patient presented with acute onset left-sided weakness in the face and both the upper and lower extremities, along with headache. Magnetic resonance imaging (MRI) was emergently performed to exclude an arterial ischemic stroke. No abnormality was found on diffusion-weighted imaging (A), but ASL perfusion MRI demonstrated increased cerebral blood flow in the right cerebral hemisphere (B). Two days later, the patient’s symptoms have completely resolved and a repeat MRI demonstrated normal appearance of the brain on ASL perfusion imaging (C).
Computed Tomographic Perfusion Imaging
Dynamic CT perfusion imaging bears some similarity to DSC perfusion MRI in that perfusion parameters are derived from a time-concentration curve obtained during continuous scanning of the first pass of a rapid injection of iodinated contrast material through the brain.1,33,34 Quantitative maps of CBV, CBF, and MTT can be obtained. Dynamic CT perfusion imaging has the advantage of widespread availability and speed, which can be important in the setting of acute stroke or in patients with contraindications to MRI. CT perfusion imaging often is performed in conjunction with CT angiography in the evaluation of cerebrovascular disease. Although continuous scanning of the head for CT perfusion can lead to exposure to a high radiation dose, CT perfusion can be performed satisfactorily with 80 kVp and a low mA technique, which considerably decreases the radiation dose.1,35 CT perfusion imaging has been studied extensively in the evaluation of patients with cerebrovascular disease, especially in the setting of acute ischemic stroke.33,36 It can demonstrate the ischemic penumbra and tissues at risk and can be helpful in patient management (Fig. 28-5).1,33
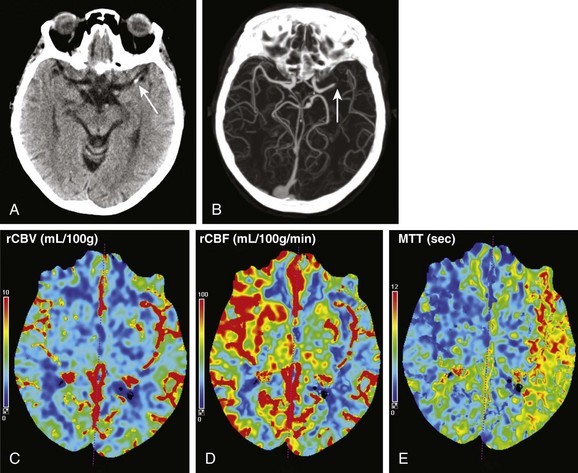
Figure 28-5 Computed tomography (CT) perfusion imaging in a patient with acute right-sided weakness and aphasia.
Noncontrast CT examination (A) demonstrated a focus of high density (arrow) in the M1 segment of the left middle cerebral artery. No loss of gray white differentiation or edema was seen on CT at this time. CT angiography (B) showed an abrupt cutoff in the left middle cerebral artery (arrow). CT perfusion imaging done immediately after CT angiography showed no large change in relative cerebral blood volume (C), but the relative cerebral blood flow (D) was decreased and mean transit time (E) was elevated in the distribution of the left middle cerebral artery compared with the contralateral side.
Other Perfusion Imaging Methods
Xenon CT perfusion uses stable nonradioactive Xenon gas inhaled over the course of a few minutes to act as a contrast agent for perfusion after crossing the blood-brain barrier. Xenon CT perfusion can produce accurate quantitative CBF measurements and even can be used to assess cerebrovascular reserve after a vasodilatory challenge in patients with occlusive or stenotic cerebrovascular disease.1,37,38 Various nuclear medicine techniques also have been used to quantitatively assess cerebral perfusion. These techniques include positron emission tomography using H215O, 15O2, and C15O2 and single photon emission CT using 99mTc-HMPAO and 133Xe. Xenon CT and nuclear medicine perfusion methods are not often performed in pediatric patients because of a lack of widespread availability and clinical expertise with these techniques and potential concerns about the radiation dose.
Magnetoencephalography
Magnetoencephalography (MEG) is a noninvasive technique that records magnetic fields produced by the electrical currents of neural activity in the brain. MEG signals arise from intracellular currents that flow from dendrites to the cell body.39 These magnetic signals are extremely weak, on the order of 10 to 1000 femtoTesla,40 requiring special sensors for detection. These magnetic fields induce electrical current in an array of special coils coupled to a superconducting quantum interference device.40 Modern-day MEG machines typically have a few hundred sensor channels that surround the head (e-Fig. 28-6). Given the very weak magnetic fields generated by brain activity and the very high sensitivity of the superconducting quantum interference device sensors, MEG is very prone to interference from external magnetic sources, and thus siting in a highly shielded room is required to prevent electromagnetic contamination. MEG provides excellent temporal resolution (less than 1 ms), and compared with standard electroencephalography, it provides very good spatial resolution (down to 5 to 15 mm) in the detection of normal and abnormal brain waveforms. The most important clinical applications of MEG relate to evaluating epilepsy and presurgical functional mapping.
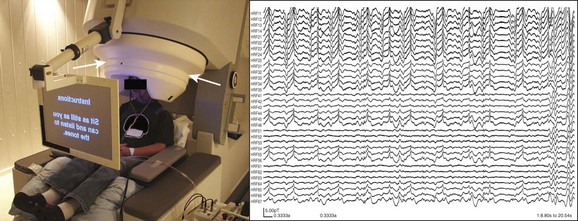
e-Figure 28-6 Magnetoencephalography (MEG).
The image on the left demonstrates a typical MEG machine (biomegnetometer) and patient setup for recordings and functional mapping. The patient’s head is situated within the helmet-like head element, which houses the multiple arrays of sensors around the head (arrows) within an insulated dewar. The image on the right demonstrates a small sample of representative MEG wave recordings from just 33 channels over the course of approximately 20 seconds. Typically, many more channels are recorded and the recordings are done for much longer periods, resulting in a tremendous amount of data to be analyzed for magnetic source imaging.
In a typical MEG examination, multiple sequential recordings are made via the various channels. The MEG waveform analysis results often are coregistered to a volumetric MRI of the head for source spatial localization of the abnormal waveforms or functional mappings. This combination of MEG with MRI is known as magnetic source imaging. For clinical purposes, when one uses the term MEG, it usually refers to magnetic source imaging with MRI coregistration. The registration of MEG and MRI typically is performed by using fiducial markers in predetermined regions, such as over the nasion and the right and left preauricular positions.41 The same fiducial markers can be used for determining patient motion and motion correction, which is important for clinical interpretation. After acquisition of the MEG waveform data, various complex mathematical models and algorithms are used for source localization, along with the ability to provide information from a “virtual depth electrode” in the brain.40,41
Magnetoencephalography in the Evaluation of Patients with Epilepsy
The major goal in the presurgical evaluation of patients with epilepsy is identification of the epileptogenic or ictal onset zones.42,43 It is hoped that surgical removal of this epileptogenic region will result in a seizure-free state (or at least a significant decrease in seizure frequency) with minimal postsurgical neurologic deficits. The excellent temporal and very good spatial resolution of MEG makes it a very useful tool in the evaluation of patients with epilepsy, especially those who are medically refractory. MEG evaluation typically is performed by passive interictal recording of spontaneous electromagnetic activity and discharges. Patients often are instructed to be sleep deprived overnight to increase interictal activity. In young children, typically 5 years or younger, or in patients with developmental delay or psychiatric issues, general anesthesia may be required to perform the MEG examination. The choice of anesthetic medication is important so as to avoid interference with the detection of epileptiform changes on MEG.41
1. When no structural lesion is found on MRI in a patient with epilepsy, MEG results occasionally may be used to guide a targeted “second look” at the MRI for possible detection of subtle abnormalities that initially may have been difficult to identify
2. Confirmation of localization based on other methods, allowing surgery to proceed without long-duration invasive intracranial electroencephalographic (EEG) monitoring
3. More accurate spatial localization of the epileptogenic zone to decrease the extent of craniotomy and grid placement for invasive EEG monitoring
4. In patients with multiple structural lesions on MRI, determination of whether one of the lesions is primarily responsible for the patient’s refractory seizures, indicating surgical feasibility
5. Determination of multiple epileptogenic zones, suggesting an unfavorable outcome or contraindication for surgery
6. Recurrence of epilepsy after surgery (Fig. 28-7)
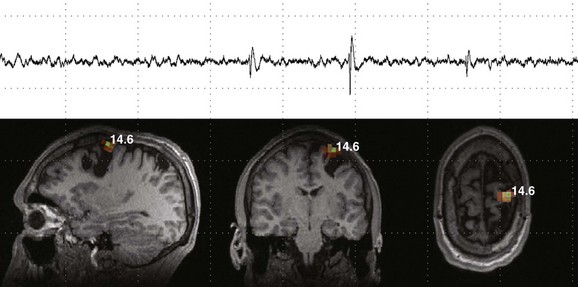
Figure 28-7 Magnetoencephalography (MEG) and magnetic source imaging in a patient with continued seizures even after epilepsy surgery.
The patient had undergone multiple cortical resections after an extensive epilepsy workup and invasive cortical mapping a few years earlier. However, although some improvement in the frequency of seizures occurred, the patient continued to have medically refractory epilepsy. An interictal MEG shows multiple isolated spike and slow wave abnormalities during multiple recordings localized to a focus along the superomedial aspect of the site of surgical resection.
7. Investigation of discrepancy between EEG and neuroimaging findings
8. Investigation of inconclusive EEG results
9. Delineation of eloquent cortex to aid presurgical decision making
Careful visual scrutiny of the source MEG waves is necessary to help determine the presence or absence of significant epileptiform activity or artifacts. Various automated software waveform analyses and statistical tests can be performed to determine the significance of the waveforms detected on MEG. One such measure is determining kurtosis, or “spikiness” of the waves, which can help in identifying areas of significant activity. The addition of MEG to the evaluation of patients with epilepsy has been shown to improve the quality of medical care and surgical outcomes after epilepsy and provides important nonredundant information in a significant proportion of patients.42–45
Brain Functional Mapping Using Magnetoencephalography
The gold standard for functional mapping of eloquent cortex is intraoperative direct cortical stimulation and mapping. Noninvasive examinations such as functional MRI (fMRI) often are used for preoperative localization and mapping before resection of tumors, vascular malformations, and epileptogenic foci. The blood oxygenation level dependent response used in fMRI localization is a measurement of the hemodynamic response to neuronal activity rather than direct measurement of the neuronal activity (see Chapter 27). Many pathophysiologic processes are known to adversely affect and/or blunt the hemodynamic response measured with fMRI, such as arteriovenous malformations or some tumors. MEG can be used as another noninvasive method for functional identification of eloquent cortical regions.46–48 Motor, somatosensory, and language areas typically are examined by MEG in the clinical setting. Auditory and visual centers also occasionally are investigated. Similar to fMRI, MEG recordings are used to evaluate responses to task performance and/or evoked stimulation.
After the functional mapping tasks and stimulations are performed, areas of target activity or statistically significant ERD are overlaid on volumetric MRI to visualize the functional areas mapped by MEG (e-Fig. 28-8). In small children and in patients who are anesthetized, it generally is not feasible to perform motor and language mapping. Somatosensory mapping only via median or tibial nerve stimulation may be a viable choice. The functional mappings performed by means of MEG are used in determining the feasibility and risks of surgery and occasionally in planning the surgical approach to lesions.
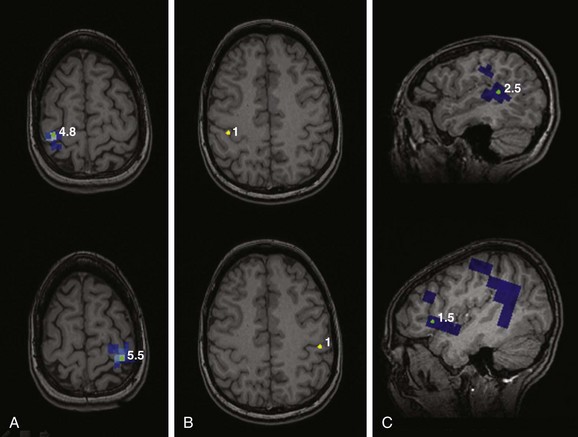
e-Figure 28-8 Presurgical functional motor, somatosensory, and language mapping using magnetoencephalography.
Motor mapping (A) of the left and right index fingers by simple finger tapping mapped to the right and left precentral gyri, respectively. Somatosensory mapping (B) using stimulation of the fingers by a puff of air shows mapping to the banks of the contralateral postcentral gyri. Language mapping was performed using various tasks that predominantly localized to the posterior aspect of the left superior temporal gyrus and anterior opercular region of the lateral left frontal lobe (C).
Chuang, NA, Otsubo, H, Pang, EW, et al. Pediatric magnetoencephalography and magnetic source imaging. Neuroimaging Clin N Am. 2006;16:193–210.
Schwartz, ES, Dlugos, DJ, Storm, PB, et al. Magnetoencephalography for pediatric epilepsy: how we do it. AJNR Am J Neuroradiol. 2008;29:832–837.
Wintermark, M, Sesay, M, Barbier, E, et al. Comparative overview of brain perfusion imaging techniques. Stroke. 2005;36:e83–e99.
Wolf, RL, Detre, JA. Clinical neuroimaging using arterial spin-labeled perfusion magnetic resonance imaging. Neurotherapeutics. 2007;4:346–359.
Zaharchuk, G. Theoretical basis of hemodynamic MR imaging techniques to measure cerebral blood volume, cerebral blood flow, and permeability. AJNR Am J Neuroradiol. 2007;28:1850–1858.
References
1. Wintermark, M, Sesay, M, Barbier, E, et al. Comparative overview of brain perfusion imaging techniques. Stroke. 2005;36:e83–e99.
2. Zaharchuk, G. Theoretical basis of hemodynamic MR imaging techniques to measure cerebral blood volume, cerebral blood flow, and permeability. AJNR Am J Neuroradiol. 2007;28:1850–1858.
3. Rosen, BR, Belliveau, JW, Vevea, JM, et al. Perfusion imaging with NMR contrast agents. Magn Reson Med. 1990;14:249–265.
4. Belliveau, JW, Rosen, BR, Kantor, HL, et al. Functional cerebral imaging by susceptibility-contrast NMR. Magn Reson Med. 1990;14:538–546.
5. Rosen, BR, Belliveau, JW, Aronen, HJ, et al. Susceptibility contrast imaging of cerebral blood volume: human experience. Magn Reson Med. 1991;22:293–299. [discussion 300-303].
6. Paulson, ES, Schmainda, KM. Comparison of dynamic susceptibility-weighted contrast-enhanced MR methods: recommendations for measuring relative cerebral blood volume in brain tumors. Radiology. 2008;249:601–613.
7. Boxerman, JL, Bandettini, PA, Kwong, KK, et al. The intravascular contribution to fMRI signal change: Monte Carlo modeling and diffusion-weighted studies in vivo. Magn Reson Med. 1995;34:4–10.
8. Schmainda, KM, Rand, SD, Joseph, AM, et al. Characterization of a first-pass gradient-echo spin-echo method to predict brain tumor grade and angiogenesis. AJNR Am J Neuroradiol. 2004;25:1524–1532.
9. Donahue, KM, Krouwer, HG, Rand, SD, et al. Utility of simultaneously acquired gradient-echo and spin-echo cerebral blood volume and morphology maps in brain tumor patients. Magn Reson Med. 2000;43:845–853.
10. Calamante, F, Willats, L, Gadian, DG, et al. Bolus delay and dispersion in perfusion MRI: implications for tissue predictor models in stroke. Magn Reson Med. 2006;55:1180–1185.
11. Calamante, F. Perfusion MRI using dynamic-susceptibility contrast MRI: quantification issues in patient studies. Top Magn Reson Imaging. 2010;21:75–85.
12. Sugahara, T, Korogi, Y, Kochi, M, et al. Perfusion-sensitive MR imaging of gliomas: comparison between gradient-echo and spin-echo echo-planar imaging techniques. AJNR Am J Neuroradiol. 2001;22:1306–1315.
13. Wu, O, Ostergaard, L, Koroshetz, WJ, et al. Effects of tracer arrival time on flow estimates in MR perfusion-weighted imaging. Magn Reson Med. 2003;50:856–864.
14. Wu, O, Ostergaard, L, Sorensen, AG. Technical aspects of perfusion-weighted imaging. Neuroimaging Clin N Am. 2005;15:623–637. [xi].
15. Grandin, CB. Assessment of brain perfusion with MRI: methodology and application to acute stroke. Neuroradiology. 2003;45:755–766.
16. Toth, G, Albers, GW. Use of MRI to estimate the therapeutic window in acute stroke: is perfusion-weighted imaging/diffusion-weighted imaging mismatch an EPITHET for salvageable ischemic brain tissue? Stroke. 2009;40:333–335.
17. Law, M, Yang, S, Wang, H, et al. Glioma grading: sensitivity, specificity, and predictive values of perfusion MR imaging and proton MR spectroscopic imaging compared with conventional MR imaging. AJNR Am J Neuroradiol. 2003;24:1989–1998.
18. Law, M, Hamburger, M, Johnson, G, et al. Differentiating surgical from non-surgical lesions using perfusion MR imaging and proton MR spectroscopic imaging. Technol Cancer Res Treat. 2004;3:557–565.
19. Vossough, A, Nabavizadeh, SA. Functional imaging based diagnostic strategy: intra-axial brain masses. In: Faro S, Mohamed FB, eds. Functional neuroradiology: principles and clinical applications. Berlin: Springer, 2011.
20. Law, M, Cha, S, Knopp, EA, et al. High-grade gliomas and solitary metastases: differentiation by using perfusion and proton spectroscopic MR imaging. Radiology. 2002;222:715–721.
21. Cha, S. Dynamic susceptibility-weighted contrast-enhanced perfusion MR imaging in pediatric patients. Neuroimaging Clin N Am. 2006;16:137–147. [ix].
22. Barajas, RF, Jr., Chang, JS, Segal, MR, et al. Differentiation of recurrent glioblastoma multiforme from radiation necrosis after external beam radiation therapy with dynamic susceptibility-weighted contrast-enhanced perfusion MR imaging. Radiology. 2009;253:486–496.
23. Essock-Burns, E, Lupo, JM, Cha, S, et al. Assessment of perfusion MRI-derived parameters in evaluating and predicting response to antiangiogenic therapy in patients with newly diagnosed glioblastoma. Neuro Oncol. 2011;13:119–131.
24. Williams, DS, Detre, JA, Leigh, JS, et al. Magnetic resonance imaging of perfusion using spin inversion of arterial water. Proc Natl Acad Sci U S A. 1992;89:212–216.
25. Deibler, AR, Pollock, JM, Kraft, RA, et al. Arterial spin-labeling in routine clinical practice, part 1: technique and artifacts. AJNR Am J Neuroradiol. 2008;29:1228–1234.
26. Deibler, AR, Pollock, JM, Kraft, RA, et al. Arterial spin-labeling in routine clinical practice, part 3: hyperperfusion patterns. AJNR Am J Neuroradiol. 2008;29:1428–1435.
27. Wang, J, Licht, DJ, Jahng, GH, et al. Pediatric perfusion imaging using pulsed arterial spin labeling. J Magn Reson Imaging. 2003;18:404–413.
28. Detre, JA, Alsop, DC. Perfusion magnetic resonance imaging with continuous arterial spin labeling: methods and clinical applications in the central nervous system. Eur J Radiol. 1999;30:115–124.
29. Wolf, RL, Detre, JA. Clinical neuroimaging using arterial spin-labeled perfusion magnetic resonance imaging. Neurotherapeutics. 2007;4:346–359.
30. Wang, J, Licht, DJ. Pediatric perfusion MR imaging using arterial spin labeling. Neuroimaging Clin N Am. 2006;16:149–167. [ix].
31. Chen, J, Licht, DJ, Smith, SE, et al. Arterial spin labeling perfusion MRI in pediatric arterial ischemic stroke: initial experiences. J Magn Reson Imaging. 2009;29:282–290.
32. Deibler, AR, Pollock, JM, Kraft, RA, et al. Arterial spin-labeling in routine clinical practice, part 2: hypoperfusion patterns. AJNR Am J Neuroradiol. 2008;29:1235–1241.
33. Shetty, SK, Lev, MH. CT perfusion in acute stroke. Neuroimaging Clin N Am. 2005;15:481–501. [ix].
34. Allmendinger, AM, Tang, ER, Lui, YW, et al. Imaging of stroke: part 1, perfusion CT—overview of imaging technique, interpretation pearls, and common pitfalls. AJR Am J Roentgenol. 2012;198:52–62.
35. Wintermark, M, Maeder, P, Verdun, FR, et al. Using 80 kVp versus 120 kVp in perfusion CT measurement of regional cerebral blood flow. AJNR Am J Neuroradiol. 2000;21:1881–1884.
36. Wintermark, M. Brain perfusion-CT in acute stroke patients. Eur Radiol. 2005;15(suppl 4):D28–D31.
37. Gupta, R, Jovin, TG, Yonas, H. Xenon CT cerebral blood flow in acute stroke. Neuroimaging Clin N Am. 2005;15:531–542. [x].
38. Nemoto, EM, Yonas, H, Kuwabara, H, et al. Differentiating hemodynamic compromise by the OEF response to acetazolamide in occlusive vascular disease. Adv Exp Med Biol. 2005;566:135–141.
39. Okada, YC, Wu, J, Kyuhou, S. Genesis of MEG signals in a mammalian CNS structure. Electroencephalogr Clin Neurophysiol. 1997;103:474–485.
40. Schwartz, ES, Edgar, JC, Gaetz, WC, et al. Magnetoencephalography. Pediatr Radiol. 2010;40:50–58.
41. Schwartz, ES, Dlugos, DJ, Storm, PB, et al. Magnetoencephalography for pediatric epilepsy: how we do it. AJNR Am J Neuroradiol. 2008;29:832–837.
42. Grondin, R, Chuang, S, Otsubo, H, et al. The role of magnetoencephalography in pediatric epilepsy surgery. Childs Nerv Syst. 2006;22:779–785.
43. Chuang, NA, Otsubo, H, Pang, EW, et al. Pediatric magnetoencephalography and magnetic source imaging. Neuroimaging Clin N Am. 2006;16:193–210.
44. Otsubo, H, Snead, OC, 3rd. Magnetoencephalography and magnetic source imaging in children. J Child Neurol. 2001;16:227–235.
45. Stufflebeam, SM, Tanaka, N, Ahlfors, SP. Clinical applications of magnetoencephalography. Hum Brain Mapp. 2009;30:1813–1823.
46. Gaetz, W, Cheyne, D, Rutka, JT, et al. Presurgical localization of primary motor cortex in pediatric patients with brain lesions by the use of spatially filtered magnetoencephalography. Neurosurgery. 2009;64:177–185. [discussion 186].
47. Merrifield, WS, Simos, PG, Papanicolaou, AC, et al. Hemispheric language dominance in magnetoencephalography: sensitivity, specificity, and data reduction techniques. Epilepsy Behav. 2007;10:120–128.
48. Gaetz, WC, Cheyne, DO. Localization of human somatosensory cortex using spatially filtered magnetoencephalography. Neurosci Lett. 2003;340:161–164.