[level-membership-for-pulmolory-and-respiratory-category]Chapter 8
Pediatric Pulmonary Function Testing
1. State how the combined American Thoracic Society-European Respiratory Society (ATS-ERS) task force guidelines relate to pulmonary function testing and, specifically, spirometry in children.
2. Suggest techniques for approaching young children, gaining their confidence, and ensuring maximal effort.
3. Identify common technique and/or effort-related errors during FVC maneuvers and the resultant effect on reliability of testing.
4. Discuss the potential importance of examining both the expiratory and inspiratory loops during spirometry.
5. State the most common pharmaceutical agent used for bronchoprovocation testing and the steps involved in performing this challenge in children.
6. State limitations and considerations for equipment as they relate to testing in children for the measurement of lung volumes and diffusion capacity.
7. State the physiologic and testing effects that sedation may produce in infants.
8. Identify various passive techniques to evaluate pulmonary function in infants, toddlers, and preschool children.
9. State the components of lung volume measurements that can be obtained in well-sedated infants and the equipment necessary to make those measurements.
10. State considerations that are important when establishing a normative or reference set for pediatric patients.
1. According to ATS-ERS recommendations, state the difference in a usable versus an acceptable FVC maneuver in a young child.
2. Discuss a scenario when the FEV0.5 may be a valuable parameter evaluating bronchodilator response during spirometry in very young children.
3. Explain the limitations of the FEF25%-75% in a very young child performing spirometry.
4. Compare the appearance of the flow-volume loop in variable intrathoracic versus extrathoracic obstruction and fixed patterns of obstruction, and provide examples of pediatric disorders associated with each.
5. State the difference between direct and indirect methods of bronchoprovocation, and give examples of each.
6. Discuss problems associated with the delivery of pharmaceutical agents in pediatric patients, and state advantages and disadvantages of each.
7. Discuss how exercise stress testing protocols can be of benefit in evaluating both airway hyperresponsiveness and pediatric cardiovascular problems.
8. Explain the purpose of the eucapnic voluntary hyperventilation (EVH) challenge.
9. Discuss the added benefit of performing lung volume measurements in pediatric patients to differentiate obstructive and restrictive components of disease.
10. Identify potential problems in obtaining diffusion capacity measurements in children and relate the effect of potential errors to resultant data.
11. Discuss the role of passive mechanics in evaluating infants and toddlers.
12. Compare and contrast an adult plethysmograph to an infant plethysmograph.
13. State the purpose of performing the raised volume technique when measuring lung volumes in infants.
14. Define the components that comprise respiratory impedance (Z), and state how airway reactivity can be evaluated using these measurements.
15. Explain why the use of the 95% confidence interval and/or Z score are superior methods of evaluating pediatric patient data rather than using standard percent predicted reference values.
Spirometry
Spirometry, by far, is the most common type of pulmonary function test performed in the pediatric population. Understanding how to teach children to perform this test well will help ensure that the physician will use and interpret this tool to treat his or her patient. The basics of spirometry apply to both pediatrics and adults (see Chapter 2). The same principles for testing and equipment are used. The indications for testing are similar, although disease processes in pediatrics often differ. The anatomy and physiology of the respiratory system change significantly from the infant to the young child and to the older adolescent. As for adults, the primary goals of spirometry are the following:
1. To identify the presence of an obstructive defect or a restrictive pattern of flow
Age Considerations for Children Performing Spirometry
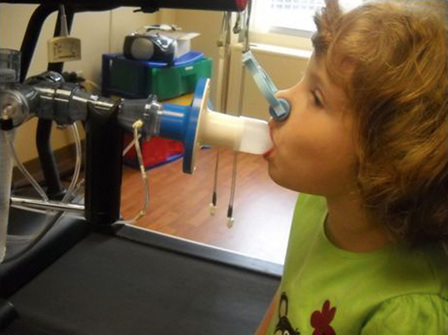
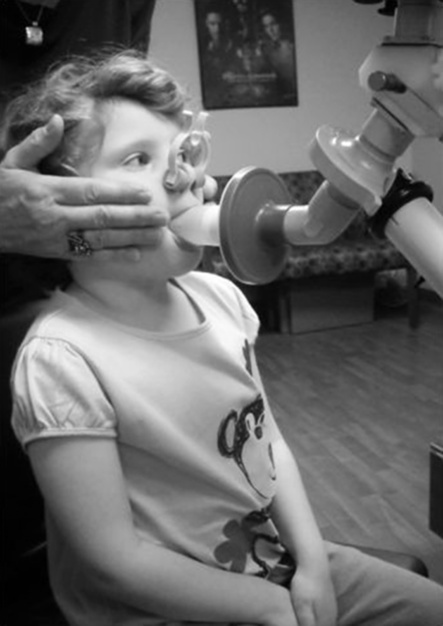
Age considerations are a common concern that cannot be addressed until spirometry is attempted. Children as young as 3 years have the potential to perform the maneuver but with limitations. It has been suggested that at least 50% of children this age can perform pulmonary function tests (PFTs). Published data from several sources suggest that preschool children can perform technically repeatable forced vital capacity (FVC) maneuvers within 10%. Introducing spirometry to children at a young age often yields remarkable results within only a few training sessions. Figure 8-1 is a 5-year-old child performing spirometry for the first time. Note the child is standing, with noseclips in place, and mouthpiece fully in mouth.
1. Identify premature termination of the maneuver by comparing the flow at termination to that of peak flow. If cessation of flow occurs at greater than 10% of peak flow, the vital capacity and forced expiratory flows should not be reported. FEV0.5 or FEV1 may still be reportable. Because vital capacity may be completely exhaled by 1 second, examining exhaled volumes closer to peak flow (e.g., FEV0.5) may provide more accurate information regarding intrathoracic airflow obstruction.
2. As with current recommendations, the highest FVC and FEV1 (or FEV0.5) should be reported and the selection of “best” curve, based on the sum of FVC and FEV0.5.
3. Additionally, a close look at extrapolated volume is recommended. Because children have smaller lung volume, extrapolated volume during spirometry may exceed the 5% (or 50 mL) criteria currently stated in ATS-ERS guidelines. In very young children, an expiratory curve with an extrapolated volume as high as 80 mL or 12.5% (whichever is greater) may be acceptable and should be reexamined.
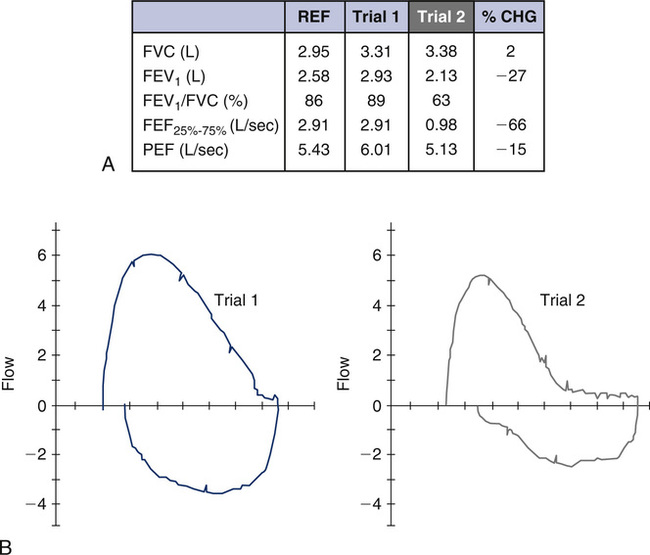
On average, by age 5 years, most children can perform spirometry with adequate technique and repeatability. Published guidelines from the ATS-ERS task force offer more realistic expectations for young children. There is not an age that all children, without exception, can perform technically acceptable spirometry. The ATS-ERS guidelines suggest that certain flow-volume curves may be “usable,” if not technically acceptable. Consider Figure 8-2, A. This is the first experience for this 5-year-old child in the pulmonary lab. On multiple attempts, her FEV1 was repeatable with the best curve, as shown. Note, however, that exhalation is incomplete and expiratory time is very short (slightly over 1 second). Therefore, the FVC values are underestimated and the FEV1/FVC is inaccurate. The curves, however, meet criteria for satisfactory start of test and are free of artifact for at least the first second. These classify as usable flow-volume loops, although not technically perfect.
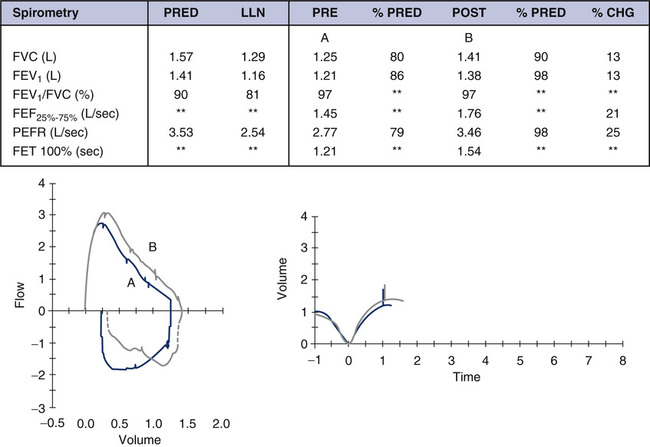
As long as the patient blows for at least 1 second and that first second is free of artifact, the F-V loop and values may be used for interpretation. Caution is suggested in interpreting the FEV1/FVC or any parameter, based on a full expiratory maneuver. It is certainly understood that this may not represent the child’s maximal effort; however, identifying that this young child’s FEV1 is repeatable and within the normal range for her age is valuable information for the pulmonologist. The shape of the postbronchodilator flow-volume loop in Figure 8-2, B, is similar to the one in Figure 8-2, A, but larger. There is a proportional increase in both FVC and FEV1, which suggests the child took a deeper breath before performing the FVC maneuver. Learning effect can be seen even during the first session of working with a young child and should definitely be considered when interpreting this study. Although a bronchodilator response should not be ruled out, it is likely that learning effect was responsible for most of the improvement. It should be emphasized that spirometry is an effort-dependent test that requires cooperation and attention from the child. Equally important is the experience and patience of a well-trained pulmonary function technologist. Children who are mentally delayed or not capable of following directions may not perform adequate spirometry at any age, regardless of the coach or technologist. Patients who are not feeling well or having chest pain, for example, may follow instructions but not perform maximally.
Ensuring Maximal Effort on the Part of the Child
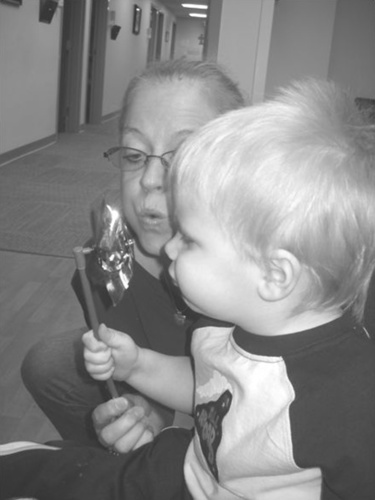
First, gain the child’s confidence and do not rush into testing. Children are fearful that the testing will hurt. When possible, reassure the child by carrying on a conversation that is directed toward the child. As illustrated in Figure 8-3, try some “blowing” games with the very young child before approaching the PFT equipment. Use of a pinwheel is often very successful. It teaches the child the need to take a big breath and blow fast. Additionally, have the child try to continue to blow until the pinwheel stops turning. This important step reinforces a complete exhalation. Demonstrate the test and reassure the child that it is easy and fun. Pinwheels also make an excellent and inexpensive prize for the patient when testing is over. If a pinwheel is unavailable, the use of a tissue will substitute, although it is a bit harder. Demonstrate blowing the tissue as high, and keeping the tissue suspended for as long, as possible.
Once the child has practiced several times, move the child to the PFT machine and prepare for testing. When possible, the child should be standing and the technologist should be at eye level with the child. See Box 8-1 for a list of suggestions that will “break the ice” and get things going in a positive direction. The use of noseclips is recommended, depending on the age and cooperation of the child. The anatomy of the nasopharyngeal structures in younger children is such that the use of noseclips may not be necessary. If the child is willing to wear noseclips, encourage him or her to do so.
Importance of Effort
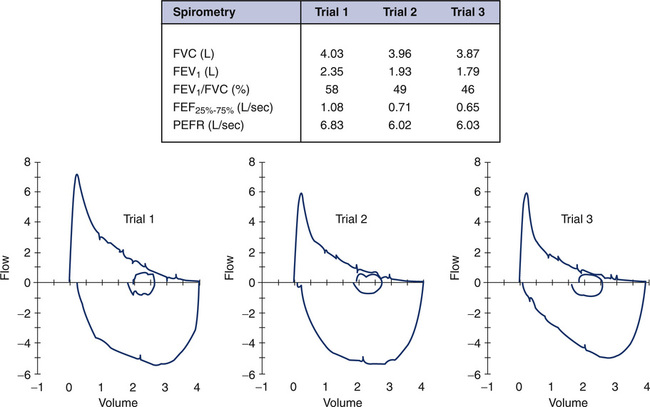
One of the biggest challenges with children is ensuring a maximal breath in before the forced expiration. The concept is simple: The more air in, the more air out. The technologist should strive to get the child to breathe in as deeply as possible and observe the child’s chest excursion. Movement of the shoulders upward without chest excursion is common and can fool the technologist into believing it is a maximal inspiratory capacity. This may also be a pitfall when comparing prebronchodilator and postbronchodilator spirometry. Figure 8-4 is also from a 5-year-old patient performing spirometry for the first time. The prebronchodilator spirometry (see Figure 8-4, A) appears to be normal and was repeatable. Postbronchodilators, both FVC and FEV1, improve significantly (see Figure 8-4). The increase in FVC and FEV1 is very symmetric, similar to the last example presented (see Figure 8-2, A). Learning effect cannot be ruled out. However, the shape of the F-V curve is very different with postbronchodilator spirometry. This is an example of a situation where the change in FEV0.5 might be more helpful in assessing intrathoracic airflow obstruction than the change in FEV1
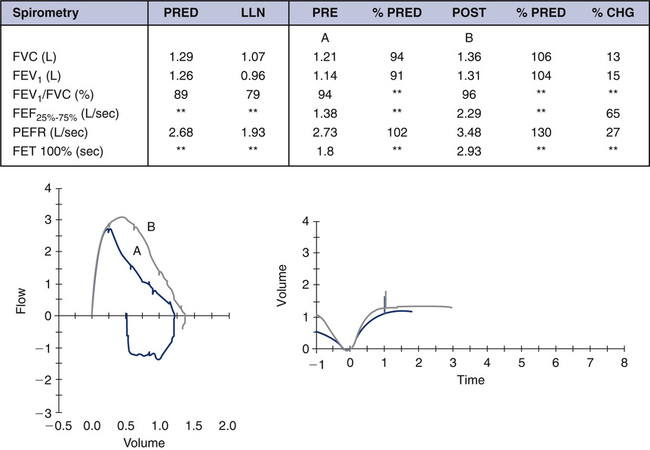
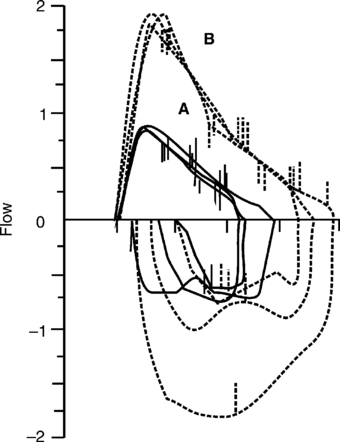
The child is at a low lung volume when 1 second is reached (close to FVC) and the FEV1 is not reflective of airflow changes that are occurring at mid-lung volumes. It is critically important to realize that all of the “action” has already taken place by the time 1 second has elapsed. Parameters such as FEV0.5 or FEV0.75 should be assessed in these young children, although standards and guidelines for interpretation are not available. Contrast Figure 8-4 with Figure 8-5, A and B. In this example of a 7-year-old child, both FVC and FEV1 increase with postbronchodilator spirometry; however, the increase in FEV1 is proportionately higher, which also increases the FEV1/FVC ratio. Although learning may have some effect in this example, it is evident that mild intrathoracic airflow obstruction is completely reversed. Once a child has learned the technique and is capable of performing spirometry, the results are remarkably repeatable. The ATS-ERS guidelines now base repeatability of FVC and FEV1 on lung volume. Because younger children have smaller lung volumes than adults, these revised guidelines pertain to the pediatric population as well as to older patients with severe lung disease.
Once a maximal inspiration is accomplished, most young children do not have difficulty blowing out forcefully. As for adult spirometry, the technologist should minimize hesitation before the forced maneuver that may create a “time zero” or back-extrapolated volume error. Do not encourage a breath hold. Delayed exhalation can result in a poor peak flow measurement and falsely raise the FEV1. Figure 8-6 demonstrates this volume extrapolation or time zero error.
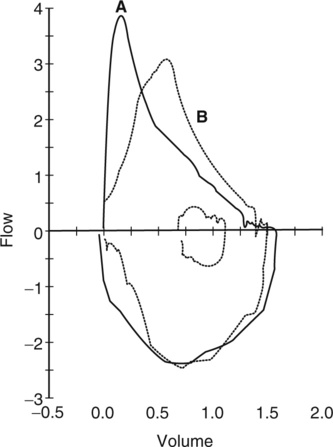
Figure 8-6, A, is an acceptable FVC maneuver. Note how the delayed exhalation in Figure 8-6, B, can skew the curve to the right and falsely elevate timed parameters. Young children have a desire to please and, unless they are feeling unwell, will usually respond to the direction to “blast or burst the air out.”
Length of Exhalation for a Child During an FVC Maneuver
Because children have lung volumes that are significantly smaller than adult lung volumes, their lungs may completely empty in only 2 or 3 seconds. When a child feels empty, the natural instinct is take a breath back in. With instruction, practice, and maturing, the child can learn to continue the expiration; however, this may not be possible on the first several visits to the lab. This does not invalidate the FVC maneuvers but requires that the testing be evaluated carefully. Figure 8-7, A, represents three prebronchodilator flow-volume (F-V) loops superimposed over each other. Although this young child does not meet the end-of-test criteria, the FEV1 and shape of the F-V loop are remarkably repeatable. Postbronchodilator (see Figure 8-7, B) F-V loops are significantly improved and repeatable. The current ATS-ERS guidelines more realistically represent what can be expected of a younger child.
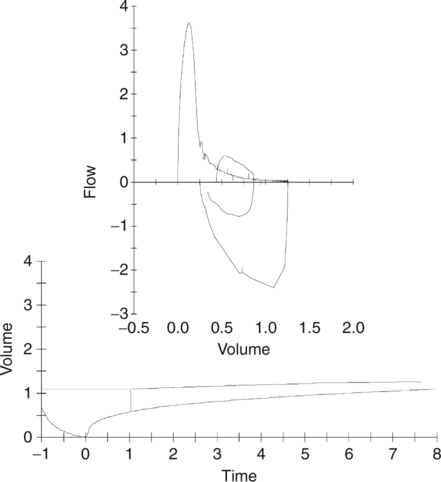
Children who are severely obstructed, like their adult counterparts, may have the ability to exhale for an extended time. Figure 8-8 shows the F-V loop and volume-time tracing of a 10-year-old girl with cystic fibrosis. This child is able to sustain expiration for 15 seconds. However, the additional volume measured in this prolonged expiration is small and may exhaust the child performing the test. She approaches a flow plateau at approximately 7–8 seconds, and the maneuver can be terminated at this point. The spirometry is certainly still valid for interpretation if terminated before zero flow occurs. Many decisions regarding acceptability of PFT results require good judgment from the technologist and careful interpretation from the physician.
Reliability of FEF25%–75% in Children
Historically, FEF25%–75% has been used to evaluate flow from the “small airways”. More precisely, the FEF25%–75% should be considered a measurement of flow at lower lung volumes, not merely flow from medium-sized and smaller airways. As in adults, the variability of the FEF25%–75% is greater than that of the FVC and FEV1. Because children may be even less repeatable at baseline, the reliability of this measurement in pediatric testing may be questionable. In addition, if the child does not fully exhale to RV, FEF25%–75% may be artificially elevated because of reduced vital capacity. If it is reported, the FEF25%–75% in a pediatric subject should be interpreted with caution, especially in a very young child. A substantially greater change postbronchodilator is needed before a change can be considered significant. Refer back to Figure 8-4, A and B. Although the exhalation times do not meet the revised 3-second guideline for a child younger than age 10 years, it does appear that this patient exhaled to a volume plateau. The change in shape of the F-V loop, as well as the change in FEF25%–75% of 65%, is certainly suggestive of a reversal of intrathoracic airflow obstruction. An FEF25%–75% that improves by more than 35%–45% after a bronchodilator may be indicative of airway reactivity, but again caution is advised when considering this parameter. Repeatability of the FEF25%–75% is more reliable in older children and teenagers. As previously noted, FEF25%–75% can be reduced for several reasons that are not always related to peripheral airway disease. Refer to Figure 8-9. This F-V loop is from a 17-year-old patient who had tracheal stenosis after a prolonged intubation as a young child. The FEF25%–75% of this curve is severely reduced, as is the FEV1. The reduction is not caused by peripheral airway obstruction but by a large central (tracheal) airway obstruction.
Parameters of Inspiratory Forced Flow Helpful in Pediatrics
Spirometry yields a variety of expiratory and inspiratory flows, including FEF25%, FEF50%, FEF75%, FEF85%, FIF50%, and the FEF50%/FIF50% ratio. Each of these parameters relates to flow at a particular lung volume and may have some benefit for particular instances. These flows, like the FEF25%–75%, are less repeatable than the FEV1 and FVC and do not have any reference values. The FEF50%/FIF50% ratio may be helpful in identifying intrathoracic versus extrathoracic airflow obstruction (see Chapter 2). Unlike the expiratory limb of the F-V loop, the inspiratory limb has not been well characterized in pediatric subjects. There are several reasons for this; however, the most important are energy expenditure and effort dependence. Expiration from TLC is far more repeatable because of the elastic recoil of the lung. The FEF50% occurs in the portion of the expiratory limb that is considered effort independent. The inspiratory limb, conversely, is effort dependent and energy dependent for the entire maneuver. Therefore, optimal patient effort is vital for analyzing the inspiratory loop. A great deal of important information can be obtained from an appropriately performed maneuver. Too often, the inspiratory limb is ignored. When teaching children how to perform spirometry, certainly the emphasis is on expiration. Once it is mastered, attention should be paid to the inspiratory maneuver as well.
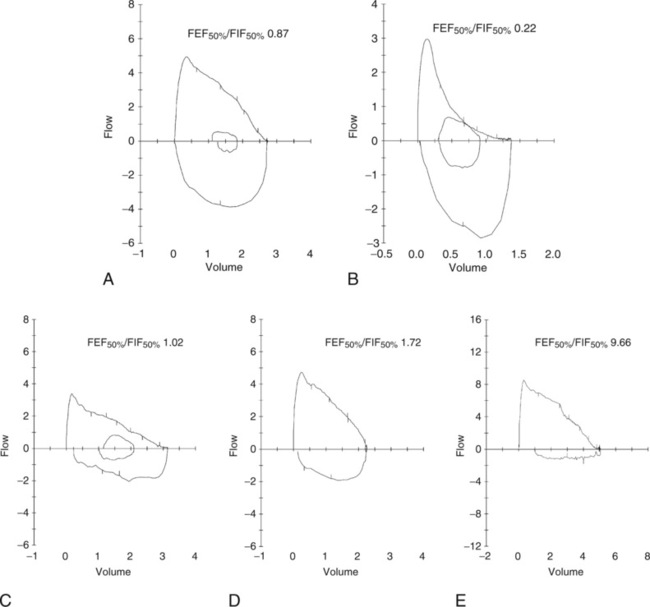
The aperture, or opening, through the vocal cords is approximately the same at both 50% of expiratory vital capacity and 50% of inspiratory vital capacity. Therefore, the FEF50%/FIF50% ratio should not be greater than 1.0. A ratio greater than 1.0 suggests an extrathoracic obstruction; however, this relationship has not been closely studied or reported in pediatric patients. Conversely, an FEF50%/FIF50% ratio of less than 1.0 may be normal or may represent significant intrathoracic obstruction. In addition, a ratio close to normal is possible if significant obstruction is seen on both inspiration and expiration (fixed obstruction), yielding a ratio of 1.0. Figure 8-9 demonstrates the effect of tracheal stenosis in a 17-year-old patient on the shape of the flow-volume loop, and the resulting FEF50%/FIF50% ratio. This underlies the importance of correlating the F-V loop with the child’s clinical picture and symptoms.
Figure 8-10 shows examples of F-V loops with differing FEF50%/FIF50% ratios and the shape of the loops represented by those ratios. Although FEF50%/FIF50% may not always discriminate between intrathoracic and extrathoracic airflow obstruction, the importance of extrathoracic obstruction should not be underestimated. Laryngeal webs, subglottic stenosis, tracheal malacia, and other lesions of the laryngeal-tracheal airway are important causes of upper airway obstruction in the pediatric population. In addition, the vocal cords represent a major “choke point” to airflow. The cords may have a structural abnormality, such as nodules or granulomas, or may become edematous, as in croup. The recurrent laryngeal nerve may be damaged, resulting in inappropriate movement or paralyzed cords. These conditions are generally easy to diagnose with direct visualization of the vocal cords. Vocal cord dysfunction (VCD) may also be responsible for poor abduction (opening) of the vocal cords during inspiration.
Role of Vocal Cord Dysfunction
Vocal cord dysfunction has become increasingly recognized as a reason for shortness of breath, in addition to throat and sternal chest pain, often mimicking asthma. Adolescents who are competitive athletes or are exceptionally goal oriented and children who have stress-related disorders are at highest risk. Unfortunately, vocal cord dysfunction is highly variable and may be detectable only when the patient is stressed in a manner that provokes the condition. The term vocal cord dysfunction (VCD) has sparked controversy among pediatric pulmonologists. Perhaps the term is not the most important consideration, but rather understanding that the vocal cords and larynx are very complex structures. There are likely many scenarios, some consciously controlled and others unconsciously controlled, that lead to the malfunction or inappropriate movement of the vocal cords. In very severe forms, “clipping,” or truncation, of the inspiratory loop with a completely normal expiratory loop is the classic presentation (see Figure 8-10, E). The child may or may not sound very stridorous during inspiration. The patient may try to speak while inspiring in short, gasping sentences. More common is a completely normal-appearing child with normal expiratory loops but highly variable inspiratory loops. Some inspiratory loops may be normal (FEF50%/FIF50%<1.0); however, many are often abnormal with an FEF50%/FIF50% greater than 1.0.
Vocal cord dysfunction is an example of a disorder in which the variability in the patient’s inspiratory loop is the hallmark of the dysfunction (Figure 8-11, A). These are the baseline loops from one patient, a 15-year-old teenager. Note how different all of the inspiratory loops look. Some have a triangular-shape appearance, some with the more classic flat, truncated appearance, and others have multiple inflection points. The inspiratory volume may be limited, giving a short, gasping type of inspiratory loop. A more normal inspiratory loop may appear among many abnormal loops (Figure 8-11, A, Trial 4). This is very important to capture when possible. It indicates that the child is capable of performing normal inspiratory loops, and the problem is likely more dynamic in nature, that is, a vocal cord malfunction. If there is a structural upper airway abnormality, the inspiratory loops should all look abnormal and very similar in shape. Structural obstructions are usually more fixed in nature with expiratory clipping also present. Refer again to an example of fixed airflow obstruction, as seen in Figure 8-10.
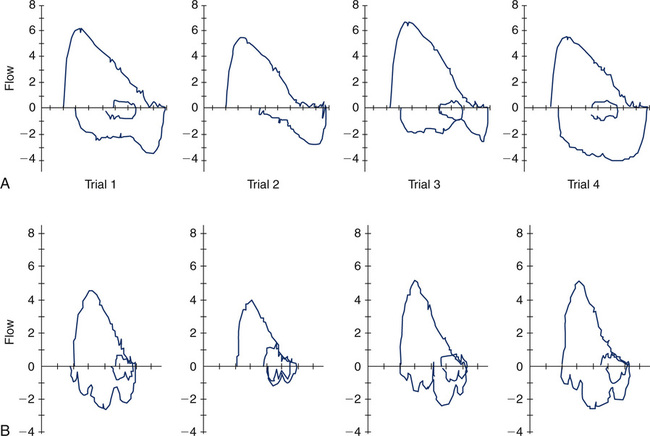
Under certain circumstances, very unusual inspiratory loops can be seen in multiple trials that are not effort- or technique-related. Consider Figure 8-11, B. These loops were obtained in a patient with excessive secretions and laryngospasm. Flow-volume loops are rarely diagnostic as a single test but certainly can suggest and support other diagnoses that are being considered.
VCD Combined with Intrathoracic Airflow Obstruction
To further complicate matters, vocal cord dysfunction is often seen in children with asthma. The relationship between these two disorders is not fully understood. There is certainly some similarity in symptoms, primarily shortness of breath, chest pain, and/or throat pain. However, some children who experience both asthma and vocal cord dysfunction can actually distinguish between the two disorders. Refer to Figure 8-12, A. These loops are from a known asthmatic child experiencing symptoms of shortness of breath and chest pain. The expiratory loops show very mild (if any) airflow obstruction. However, the inspiratory flow loops are variable and abnormal, as described in the earlier section. Vice versa, in Figure 8-12, B, note the characteristic “scoopy” appearance of severe expiratory airflow obstruction. This is accompanied by a normal appearing inspiratory loop. Note that the relationship of FEF50/FIF50 is skewed when the expiratory loop is not normal. The FEF50/FIF50 ratio discussed earlier is no longer valid in the face of intrathoracic obstruction. This ratio also does not hold true when the inspiratory loops are not complete, full loops or very irregular in shape.
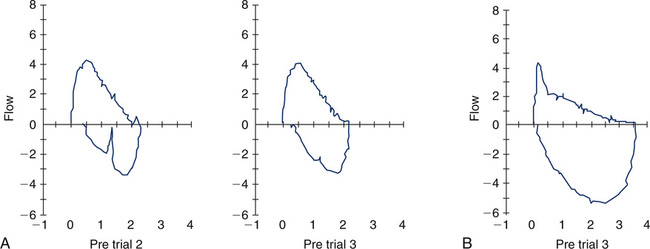
Non-Repeatability in the Expiratory Maneuver
The ATS-ERS recommendations emphasize the importance of repeatability of the FVC and FEV1. In some instances, patients cannot reproduce these parameters, and effort is not the reason. Figure 8-13 shows an example of such an instance. If only a single (best) F-V loop (Trial 1) were reported to the physician, the interpretation would state that this patient has mild to moderate intrathoracic airflow obstruction. However, the next two successive maneuvers performed by this 15-year-old asthmatic are also illustrated (Figure 8-11, A, Trials 2 and 3). These successive trials reveal progressively significant drops in FEV1 and FEV1/FVC, which are not repeatable with Trial 1. This pattern is an extremely important clue to the hyperreactivity of the patient’s airway. Simply performing repeated forced maneuvers may cause an asthmatic to become suddenly more obstructed and vulnerable to further bronchospasm. In such an instance, the technologist should stop testing the patient and administer a bronchodilator. If the patient’s report included only his or her best prebronchodilator and postbronchodilator spirometry, it would completely omit this important information and might prevent necessary changes in his or her asthma medication regimen.
Airway Malacia
For older children, airway malacia may produce some bizarre-shaped F-V curves. Refer to Figure 8-14. These F-V loops are from a 12-year-old child with a malaciac left main stem bronchus. Trial 1 represents a forced exhalation that is normal in shape. Trial 2 is from the same patient during the same testing session. Notice the rapid drop in flow rate, followed by a “flattening” or shelf-like appearance in the curve. Blowing harder caused critical compression at the malaciac segment and resulted in a sudden decrease in flow rate, or flow transient. Note the reduction in FEV1, as well as FEF25%–75%, from Trial 1 to Trial 2. This represents another example of the inadequacy of looking solely at one or two parameters instead of considering the entire picture. The shape of the curve in Trial 2 is characteristic of two lungs emptying at different time constants. One lung empties normally during forced exhalation, whereas the other lung takes considerably longer to empty because of the central intrathoracic obstruction present. Obtaining repeatable and acceptable F-V loops in the face of airway malacia can be challenging. Although not always successful, taking extra time with the child to try different breathing techniques or different mouthpieces may result in a more normal expiratory loop.
Bronchoprovocation challenges
Traditionally, methacholine chloride has been considered to be the “gold standard” for bronchoprovocation testing. If a conclusive answer is not obtained, the physician may then choose to rechallenge the patient with a stimulus that has a different mode of action. For example, a common complaint in adolescents is shortness of breath and chest pain with exercise. The specific question posed by the physician might be: Does this child have exercise-induced asthma? If symptoms present only while the child is exercising, the logical provocation study to perform first would be an exercise stress test. Most pediatric laboratories will admit, however, that only a small percentage of children exercised actually exhibit exercise-induced asthma. This type of provocation study is very specific but not very sensitive. Recall that exercise is an indirect method of provoking bronchospasm and may be influenced by the type of exercise performed (running vs. swimming vs. gymnastics, for example). The environment may contribute to the provocation. Is the child running outdoors during allergy season? Is the child swimming in a chlorinated indoor pool? Do the temperature of the air and humidity affect the response, such as cold ice rinks versus hot, humid football fields. It is not unusual for a child with intermittent or mild persistent asthma to test negative during an exercise challenge in a controlled laboratory environment. The next step might then be a methacholine challenge, a direct stimulus, which is less specific than exercise, but much more sensitive for eliciting bronchospasm. The child with a negative exercise challenge may well have a positive methacholine challenge, although likely positive in the mild or borderline range. Should the physician skip the exercise challenge and move directly to a methacholine challenge? This decision is up to the physician and is dependent on the question he or she is asking. There is neither a right or wrong answer nor a right or wrong challenge to perform. Recently, alternative provocation agents, such as EVH and mannitol, have been investigated. Specific protocols for each type of challenge should be established by the pulmonary laboratory and approved by the medical director. Whichever provocation agent is used, it is very important that the child be capable of performing serial spirometry at specific time intervals in a repeatable manner. Challenges can be time intensive. The child should be continually monitored for signs of fatigue or waning effort. Because children can become fatigued or easily distracted with prolonged testing, abbreviated protocols have been published. In some pediatric laboratories, challenges on very young children who cannot perform spirometry are obtained. Techniques for monitoring airway resistance and reactance, such as impulse oscillometry (IOS), have been successfully used in 3-year-old children and older who cannot perform spirometry adequately. See Figure 8-15 and the IOS discussion to follow later in the chapter. Laboratories that do not have this type of equipment can also perform challenges in the ages 3-5 range by closely monitoring breath sounds, oxygen saturation, respiratory rate, and symptoms. Physicians must be immediately available when challenging very young children. Challenges in pediatric patients are not recommended in any facility unfamiliar or inexperienced with children. A fully stocked emergency cart is also essential. Patient safety and well-being are always the number-one priority.
Inhalation Challenges
The most common type of inhalation challenge performed is the methacholine challenge. The child inhales methacholine chloride in succeedingly higher doses of medication. One popular dosing regimen involves a ten dose schedule beginning at a low dose (0.031 mg/mL), doubling each successive dose to a maximal dose of 16 mg/mL. A second recommended regimen with five levels of dosing starts at 0.0625 mg/mL and increases to 16 mg/mL. The drug can be administered either with a dosimeter that delivers a very specific dose with each breath or via the 2-minute tidal breathing method. Details of these two methods are discussed in Chapter 9 and both methods are generally considered to be equivocal. The 1999 ATS Guidelines provide specific recommendations for choosing the appropriate method, dosing regimens for methacholine chloride and modifications as necessary, and many other considerations for labs undertaking bronchoprovocation studies. As mentioned earlier, it is necessary to establish a consistent and repeatable spirometric flow-volume loop at baseline before the administration of the methacholine. Obtaining not only repeatable expiratory loops, but also maximal inspiratory loops, can be very helpful in considering possible vocal cord dysfunction. Serial spirometry is obtained at approximately 30-60 seconds after the administration of methacholine and again at 90 seconds. Because the half life of methacholine chloride is very short, further spirometry trials may not reflect the action of the methacholine. However, caution is advised if the child’s spirometry worsens with repeated blows, and a third trial of spirometry may be warranted. Additionally, if symptoms such as cough, wheezing, or shortness of breath begin during trials, bronchoconstriction may also be worsening, and this child should not be given an increased dose of methacholine until his or her spirometry stabilizes. A drop of 20% or more in the FEV1 is considered the stopping point for the challenge. Most often, the computer software is able to calculate the provocative concentration that would produce a fall in FEV1 of exactly 20% (PC20), Laboratories that use dosimeters often report the provocative dose (PD20), or the dose of methacholine that correlates with an exact drop of 20% in FEV1. Pediatric patients should always be given a bronchodilator, such as albuterol, to reverse any possible bronchospasm that has occurred from the administration of the methacholine. This is true even if the challenge is considered negative. The bronchodilator may produce a significant response in FEV1 above the child’s baseline spirometry, and that information may be relevant to the physician.
Pulmonary Exercise Stress Testing
The indication for a maximal cardiopulmonary exercise test is to evaluate how well the respiratory and cardiovascular systems work together. The clinical question asked is often whether the child has normal exercise tolerance. If not, is the child limited by the lungs (ventilator limitation), the heart (cardiovascular limitation), or both? Maximal tests are performed with a full 12-lead ECG, pulse oximetry, and a mouthpiece in place to measure ventilation, oxygen consumption, and carbon dioxide production (see Chapter 7 for a detailed discussion of indications, protocols, analysis, etc.). Use of an ergometer versus a treadmill may be a laboratory preference. Maximal oxygen consumption is usually slightly higher on a treadmill. The advantage of an ergometer, however, is that the child’s upper body is relatively still while the legs cycle. This decreases movement of the head and leaks around the mouthpiece. Pulse oximetry is often problematic during exercise because of movement of the arms and fingers. With cycle ergometry, however, less whole body motion produces less artifact. Alternatively, an oximeter probe placed above the eyebrow may yield more stable readings. The disadvantages of cycle ergometry in children are (1) modifying the equipment to fit the child, (2) keeping the child cycling consistently, and (3) obtaining true maximal oxygen consumption. Children may simply stop cycling when they feel fatigued. Unless a plateau in oxygen consumption ( o2) can be identified, the highest level reached is termed peak oxygen consumption.
Eucapnic Voluntary Hyperventilation
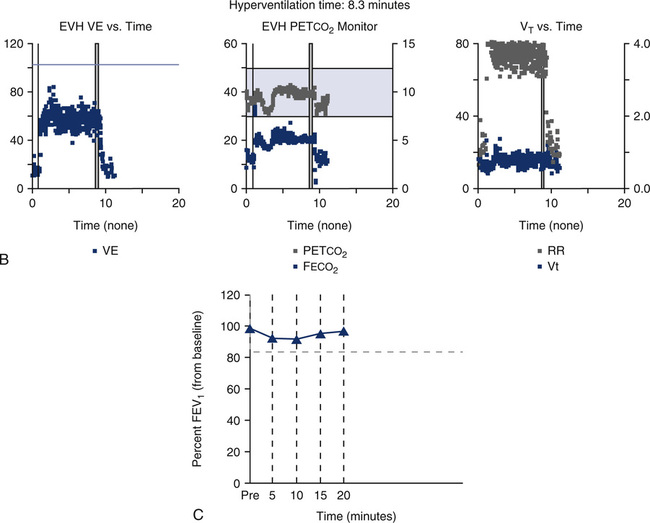
As discussed previously, one reason for performing an exercise stress test is to potentially provoke bronchospasm via temperature and humidity changes associated with rapid change of respiratory rate. An alternative method of induced hyperventilation can be accomplished voluntarily if carbon dioxide levels can be controlled during the rapid breathing. This procedure is known as eucapnic voluntary hyperventilation (EVH). Different setups are possible (see Chapter 9), but essentially the system must provide a high flow or reservoir of dry air and a means to control carbon dioxide in the normal physiologic range. Refer to Figure 8-16 as an example of a setup available to perform EVH challenges. For this particular setup, the subject breathes a dry mixture of air (or oxygen) and carbon dioxide, 95% O2/5% CO2, for example. The higher FIO2 may not be needed; however, it does safeguard against induced hypoxia during the challenge. Also, subfreezing cold air may be incorporated into an EVH setup, if desired. An end-tidal CO2 monitor is necessary to indirectly measure Paco2. The flow of gas from the tank’s flow meter, along with a “slow bleed” from a reservoir bag, can be used to titrate the flow needed by the patient during the challenge. Before the actual hyperventilation challenge, the patient performs baseline spirometry and usually a maximal voluntary ventilation (MVV) maneuver. During the hyperventilation phase of the challenge, the patient is asked to breathe rapidly to a target level (approximately 60%-70% of his MVV) for 6 minutes. Spirometry is then repeated every 3-5 minutes after the hyperventilation. Figure 8-17 depicts types of graphs that may be obtained during the hyperventilation phase, and the trending of FEV1 pre- and post-hyperventilation. This patient’s data and trending graph did not indicate any change in FEV1 after hyperventilation. The mechanism of potential induced bronchospasm is very similar to that provoked from exercise. The advantage of the EVH procedure is that it does not involve the time, equipment, and personnel needed to perform an exercise stress test. The disadvantage is that hyperventilation is voluntary, and the stimulus has an indirect effect. Asking a child to breathe at a rate and depth approaching his MVV for 6 minutes can be a challenge. EVH may be an attractive alternative for performing an exercise challenge on a child who cannot, or will not, exercise to a significant degree. However, many pulmonary labs perform EVH challenges only on motivated young adults or dedicated athletes who have negative exercise bronchoprovocation studies.
Lung volumes
Lung volume measurements in the pediatric population are extremely valuable and often reveal information not obtained from spirometry only. Not all children need lung volume determination. It is preferable that the child be comfortable performing spirometry before attempting lung volumes, but many children adapt easily to a new test situation. The choice of techniques for measuring lung volume is similar to that with adults. Lung volume determination through gas dilution techniques often underestimates lung volumes in patients with obstructive airway disease. This problem becomes even more relevant in the pediatric population because the size of the airway is smaller and easier to obstruct. Helium dilution or nitrogen washout may not be as well tolerated as body plethysmography. Problems with keeping a mouth seal and breathing a dry gas for several minutes make these techniques less desirable. Conversely, a child who performs even less than optimal spirometry may “jump” into the body box and attempt the maneuvers. Many commercial body plethysmographs require minimal effort in determining thoracic gas volume (VTG). Vigorous panting is no longer required to obtain VTG. With most systems, limited panting or only tidal breathing is necessary. Some commercial systems permit the technologist to adjust the timing and duration of the panting to minimize patient discomfort. Technical advances in body plethysmography, the ease and versatility of making measurements, and the accuracy of the measurement make this technique the preferred choice for lung volumes in pediatric patients. A detailed description of the functioning of a body plethysmograph is included in Chapter 4.
Important Plethysmographic Parameters
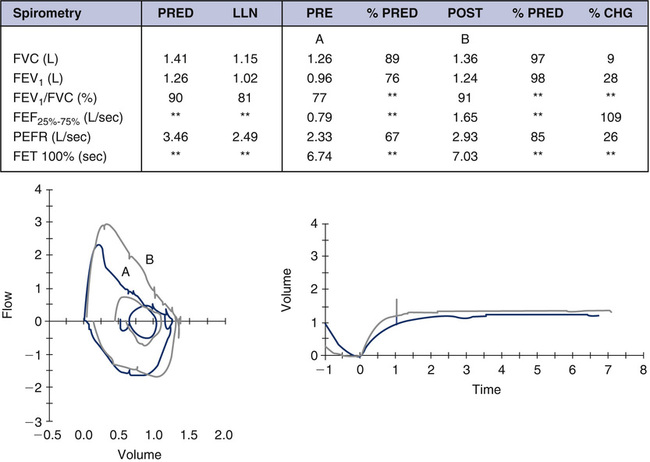
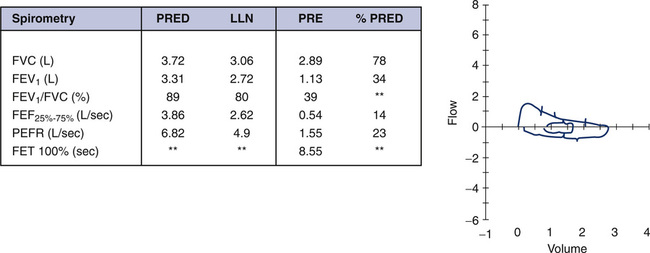
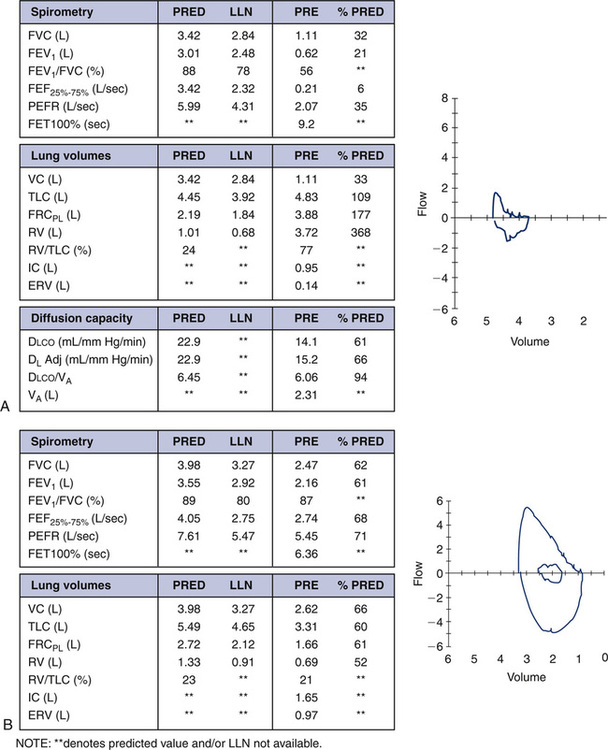
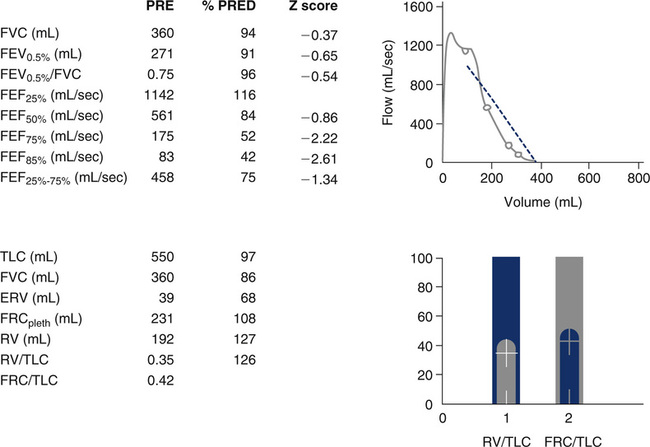
Although spirometry is the first test performed in many patients, spirometry alone may not accurately predict lung volumes in children. Figure 8-17 demonstrates case presentations of obstructive and restrictive lung disease, as well as a mixed presentation. Note that predicted values, as well as the lower limit of normal (LLN), are presented. In some reference sets, the LLN is not available and is indicated with asterisks (**).
The case in Figure 8-17, A, is a 15-year-old white boy with advanced cystic fibrosis. Severe obstruction is evident in the spirometry data. Both FEV1 and FEV1/FVC are reduced, consistent with an obstructive disorder. Lung volume measurements confirm the severity of obstruction and air trapping. Although the TLC is within normal limits, FRC, RV, and RV/TLC are significantly elevated. Compare these findings with the spirometry and lung volumes in Figure 8-17, B. This case is a 13-year-old white girl with scoliosis. Her pulmonary function results represent a restrictive defect. FVC and FEV1 are reduced in a symmetric pattern; however, the ratio is normal. Restrictive disorders often present with a normal or elevated FEV1/FVC. The lung volume measurements are also consistent with a pure restrictive defect, showing reduced volumes (TLC, FRC, RV, ERV) and a normal RV/TLC.
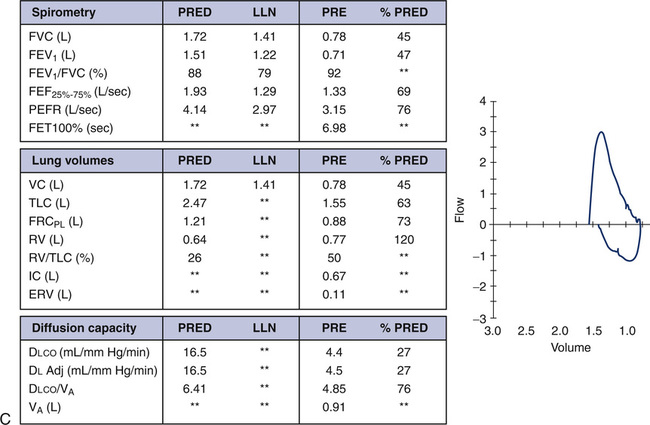
Many pediatric and adult diseases do not present as a purely obstructive or restrictive process but as a combination of obstruction and restriction. Refer to Figure 8-17, C. This 10-year-old African-American girl has systemic scleroderma. The FVC and FEV1 are severely reduced. Her flow-volume loop has a very restrictive appearance, with a disproportionately high peak flow and increased FEV1/FVC. A closer look at her lung volumes, however, reveals not only a moderate restrictive defect, but also an elevated RV and RV/TLC. Some elements of this pulmonary function study point to a restrictive component, whereas others are consistent with obstruction. This pattern is the hallmark of a mixed obstructive and restrictive disorder. Scleroderma is a generalized disease that can cause shrinkage of any of the connective tissues in the body. When the lungs are affected, the disease initially presents as a restrictive disorder, but severe end-stage disease results in a “honeycomb lung” with obstruction in distal airways and air trapping.
Are lung volumes necessary? The cases in Figure 8-17, A and B, are straightforward presentations in which spirometry alone is very representative of the child’s disease process. The lung volumes merely confirm the degree of airflow obstruction (see Figure 8-17, A) and lung restriction (see Figure 8-17, B). Mixed obstructive and restrictive disorders (Figure 8-17, C) definitely require lung volume determination to better define the child’s lung mechanics. It is not uncommon in the pediatric population to observe a seemingly restrictive spirometric pattern with a proportional reduction in percent predicted FVC and FEV1. However, subsequent lung volumes may identify a completely normal TLC, with an elevated RV/TLC. What appears to be a restrictive pattern on spirometry is, indeed, an obstructive disorder once lung volumes are examined. The relatively smaller size of the intrathoracic airways in the pediatric population leads to early obstruction in the peripheral airways. This may be compounded with mucus secretions in the airways or bronchoconstriction of these airways. With a forced expiration, distal airways are squeezed and occlude, resulting in significant air trapping.
Diffusion capacity
The Dlco in the pediatric population can be an important indicator of gas transport difficulties at the alveolar level. This may be caused by problems with perfusion of the pulmonary capillary bed, bleeding within the lung, or thickening of the alveolar-capillary membrane. Several serious pediatric disorders fall into these categories, and the Dlco may provide an answer to a very specific question. Examples of pediatric pulmonary diseases that may produce a reduced Dlco include pulmonary fibrosis (primary disease or secondary to radiation treatment or chemotherapy), immunologic disorders (scleroderma, systemic lupus erythematosus), bronchiolitis obliterans, pulmonary edema, and hematologic disorders. An abnormally high Dlco may be seen in acute hemorrhagenous bleeds, as in pulmonary vasculitis. The single-breath Dlco (Dlco) is the most common method used for assessing diffusion capacity. The problems already discussed in performing pulmonary function studies in the pediatric patient are compounded for this particular test. However, the guidelines and recommendations offered by the ATS-ERS for Dlco testing in adults are also applicable to pediatrics (see Chapter 3). The single-breath maneuver is difficult for very small children to perform and often requires several sessions of practice. Even older children may have difficulty accomplishing the important components of the Dlco maneuver. These components include emptying to residual volume before a deep inspiration, obtaining an IVC of at least 85% of FVC, a relaxed breath hold of 8–12 seconds, and a smooth, complete exhalation. In addition, other technical considerations may alter results, such as inappropriate mechanical or anatomic dead space corrections. Depending on the system used, if end-tidal gas is collected in a sample bag, the bag should be an appropriate size for pediatric patients. Similarly, if a demand valve is used for the inspiration of test gas, the triggering mechanism should be sensitive enough to be opened easily by a child. Some commercial systems also provide an option for a slow exhalation against a resistor instead of the breath hold. The advantage of this technique is that a breath hold is not necessary; however, a target flow for exhaled gas must be maintained. Unfortunately, children who cannot perform a breath hold are generally not able to perform this technique well.
Other confounders that alter the measurement of Dlco are abnormal levels or types of hemoglobin. Children who require repeated Dlco measurements may have conditions that cause anemia (e.g., chemotherapy, sickle cell disease, transplantations). Reduced circulating hemoglobin reduces the raw measurement of Dlco. Conversely, chronic hypoxemia may produce a secondary polycythemia that increases circulating hemoglobin and may increase the raw measurement of diffusion capacity. The presence of carboxyhemoglobin (COHb), methemoglobin (MetHb), or fetal hemoglobin will decrease the ability of hemoglobin to bind with carbon monoxide and reduce the diffusion capacity. It should not be assumed that pediatric patients do not smoke. Certainly teenagers should be asked whether they smoke and told honestly that smoking may affect the results of the test. If the patient has been smoking before testing, a COHb level can be obtained to correct for carbon monoxide already present in the circulating blood. Correction of Dlco for hemoglobin is an essential component in analyzing the diffusion capacity of the lung (see Chapter 2).
As with adults, diffusion capacity is dependent on the size of the lungs. An estimation of lung size known as the VA (alveolar volume) is also made during the single-breath maneuver. In addition to carbon monoxide, the test gas also contains an inert gas such as helium, methane, or neon that is used to estimate VA by a dilution method. The VA can be compared with the TLC obtained by other methods, such as plethysmography, but should be a lesser value. Calculated VA does not account for dead space ventilation as plethysmographic TLC measurements do. As with all gas dilution techniques, VA will be increasingly underestimated as airflow obstruction worsens. Refer again to Figure 8-17. Recall that the patient discussed in Figure 8-17, A, is a young man with advanced cystic fibrosis. The raw Dlco is reduced, but Dlco/VA is in the normal range. This patient’s VA is only 2.31 L as compared with the TLC of 4.83 L—more than 50% less. It is important to understand that the VA will measure only lung volume with communicating airways (i.e., adequate ventilation). The ratio Dlco/VA also reflects diffusion capacity only in well-ventilated areas of the lung. Compare this to the patient with systemic scleroderma in Figure 8-17, C. The raw Dlco is severely reduced, consistent with the diffusion block and fibrosis associated with scleroderma of the lung. Lung tissue that is less affected has a diffusion capacity within normal limits; thus, the Dlco/VA is 76% predicted. The VA of 0.91 L is closer to the TLC value of 1.55 L, reflecting the primary restrictive component of her disease. In a purely restrictive disease, the VA may come close to the TLC. Recall, however, that this patient also has ventilation defects.
Other Measured and Clinically Followed Parameters of Pulmonary Function in Pediatrics
Maximal Respiratory Pressures
Measurement of muscle strength can be an important parameter in the pediatric population. Children have a variety of congenital and acquired neuromuscular disorders and thoracic deformities that reduce the strength of the diaphragm and intercostal muscles. Examples of neuromuscular diseases include, but are not limited to, muscular dystrophies, spinal muscle atrophy, meningomyeloceles, Guillain-Barré syndrome, myasthenia gravis, trauma-related paralysis, and steroid-induced myopathies. Thoracic deformities include scoliosis, kyphoscoliosis, pectus excavatum or carinatum, and undefined congenital syndrome abnormalities. Measuring maximal inspiratory pressure (MIP) and maximal expiratory pressure (MEP) may help (1) identify the degree of weakness and (2) follow the progression of the specific disorder. See Chapter 10 for a discussion of the technique for performing MIP and MEP. This test can be scary for children. The patient and parent should be gently warned that the measurement of the MIP might be uncomfortable and cause the child to cry. For this reason, this test should be performed after all other measurements are made. In children, it may be necessary to attach a mask and one-way valve to the pressure manometer and apply the mask snugly to the child’s face. It may also be necessary to hold the mask in place until the child becomes “air hungry” and feels a need to gasp for air. It is understandable why this test is so unpopular with children. A similar measurement of spontaneous inspiratory strength may be made while a child is undergoing mechanical ventilation, and this parameter is often referred to as the negative inspiratory force (NIF). Although the measurement of inspiratory strength may ultimately be involuntary, the expiratory strength measurement (MEP) is completely effort-dependent. The child cannot be forced to push as hard as possible unless he or she chooses to do so. For this reason, MEP results should be viewed cautiously. Although predicted values are available for MIP and MEP, a single measurement in time may be difficult to interpret. Rather, trending serial measurements often provides information that is more useful once the child is accustomed to the test.
Maximal Voluntary Ventilation
In a cooperative and inspired child, the maximal voluntary ventilation (MVV) can be a very useful measure of muscle strength, as well as maximal ventilation (see Chapter 2). If the child has significant muscle weakness, he or she may not be able to sustain maximal ventilation for the required 12 seconds. In this case, comparing the MVV for 6 seconds with that of 12 seconds may explain the disparity. The MVV may also be used before a maximal exercise test to identify the maximal level of ventilation of which the child is capable. Ventilatory limitation during exercise can be identified by comparing the minute ventilation at maximal O2 consumption with the MVV obtained before exercise.
Infant, toddler, and preschool pulmonary function testing
Lung Volume Measurement
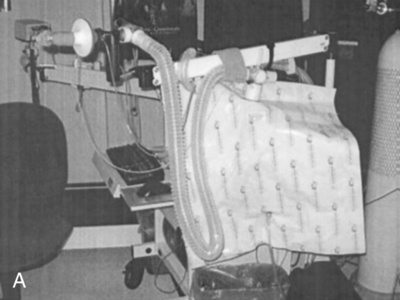
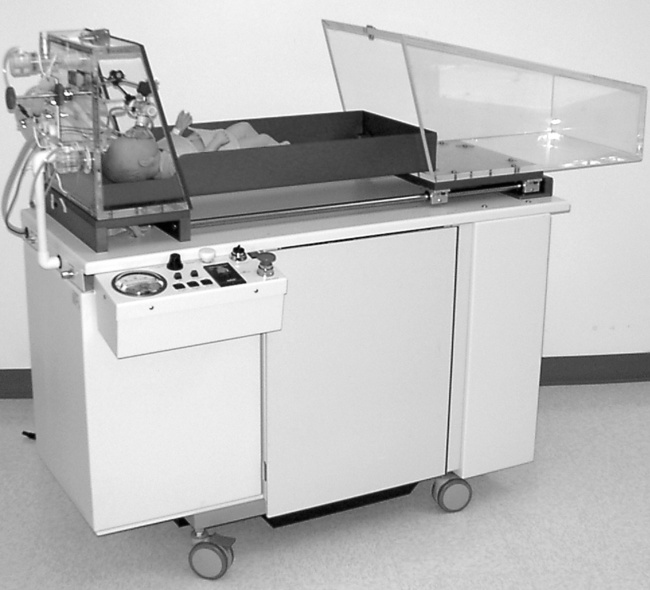
As with measurement of lung volumes in adults, the lung volume compartments in the infant can be measured by several techniques, including gas dilution and whole-body plethysmography. Until recently, body plethysmography in infants was performed almost exclusively by infant pulmonary research laboratories. Only a few manufacturers produce commercially available body boxes for infants (Figure 8-18). Whole-body plethysmography in an infant presents a unique set of challenges. The theory and technical aspects of measuring VTG, previously discussed in Chapter 3, are essentially the same for adults and infants but with several additional caveats. The sedated infant is placed in a supine position with nose and mouth surrounded by a tight-fitting mask with a small dead space volume. Rapidly moving valves may make airway occlusions at end-inspiration or end-expiration for determination of VTG and Raw. The infant does not pant. However, tidal breaths may be shallow; therefore, the pressure transducers and flow sensors must be critically precise and accurate. In addition, the infant body box is relatively small, and temperature changes can drastically alter these measurements. Therefore, the temperature in the box must be controlled and the air vented. Signal-to-noise ratios are particularly critical in an infant plethysmograph. Although the child is motionless, safety features must permit rapid access to the box and the baby. The breathing apparatus should be easily removable, in case the child is in distress or vomits. The advantage of plethysmography in infants is that it accurately measures VTG, and thus FRC may be determined. Because the infant is not capable of performing a voluntary maximal inspiration or expiration, residual volume and TLC cannot be obtained in the traditional manner. However, if the infant pulmonary function system is capable of performing raised volumes and forced thoracic compressions, then a full set of fractional lung volumes can be estimated. A forced squeeze from TLC provides a volume close to a vital capacity measurement and can be used to calculate ERV, RV, TLC, FRC/TLC, and RV/TLC.
Passive Tidal Techniques to Measure Respiratory Mechanics
Passive Tidal Loops
Passive Compliance, Resistance, and Time Constants
The chest wall of the infant is extremely compliant, unlike that of an adult. It does not contribute significantly to the compliance of the total respiratory system. Measuring pulmonary mechanics in the infant takes advantage of this very important difference. Noninvasive measures of respiratory system compliance, therefore, directly reflect the child’s lung compliance. In simplest terms, compliance is defined as change in volume divided by change in pressure (C=ΔV/ΔP) (see Chapter 2). In a quiet, relaxed baby (usually sedated), these parameters can be measured easily. The method is referred to as the passive occlusion technique. Rapid occlusion of the airway may occur once (single occlusion) at the end of a tidal breath, or with multiple occlusions at different lung volumes. Young infants will hold their breath when their airway is occluded. This phenomenon is known as the Hering-Breuer reflex and is present in children until approximately 1 year of age. During a single-breath occlusion and breath hold, alveolar pressure equalizes and can be measured by a pressure transducer at the airway opening (mouth). Once the occlusion valve opens, the child can passively exhale, and the exhaled volume can be measured by a flow sensor. The two components of respiratory system compliance (Crs), change in pressure and change in volume, are obtained. Respiratory system resistance (Rrs) can be easily calculated from the same maneuver. Resistance is defined as change in driving pressure divided by flow (R=ΔP/ ). With the maneuver described, the driving pressure is the plateau pressure (alveolar pressure) measured at the airway opening developed during the occlusion. Flow is the peak flow (discounting pneumotach artifact) measured from the passive exhalation. Refer to Figure 8-19. The graphs on the left side of the page represent passive exhalation after occlusion. The graphs on the right depict the increase in airway opening pressure to plateau (alveolar) pressure during occlusion. A normal passive exhalation after occlusion in an infant without any lung disease is shown in Figure 8-19, A.
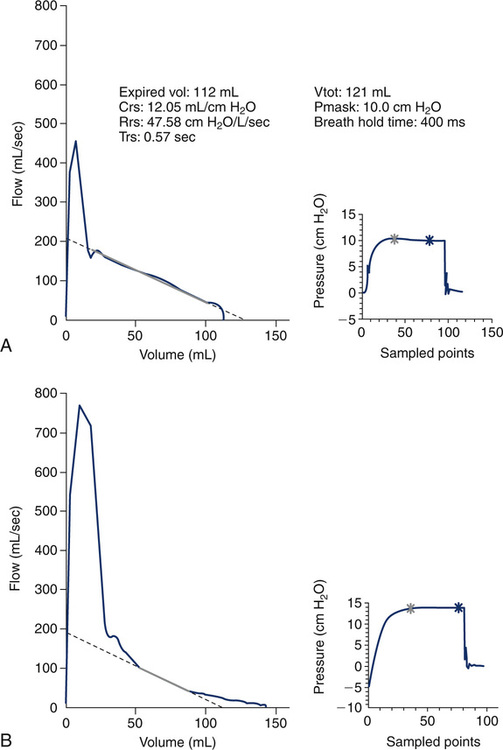
The slope of the curve is linear as the baby exhales to a relaxed FRC. Children with airflow obstruction do not empty their lungs at a constant rate. The expiration may be forced with paradoxical movement of the diaphragm and belly. The accuracy of compliance and airway resistance measurements made under these conditions is poor. The exhaled curve may end abruptly with the child at an elevated FRC or may appear “scooped out” or curvilinear, as in Figure 8-19, B. The lungs do not empty homogeneously or uniformly and therefore have multiple time constants. One time constant represents the amount of time to expire approximately 2/3 of the tidal volume. Time constant (TRS or τ) is easily calculated as compliance times resistance (Trs=Crs×Rrs). Because respiratory system compliance is dependent on the lung volume at which it is measured, it may be important to “correct” the measured parameter by the infant’s FRC. As mentioned earlier, dividing the raw or actual compliance by the FRC yields specific compliance.
Thoracoabdominal Motion Analysis
One of the main disadvantages of all of the measurements discussed in the preceding sections is that they involve the use of a mask or mouthpiece. Unfortunately, the presence of any foreign body in the airway is invasive and can alter breathing, especially passive tidal breathing. An advantage to this next technique is that it does not use any device at the mouth and can be truly considered noninvasive. Although the following techniques are not commonly performed in many clinical pediatric pulmonary function laboratories, they are central to the measurements made in a sleep laboratory. Observing the motion of the respiratory system can also provide valuable qualitative and quantitative assessment of pulmonary and chest wall mechanics and are worthy of discussion. Recall the basic mechanics of breathing and the coordination of the diaphragm and respiratory muscles during the passive breathing cycle. During inspiration, the diaphragm contracts and flattens, which causes the abdomen to rise. Simultaneously, the intercostal muscles contract, pulling the ribs upward and forward. During passive expiration, the diaphragm and intercostal muscles relax, and the abdomen and chest fall. This synchronous movement of the abdomen and rib cage can be easily monitored by placing an expandable strain gauge or band around both the abdomen and the chest wall (rib cage). These devices differ as to how they are made and the method by which they make measurements. Although the devices differ, the principle is similar. This technique is not generally limited by size or age; therefore, it can apply to infants, toddlers, older children, and even adults. The length of the strain gauges or bands is appropriate for the size of the patient. A popular example of this method is known as respiratory inductive plethysmography (RIP). The band is elasticized and has coiled wire sewn through the band in a sinusoidal pattern. A very low-voltage alternating current is passed through the coils. As each band expands (as with inspiration), the coils are stretched, which alters the cross-sectional area of the bands and changes the inductance of the coiled wire. A positive voltage signal (upward deflection) can be visualized on the monitoring device for both the abdominal component and rib cage component (Figure 8-20, A). The change in the cross-sectional area is proportional to the expansion of the band, and therefore the depth of the inspiratory maneuver. As passive exhalation occurs, the bands relax, and the voltage signal drops (downward deflection), with the pattern producing a sinusoidal respiratory tracing. The movements of the rib cage (RC) and the abdomen (AB) are monitored simultaneously. Both components independently contribute to lung volume, and the sum of the two signals determines tidal volume (VT).
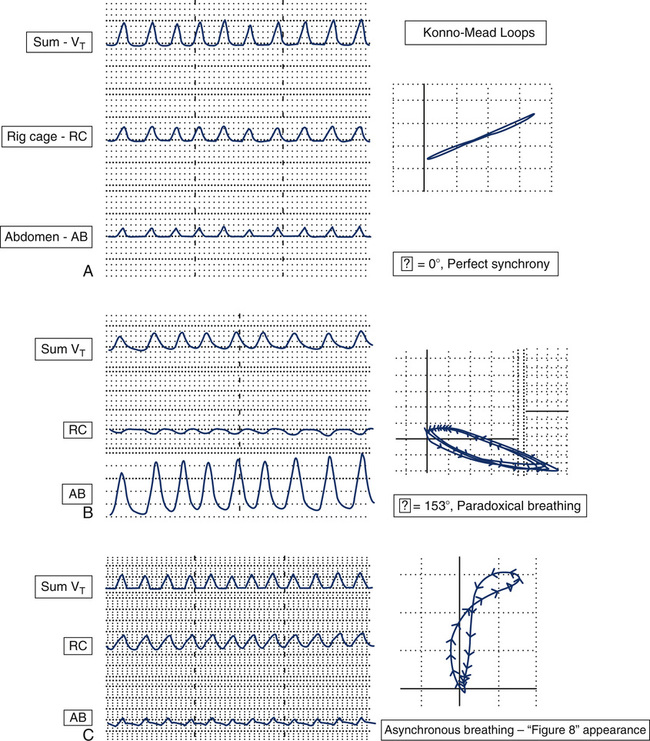
The tidal volume is maximized when the rib cage and abdomen move in synchrony, or are “in phase” with one another. The phase shift, Φ or phi, describes the asynchrony (or lack of synchrony) of the sinusoidal relationship between these two independent components. Both qualitative and quantitative information can be obtained from these tracings. A phase shift equal to 0 degrees denotes perfect synchrony. Figure 8-20, A, is representative of normal, quiet breathing. The movement of the rib cage and abdomen are in complete unison or synchrony. The child’s resultant tidal volume is the sum of the components of rib cage and abdominal movements. Figure 8-20, B, represents a child with paradoxical breathing. Note that the rib cage tracing is moving in the opposite direction of the abdomen. The abdominal and rib cage components are out of phase with one another. If observing this child, one would see the abdomen appear to sink while the chest was rising. This is the extreme end of asynchrony; however, there are endless variations in the movements of the rib cage and abdomen between complete synchrony and asynchrony. The phase shift will increase from 0 degrees to a maximum of 180 degrees with complete paradoxical breathing. Refer to Figure 8-19, C. Notice the difference in the shape of the tracing of the abdominal component. There are asynchronous movements of the rib cage and abdomen in this child.
Phase shift, Φ, can also be represented on an X-Y recorder. The figures produced, known as Lissajous figures or Konno-Mead loops, graphically plot abdominal movement on the x-axis, and rib cage movement on the y-axis. The arrows on the figures represent the direction of movement of the rib cage and abdomen during the respiratory cycle. Refer back to the tracing in Figure 8-20, A. Perfect synchrony would produce a loop that appears to be a straight line oriented as depicted (Φ = 0°). Figure 8-20, B, is representative of a Konno-Mead loop that demonstrates paradoxical breathing. The phase shift for this loop is 153 degrees, approaching the maximum of 180 degrees. The tracing in Figure 8-20, C, represents an interesting Konno-Mead loop, as one can imagine from the asynchronous movements of the rib cage and abdomen. Notice that the figure is vertical and forms a figure eight. Unfortunately, Konno-Mead loops often form figure-eight patterns, which cannot be assigned a quantitative phi value. There is also significant variation in the shape of Konno-Mead loops and phi values in patients with normal and abnormal breathing patterns. The limitations of quantifying these loops make it impractical for clinical testing in a pulmonary function laboratory. Nevertheless, there is a wealth of physiologic information in these measurements, and they are a valuable tool in illustrating the relationship of rib cage movement to abdominal movement.
Additional Passive Techniques Available to Measure in the Preschool Child
Impulse Oscillometry
Impulse oscillometry (IOS) is also referred to as the forced oscillation technique (FOT). See Chapter 10 for a detailed description. A miniature loudspeaker is placed proximal to the device’s flow sensor and produces forced oscillations of flow with a range of frequencies into the airway. They are sensed as popping pulsations as the child breathes tidally. The pressure oscillations generated by the sound waves are of two types: (1) those in phase with airflow, termed resistance (Rrs), and (2) those out of phase with airflow, termed reactance (Xrs). The reactance component is complex and relates to delays of pressure change caused by elastic components of the respiratory system, as well as inertia. The interaction of resistance and reactance constitutes respiratory impedance (Zrs), or Zrs=Rrs+Xrs.
Refer to Figure 8-21 for an example of the types of graphs that IOS measurements produce. Notice there is a graph for resistance (Rrs) measurements and reactance (Xrs) measurements. In both graphs, however, the x-axis is labeled as Hz representing the multifrequency band of forced oscillations being emitted by the loudspeaker. Note in Figure 8-20 that the resistance in this 12-year-old child’s lung is higher at lower frequencies and falls as the frequency of oscillations increases. This phenomenon is known as frequency dependence and is a characteristic pattern for a child this age. In an adult, however, this would not be normal but more characteristic of peripheral airflow obstruction, as seen in a smoker. Caution is needed, however, in viewing resistance measurements at very low frequencies (e.g., 5 Hz) in children because of other confounding factors, such as the effect of the cardiac impulse on these measurements. Reactance measurements are even less understood. Researchers are interested in the area of the curve that is formed by the reactance curve at 5 Hz and where it crosses “zero” reactance. The triangular region highlighted in the figure is known as AX. The larger the area of this region, the more abnormal the measurement, which may be related to airflow limitation. The point (Hz) that the reactance curve crosses the zero line is known as the resonant frequency of the lung (Fres). Because reactance as this point equals zero, only resistive forces are active and contributing to impedance. The resonant frequency (Fres) depicted in Figure 8-21 is approximately 18 Hz.
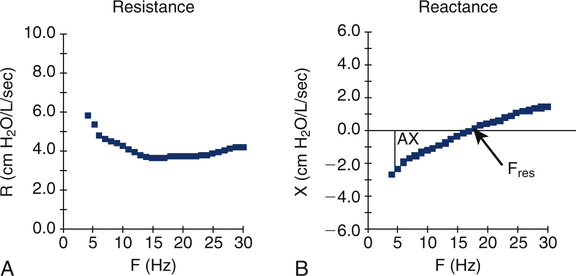
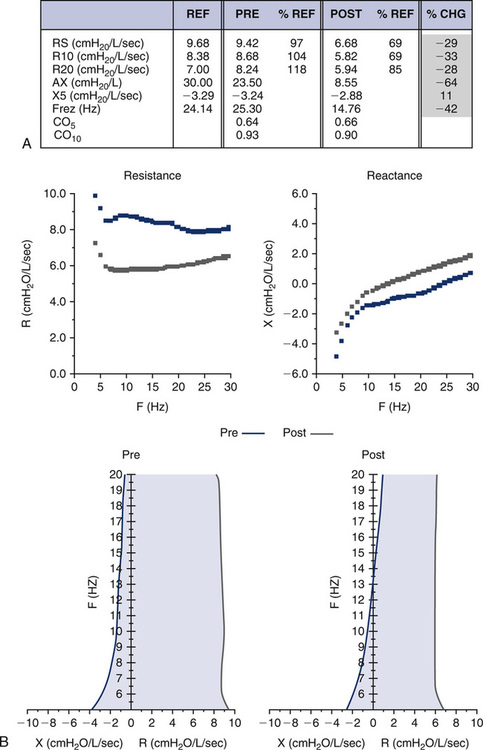
Figure 8-22 shows the results from a 5-year-old child performing IOS. She was unable to perform spirometry during a clinic visit to the pediatric pulmonologist. The child was very symptomatic with cough, but her pediatrician had never heard any wheezing in her lungs. Note on the data chart that the resistance and reactance measurements prebronchodilator all appear normal as a percent of predicted. Let’s introduce a new term: coherence. The terms CO5 and CO10 represent the coherence of the measurements at 5 and 10 Hz. Coherence is a measure of how technically acceptable the measurements are, with a perfect coherence of 1.0. The closer the coherence is to 1.0, the more technically accurate the measurements. In very young children, however, a CO5 of 0.6 or higher is considered acceptable because of the child’s small chest size and the interference of cardiac impulse. Postbronchodilator, note the resistance measurements of R5, R10, and R20 all dropped in the range of 28%-33%. Because of the variability of this test, it is necessary to see a percent change this high to interpret the results as a significant response to the bronchodilator. The 32% increase in reactance at 5 Hz (X5) along with the 64% decrease in AX and 42% decrease in resonant frequency (Fres) all correlate with a decrease in resistance and a significant response to the bronchodilator. The first set of diagrams (see Figure 8-22) again illustrates how resistance and reactance are graphed at the various frequencies or Hertz. Observe the change in both graphs after the bronchodilator is administered. The postbronchodilator curve for reactance (red) drops vertically or downward indicating a drop in airway resistance. The postbronchodilator curve for reactance moves to the left and upward. The two diagrams at the bottom of Figure 8-22 are a second method of graphing IOS measurements. The axes are reversed with frequency (Hz) on the vertical axis, and both resistance and reactance graphed on the x axis. The line on the left side of the zero point is represented by reactance (X), and the line on the right side of zero is resistance (R). The graph is shaded between the two lines and has the appearance of a tree trunk. The higher the resistance and more negative the reactance, the wider the tree trunk. Notice postbronchodilator that the lines move closer to one another and to the zero point. The width of the tree trunk decreases as resistance falls and reactance increases (becomes less negative) postbronchodilator.
Exhaled Nitric Oxide and Nasal Nitric Oxide
Measurement of exhaled nitric oxide (eNO) through the mouth and nasal nitric oxide are techniques now used in children. This procedure is an attractive alternative in the pediatric population because it does not involve any forced mechanics and is relatively simple to accomplish. The child is asked to take a single maximal breath in, followed by a prolonged exhalation through a restricted orifice in the mouth. Alternately, nasal nitric oxide is measured from exhaled air through the nasal passage. Abnormally low values of nasal nitric oxide are found in children with primary ciliary dyskinesia (PCD). Nitric oxide (NO) is a normally occurring substance found in reproducible levels in exhaled air. Levels of NO have been shown to significantly increase from tissues that are inflamed. The measurement of eNO has therefore been proposed as an index of airway inflammation, such as occurs in asthma. The clinical use of eNO, as well as nasal NO, in the pediatric population is still under investigation. As with IOS and Rint, eNO may be an important adjunct to serially follow asthma exacerbations in children and the effects of various drug regimens to control these exacerbations. Several limitations to this technique need to be addressed, including the collection of normative data and standardization of technique. Range of normal changes with age, and it is important not to “over-interpret” results. It is generally believed that an eNO greater than 25 ppb is above the upper limit of normal in children. A comprehensive discussion of eNO measurements can be found in Chapter 10.
Forced Flow Techniques for Infants, Toddlers, and Preschool Children
Partial Expiratory Flow–Volume Curves
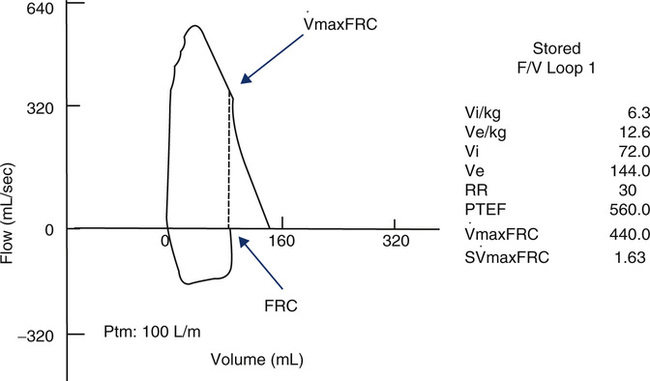
From a historic perspective, the technique of performing partial forced F-V curves was the first attempt at obtaining forced flows in infants and dates back to the late 1970s and the work of several notable respiratory physiologists. This technique is increasingly being replaced by measuring maximal forced flows from a raised lung volume close to TLC. The principle of the partial forced flows is similar to that described previously, but the infant must be sedated for complete relaxation. The child’s chest is mechanically squeezed (or “hugged”) by an inflatable jacket that surrounds the chest or a bladder placed over the chest and upper abdominal region. The technique is referred to as rapid thoracoabdominal compression (RTC). The flows that are generated are maximal flows from within tidal range (partial forced expiratory flow). They are measured by a flow sensor (usually a pneumotachometer) attached to a mask placed on the infant’s face. The lung volume that can be identified and referenced is the FRC. This is the resting level that the child passively exhales to with each tidal breath. Once the FRC point is identified on the y-axis (volume), a line can be drawn upward to intersect the F-V loop. The flow at this point is referred to as the flow at FRC or  maxFRC. Figure 8-23 identifies these points.
 max FRC of 440 mL/sec and an S
 max FRC of 1.63.
 maxFRC or
  maxFRC/FRC) As discussed earlier, FRC serves as a static measured reference volume. Because flow increases with higher volumes, a fixed relationship or constant value, independent of age or height, can be determined for flow at that volume. This constant value is termed specific flow, and normal specific flow should equal or exceed 1.20.
< ?xml:namespace prefix = "mml" />


Figure 8-23 shows a partial forced expiratory flow-volume curve from an infant. A rapid thoracoabdominal compression was performed after a tidal inspiration. Parameters measured include a  maxFRC of 440 mL/sec and an S
 maxFRC of 1.63. The specific flow at FRC was obtained by dividing the child’s
  max FRC of 440 mL/sec by a previously measured FRC of 270 mL (from nitrogen washout).
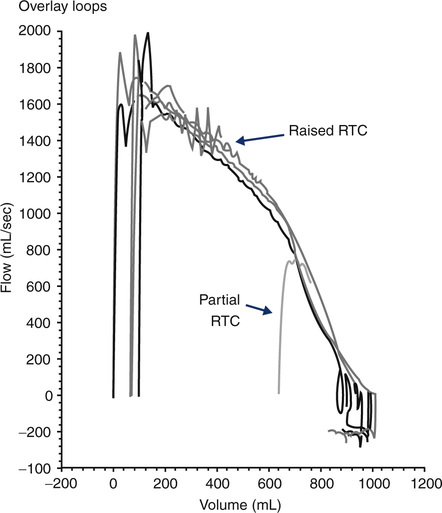
Forced Flows from Raised Lung Volume
Success in standardization of spirometry has been dependent on the patient inspiring to total lung capacity (TLC) before performing a maximal expiration. This is the key to standardization in infants as well. Techniques have been developed to raise the volume of the infant’s lungs before a rapid thoracoabdominal compression (RVRTC). This may be accomplished by stacking inspirations or by a method known as the raised volume technique. For this maneuver, a bias flow of air is provided to the child during inspiration. The exhalation port is simultaneously occluded, raising the intrathoracic pressure and volume in the child’s lungs. A pressure of +30 cm H2O is required to inflate the infant’s lung to near TLC. Once inflated, the child is then permitted to passively exhale. After several cycles of inflation and deflation, the child’s Pco2 decreases, relaxing the child further. The final inflation is then followed by a forced compression from the inflatable jacket. The maneuver is repeated at an increasingly higher jacket pressure until expired volume and flows maximize at mid-lung volumes. The advantage of this method compared with partial forced flows is that the expired volume is nearly an FVC measurement. The traditional FEV1 is not measured because the infant reaches residual volume before 1 second of exhalation occurs. However, the volume expired in 0.5 seconds or 0.75 seconds can be calculated and is analogous to the FEV1 in standard spirometry. Figure 8-24 shows several F-V curves obtained after rapid thoracic compressions (from raised lung volume) superimposed. Progressively higher squeeze pressures do not yield higher flows or volumes, indicating that flow limitation has been met. In addition, a partial F-V curve (from a lower lung volume) is superimposed on the diagram. The F-V curve in this example is from a child with normal lung function. Compare this to the F-V loop pictured in Figure 8-25. This infant PFT report is representative of a 1-year-old child with cystic fibrosis and mild intrathoracic airflow obstruction.
Note that the report resembles that of a standard PFT for an older child, except that the FEV1 is replaced with the FEV0.5%. Although the FVC, FEV0.5, and FEV0.5%/FVC are within normal percent predicted range, the flows from lower lung volumes (i.e., FEF75% and FEF85%) are reduced. TLC and FRC are within percent predicted values. The RV and RV/TLC are mildly elevated, consistent with mild air trapping. Also note that the values for forced flows may be represented as a “Z” score. This is a statistical method comparing test results to normative data that is growing in popularity in the pediatric pulmonary function world and is now recommended by the ATS-ERS focus group for infants and preschool children. It is thought that Z scores more accurately reflect normative data in pediatrics because of varying growth rates for age and sex differences. Refer to Evolve site (http://evolve.elsevier.com/Mottram/Ruppel/) for a discussion of means, standard deviation, and confidence ranges. One standard deviation equals “1” Z score. Two (+/–) standard deviations from the mean, in a positive or negative direction, is generally considered to be within the limits of normal, or the 95% confidence range. This would be represented by a Z score of +/–2.0. Refer again to Figure 8-25, and notice that the parameters that have normal percent predicted values also have Z scores close to zero. The FEF75% and FEF85%, however, have reduced percent predicted values, and their Z scores are greater than –2.0, both indicative of values outside of the normal range.
Standards for testing
Variability in Reference Sets and Predicted Values for Pediatrics
• How many normal children were studied, and how was it determined that these patients were free of respiratory disease?
• What are the demographics of the population represented (i.e., age range, sex, race)?
• What equipment and techniques were used to collect the data?
• How were the regression equations statistically generated, that is, which parameters, such as age, height, body surface area, are used as the independent variable(s)?
Biologic variability for physiologic measurements, including pulmonary function, is critically dependent on the populations’ sex, age, race, and body dimensions. Many older reference sets did not always distinguish between Caucasian and non-Caucasian participants. Often a “constant” correction factor was applied for race corrections, such as African-Americans (see Chapter 13). In addition, the ages of children tested were often in the range of 8 to 18 years. There is tremendous growth during these years, but at different rates, depending on sex and pubertal changes. Attempting to apply a simple regression for each parameter tested (FVC, FEV1, etc.), based on one independent variable (usually height), may be misleading. Although the distribution of pulmonary function values may follow the normal Gaussian (bell-shaped) curve (see Chapter 13), there is increasing disparity at both ends of the age range. Further error is introduced if these regression equations are extrapolated to ages younger than actually tested (e.g., down to 6 years). The Wang and Dockery reference set was the first widely accepted pediatric norm set that examined races separately and used both age and height as independent variables.
Reporting of pulmonary function results is also undergoing transition. Traditionally, PFT parameters have included the patient’s actual value, a predicted value, and the percent of predicted. However, the use of “percent predicted” only to define abnormal parameters has been shown to lead to erroneous conclusions. The ATS-ERS suggests using the upper and lower limits of normal to compare test data to reference data, or the 95% confidence range. Percentiles and Z scores are becoming more popular as alternative methods of reporting data. As the number of “normal” children tested increases, the significance of the CV (coefficient of variation) between subjects has been increasingly appreciated. It is vital to understand the importance of using the CV to establish a lower limit of normal (LLN). “Abnormal” cannot be clearly defined until the limits of “normal” are identified. This is essential in relating pulmonary function data to respiratory disease in children (see Chapter 13).
Summary
• The chapter describes techniques for performing PFTs in pediatric patients.
• Spirometry, lung volumes, Dlco, blood gases, pulmonary mechanics, and challenge tests are all discussed with attention to how these measurements differ in the pediatric population.
• For each category of tests, relevant questions are posed to relate pediatric testing to adult testing.
• Special emphasis is given to how the pulmonary function technologist should approach testing in young children and adolescents.
• Measurement of lung volumes, forced flows, and passive breathing mechanics in infants and preschool children are described, along with highly specialized techniques required to obtain data from these patients.
• Special problems related to standards for testing, including guidelines from the ATS-ERS and focus groups, and the use of appropriate reference values in the pediatric population are discussed.
Case Studies
Case 8-1
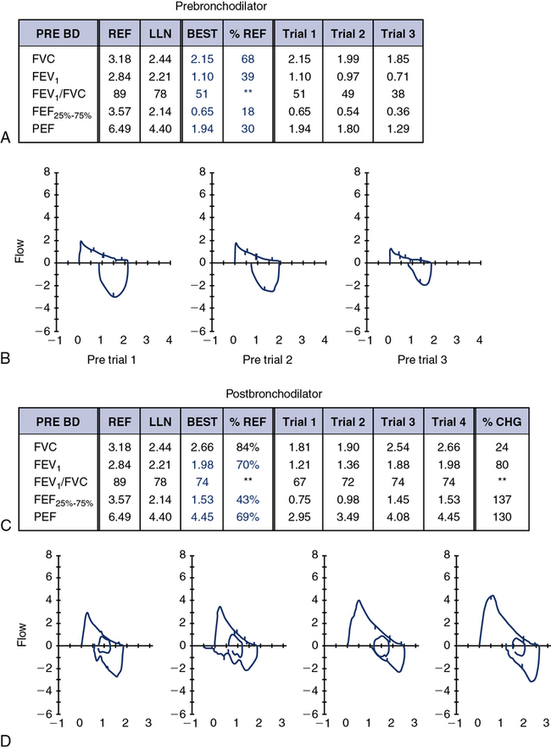
1. What do the results of the best spirometry prebronchodilator reveal?
2. What additional information do the prebronchodilator spirometry trials indicate?
3. Evaluate the entire flow-volume loop prebronchodilator.
4. What do the results of the best spirometry postbronchodilator reveal?
5. What additional information do the postbronchodilator spirometry trials indicate?
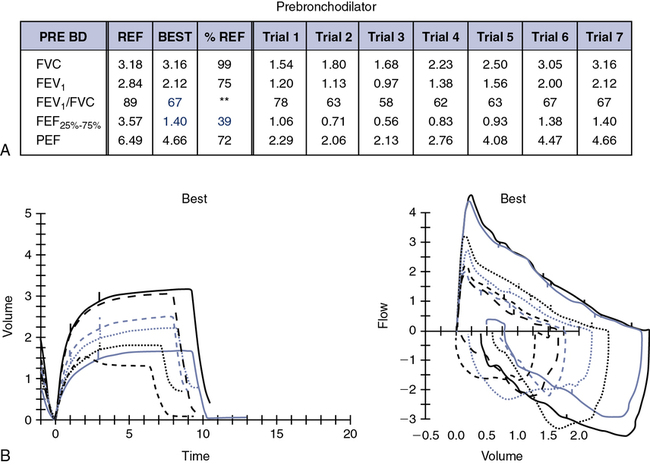
Case 8-2
PFTs for Subjects A and B are presented below:
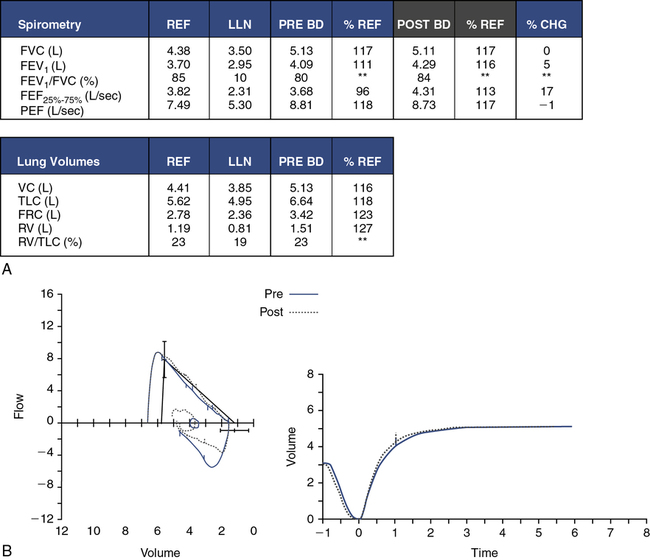
thoracic cage to efficiently empty her lung volume. Therefore, air trapping results. Her PFTs indicate a mixed restrictive and obstructive process.
Subject B has severely abnormal PFTs. As she grows, her chest cage may not be “growing with
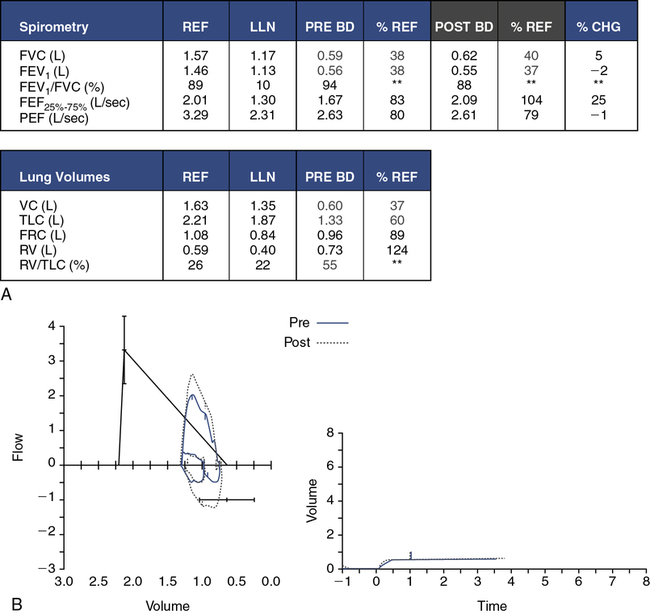
her” because of the rigid titanium implants. Her respiratory system is likely performing less efficiently with time. It is also impossible to guess what effect the abnormal chest, sternal, and rib structures are producing on larger bronchial airways as well as thoracic vessels and the heart itself. This subject requires extensive imaging of her chest as well as a full cardiac workup.
[/level-membership-for-pulmolory-and-respiratory-category][not-level-membership-for-pulmolory-and-respiratory-category]Chapter 8
Pediatric Pulmonary Function Testing
1. State how the combined American Thoracic Society-European Respiratory Society (ATS-ERS) task force guidelines relate to pulmonary function testing and, specifically, spirometry in children.
2. Suggest techniques for approaching young children, gaining their confidence, and ensuring maximal effort.
3. Identify common technique and/or effort-related errors during FVC maneuvers and the resultant effect on reliability of testing.
4. Discuss the potential importance of examining both the expiratory and inspiratory loops during spirometry.
5. State the most common pharmaceutical agent used for bronchoprovocation testing and the steps involved in performing this challenge in children.
6. State limitations and considerations for equipment as they relate to testing in children for the measurement of lung volumes and diffusion capacity.
7. State the physiologic and testing effects that sedation may produce in infants.
8. Identify various passive techniques to evaluate pulmonary function in infants, toddlers, and preschool children.
9. State the components of lung volume measurements that can be obtained in well-sedated infants and the equipment necessary to make those measurements.
10. State considerations that are important when establishing a normative or reference set for pediatric patients.
1. According to ATS-ERS recommendations, state the difference in a usable versus an acceptable FVC maneuver in a young child.
2. Discuss a scenario when the FEV0.5 may be a valuable parameter evaluating bronchodilator response during spirometry in very young children.
3. Explain the limitations of the FEF25%-75% in a very young child performing spirometry.
4. Compare the appearance of the flow-volume loop in variable intrathoracic versus extrathoracic obstruction and fixed patterns of obstruction, and provide examples of pediatric disorders associated with each.
5. State the difference between direct and indirect methods of bronchoprovocation, and give examples of each.
6. Discuss problems associated with the delivery of pharmaceutical agents in pediatric patients, and state advantages and disadvantages of each.
7. Discuss how exercise stress testing protocols can be of benefit in evaluating both airway hyperresponsiveness and pediatric cardiovascular problems.
8. Explain the purpose of the eucapnic voluntary hyperventilation (EVH) challenge.
9. Discuss the added benefit of performing lung volume measurements in pediatric patients to differentiate obstructive and restrictive components of disease.
10. Identify potential problems in obtaining diffusion capacity measurements in children and relate the effect of potential errors to resultant data.
11. Discuss the role of passive mechanics in evaluating infants and toddlers.
12. Compare and contrast an adult plethysmograph to an infant plethysmograph.
13. State the purpose of performing the raised volume technique when measuring lung volumes in infants.
14. Define the components that comprise respiratory impedance (Z), and state how airway reactivity can be evaluated using these measurements.
15. Explain why the use of the 95% confidence interval and/or Z score are superior methods of evaluating pediatric patient data rather than using standard percent predicted reference values.
Spirometry
Spirometry, by far, is the most common type of pulmonary function test performed in the pediatric population. Understanding how to teach children to perform this test well will help ensure that the physician will use and interpret this tool to treat his or her patient. The basics of spirometry apply to both pediatrics and adults (see Chapter 2). The same principles for testing and equipment are used. The indications for testing are similar, although disease processes in pediatrics often differ. The anatomy and physiology of the respiratory system change significantly from the infant to the young child and to the older adolescent. As for adults, the primary goals of spirometry are the following:
1. To identify the presence of an obstructive defect or a restrictive pattern of flow
Age Considerations for Children Performing Spirometry
Age considerations are a common concern that cannot be addressed until spirometry is attempted. Children as young as 3 years have the potential to perform the maneuver but with limitations. It has been suggested that at least 50% of children this age can perform pulmonary function tests (PFTs). Published data from several sources suggest that preschool children can perform technically repeatable forced vital capacity (FVC) maneuvers within 10%. Introducing spirometry to children at a young age often yields remarkable results within only a few training sessions. Figure 8-1 is a 5-year-old child performing spirometry for the first time. Note the child is standing, with noseclips in place, and mouthpiece fully in mouth.
1. Identify premature termination of the maneuver by comparing the flow at termination to that of peak flow. If cessation of flow occurs at greater than 10% of peak flow, the vital capacity and forced expiratory flows should not be reported. FEV0.5 or FEV1 may still be reportable. Because vital capacity may be completely exhaled by 1 second, examining exhaled volumes closer to peak flow (e.g., FEV0.5) may provide more accurate information regarding intrathoracic airflow obstruction.
2. As with current recommendations, the highest FVC and FEV1 (or FEV0.5) should be reported and the selection of “best” curve, based on the sum of FVC and FEV0.5.
3. Additionally, a close look at extrapolated volume is recommended. Because children have smaller lung volume, extrapolated volume during spirometry may exceed the 5% (or 50 mL) criteria currently stated in ATS-ERS guidelines. In very young children, an expiratory curve with an extrapolated volume as high as 80 mL or 12.5% (whichever is greater) may be acceptable and should be reexamined.
On average, by age 5 years, most children can perform spirometry with adequate technique and repeatability. Published guidelines from the ATS-ERS task force offer more realistic expectations for young children. There is not an age that all children, without exception, can perform technically acceptable spirometry. The ATS-ERS guidelines suggest that certain flow-volume curves may be “usable,” if not technically acceptable. Consider Figure 8-2, A. This is the first experience for this 5-year-old child in the pulmonary lab. On multiple attempts, her FEV1 was repeatable with the best curve, as shown. Note, however, that exhalation is incomplete and expiratory time is very short (slightly over 1 second). Therefore, the FVC values are underestimated and the FEV1/FVC is inaccurate. The curves, however, meet criteria for satisfactory start of test and are free of artifact for at least the first second. These classify as usable flow-volume loops, although not technically perfect.
As long as the patient blows for at least 1 second and that first second is free of artifact, the F-V loop and values may be used for interpretation. Caution is suggested in interpreting the FEV1/FVC or any parameter, based on a full expiratory maneuver. It is certainly understood that this may not represent the child’s maximal effort; however, identifying that this young child’s FEV1 is repeatable and within the normal range for her age is valuable information for the pulmonologist. The shape of the postbronchodilator flow-volume loop in Figure 8-2, B, is similar to the one in Figure 8-2, A, but larger. There is a proportional increase in both FVC and FEV1, which suggests the child took a deeper breath before performing the FVC maneuver. Learning effect can be seen even during the first session of working with a young child and should definitely be considered when interpreting this study. Although a bronchodilator response should not be ruled out, it is likely that learning effect was responsible for most of the improvement. It should be emphasized that spirometry is an effort-dependent test that requires cooperation and attention from the child. Equally important is the experience and patience of a well-trained pulmonary function technologist. Children who are mentally delayed or not capable of following directions may not perform adequate spirometry at any age, regardless of the coach or technologist. Patients who are not feeling well or having chest pain, for example, may follow instructions but not perform maximally.
Ensuring Maximal Effort on the Part of the Child
First, gain the child’s confidence and do not rush into testing. Children are fearful that the testing will hurt. When possible, reassure the child by carrying on a conversation that is directed toward the child. As illustrated in Figure 8-3, try some “blowing” games with the very young child before approaching the PFT equipment. Use of a pinwheel is often very successful. It teaches the child the need to take a big breath and blow fast. Additionally, have the child try to continue to blow until the pinwheel stops turning. This important step reinforces a complete exhalation. Demonstrate the test and reassure the child that it is easy and fun. Pinwheels also make an excellent and inexpensive prize for the patient when testing is over. If a pinwheel is unavailable, the use of a tissue will substitute, although it is a bit harder. Demonstrate blowing the tissue as high, and keeping the tissue suspended for as long, as possible.
Once the child has practiced several times, move the child to the PFT machine and prepare for testing. When possible, the child should be standing and the technologist should be at eye level with the child. See Box 8-1 for a list of suggestions that will “break the ice” and get things going in a positive direction. The use of noseclips is recommended, depending on the age and cooperation of the child. The anatomy of the nasopharyngeal structures in younger children is such that the use of noseclips may not be necessary. If the child is willing to wear noseclips, encourage him or her to do so.
Importance of Effort
One of the biggest challenges with children is ensuring a maximal breath in before the forced expiration. The concept is simple: The more air in, the more air out. The technologist should strive to get the child to breathe in as deeply as possible and observe the child’s chest excursion. Movement of the shoulders upward without chest excursion is common and can fool the technologist into believing it is a maximal inspiratory capacity. This may also be a pitfall when comparing prebronchodilator and postbronchodilator spirometry. Figure 8-4 is also from a 5-year-old patient performing spirometry for the first time. The prebronchodilator spirometry (see Figure 8-4, A) appears to be normal and was repeatable. Postbronchodilators, both FVC and FEV1, improve significantly (see Figure 8-4). The increase in FVC and FEV1 is very symmetric, similar to the last example presented (see Figure 8-2, A). Learning effect cannot be ruled out. However, the shape of the F-V curve is very different with postbronchodilator spirometry. This is an example of a situation where the change in FEV0.5 might be more helpful in assessing intrathoracic airflow obstruction than the change in FEV1
The child is at a low lung volume when 1 second is reached (close to FVC) and the FEV1 is not reflective of airflow changes that are occurring at mid-lung volumes. It is critically important to realize that all of the “action” has already taken place by the time 1 second has elapsed. Parameters such as FEV0.5 or FEV0.75 should be assessed in these young children, although standards and guidelines for interpretation are not available. Contrast Figure 8-4 with Figure 8-5, A and B. In this example of a 7-year-old child, both FVC and FEV1 increase with postbronchodilator spirometry; however, the increase in FEV1 is proportionately higher, which also increases the FEV1/FVC ratio. Although learning may have some effect in this example, it is evident that mild intrathoracic airflow obstruction is completely reversed. Once a child has learned the technique and is capable of performing spirometry, the results are remarkably repeatable. The ATS-ERS guidelines now base repeatability of FVC and FEV1 on lung volume. Because younger children have smaller lung volumes than adults, these revised guidelines pertain to the pediatric population as well as to older patients with severe lung disease.
Once a maximal inspiration is accomplished, most young children do not have difficulty blowing out forcefully. As for adult spirometry, the technologist should minimize hesitation before the forced maneuver that may create a “time zero” or back-extrapolated volume error. Do not encourage a breath hold. Delayed exhalation can result in a poor peak flow measurement and falsely raise the FEV1. Figure 8-6 demonstrates this volume extrapolation or time zero error.
Figure 8-6, A, is an acceptable FVC maneuver. Note how the delayed exhalation in Figure 8-6, B, can skew the curve to the right and falsely elevate timed parameters. Young children have a desire to please and, unless they are feeling unwell, will usually respond to the direction to “blast or burst the air out.”
Length of Exhalation for a Child During an FVC Maneuver
Because children have lung volumes that are significantly smaller than adult lung volumes, their lungs may completely empty in only 2 or 3 seconds. When a child feels empty, the natural instinct is take a breath back in. With instruction, practice, and maturing, the child can learn to continue the expiration; however, this may not be possible on the first several visits to the lab. This does not invalidate the FVC maneuvers but requires that the testing be evaluated carefully. Figure 8-7, A, represents three prebronchodilator flow-volume (F-V) loops superimposed over each other. Although this young child does not meet the end-of-test criteria, the FEV1 and shape of the F-V loop are remarkably repeatable. Postbronchodilator (see Figure 8-7, B) F-V loops are significantly improved and repeatable. The current ATS-ERS guidelines more realistically represent what can be expected of a younger child.
Children who are severely obstructed, like their adult counterparts, may have the ability to exhale for an extended time. Figure 8-8 shows the F-V loop and volume-time tracing of a 10-year-old girl with cystic fibrosis. This child is able to sustain expiration for 15 seconds. However, the additional volume measured in this prolonged expiration is small and may exhaust the child performing the test. She approaches a flow plateau at approximately 7–8 seconds, and the maneuver can be terminated at this point. The spirometry is certainly still valid for interpretation if terminated before zero flow occurs. Many decisions regarding acceptability of PFT results require good judgment from the technologist and careful interpretation from the physician.
Reliability of FEF25%–75% in Children
Historically, FEF25%–75% has been used to evaluate flow from the “small airways”. More precisely, the FEF25%–75% should be considered a measurement of flow at lower lung volumes, not merely flow from medium-sized and smaller airways. As in adults, the variability of the FEF25%–75% is greater than that of the FVC and FEV1. Because children may be even less repeatable at baseline, the reliability of this measurement in pediatric testing may be questionable. In addition, if the child does not fully exhale to RV, FEF25%–75% may be artificially elevated because of reduced vital capacity. If it is reported, the FEF25%–75% in a pediatric subject should be interpreted with caution, especially in a very young child. A substantially greater change postbronchodilator is needed before a change can be considered significant. Refer back to Figure 8-4, A and B. Although the exhalation times do not meet the revised 3-second guideline for a child younger than age 10 years, it does appear that this patient exhaled to a volume plateau. The change in shape of the F-V loop, as well as the change in FEF25%–75% of 65%, is certainly suggestive of a reversal of intrathoracic airflow obstruction. An FEF25%–75% that improves by more than 35%–45% after a bronchodilator may be indicative of airway reactivity, but again caution is advised when considering this parameter. Repeatability of the FEF25%–75% is more reliable in older children and teenagers. As previously noted, FEF25%–75% can be reduced for several reasons that are not always related to peripheral airway disease. Refer to Figure 8-9. This F-V loop is from a 17-year-old patient who had tracheal stenosis after a prolonged intubation as a young child. The FEF25%–75% of this curve is severely reduced, as is the FEV1. The reduction is not caused by peripheral airway obstruction but by a large central (tracheal) airway obstruction.
Parameters of Inspiratory Forced Flow Helpful in Pediatrics
Spirometry yields a variety of expiratory and inspiratory flows, including FEF25%, FEF50%, FEF75%, FEF85%, FIF50%, and the FEF50%/FIF50% ratio. Each of these parameters relates to flow at a particular lung volume and may have some benefit for particular instances. These flows, like the FEF25%–75%, are less repeatable than the FEV1 and FVC and do not have any reference values. The FEF50%/FIF50% ratio may be helpful in identifying intrathoracic versus extrathoracic airflow obstruction (see Chapter 2). Unlike the expiratory limb of the F-V loop, the inspiratory limb has not been well characterized in pediatric subjects. There are several reasons for this; however, the most important are energy expenditure and effort dependence. Expiration from TLC is far more repeatable because of the elastic recoil of the lung. The FEF50% occurs in the portion of the expiratory limb that is considered effort independent. The inspiratory limb, conversely, is effort dependent and energy dependent for the entire maneuver. Therefore, optimal patient effort is vital for analyzing the inspiratory loop. A great deal of important information can be obtained from an appropriately performed maneuver. Too often, the inspiratory limb is ignored. When teaching children how to perform spirometry, certainly the emphasis is on expiration. Once it is mastered, attention should be paid to the inspiratory maneuver as well.
The aperture, or opening, through the vocal cords is approximately the same at both 50% of expiratory vital capacity and 50% of inspiratory vital capacity. Therefore, the FEF50%/FIF50% ratio should not be greater than 1.0. A ratio greater than 1.0 suggests an extrathoracic obstruction; however, this relationship has not been closely studied or reported in pediatric patients. Conversely, an FEF50%/FIF50% ratio of less than 1.0 may be normal or may represent significant intrathoracic obstruction. In addition, a ratio close to normal is possible if significant obstruction is seen on both inspiration and expiration (fixed obstruction), yielding a ratio of 1.0. Figure 8-9 demonstrates the effect of tracheal stenosis in a 17-year-old patient on the shape of the flow-volume loop, and the resulting FEF50%/FIF50% ratio. This underlies the importance of correlating the F-V loop with the child’s clinical picture and symptoms.
Figure 8-10 shows examples of F-V loops with differing FEF50%/FIF50% ratios and the shape of the loops represented by those ratios. Although FEF50%/FIF50% may not always discriminate between intrathoracic and extrathoracic airflow obstruction, the importance of extrathoracic obstruction should not be underestimated. Laryngeal webs, subglottic stenosis, tracheal malacia, and other lesions of the laryngeal-tracheal airway are important causes of upper airway obstruction in the pediatric population. In addition, the vocal cords represent a major “choke point” to airflow. The cords may have a structural abnormality, such as nodules or granulomas, or may become edematous, as in croup. The recurrent laryngeal nerve may be damaged, resulting in inappropriate movement or paralyzed cords. These conditions are generally easy to diagnose with direct visualization of the vocal cords. Vocal cord dysfunction (VCD) may also be responsible for poor abduction (opening) of the vocal cords during inspiration.
Role of Vocal Cord Dysfunction
Vocal cord dysfunction has become increasingly recognized as a reason for shortness of breath, in addition to throat and sternal chest pain, often mimicking asthma. Adolescents who are competitive athletes or are exceptionally goal oriented and children who have stress-related disorders are at highest risk. Unfortunately, vocal cord dysfunction is highly variable and may be detectable only when the patient is stressed in a manner that provokes the condition. The term vocal cord dysfunction (VCD) has sparked controversy among pediatric pulmonologists. Perhaps the term is not the most important consideration, but rather understanding that the vocal cords and larynx are very complex structures. There are likely many scenarios, some consciously controlled and others unconsciously controlled, that lead to the malfunction or inappropriate movement of the vocal cords. In very severe forms, “clipping,” or truncation, of the inspiratory loop with a completely normal expiratory loop is the classic presentation (see Figure 8-10, E). The child may or may not sound very stridorous during inspiration. The patient may try to speak while inspiring in short, gasping sentences. More common is a completely normal-appearing child with normal expiratory loops but highly variable inspiratory loops. Some inspiratory loops may be normal (FEF50%/FIF50%<1.0); however, many are often abnormal with an FEF50%/FIF50% greater than 1.0.
Vocal cord dysfunction is an example of a disorder in which the variability in the patient’s inspiratory loop is the hallmark of the dysfunction (Figure 8-11, A). These are the baseline loops from one patient, a 15-year-old teenager. Note how different all of the inspiratory loops look. Some have a triangular-shape appearance, some with the more classic flat, truncated appearance, and others have multiple inflection points. The inspiratory volume may be limited, giving a short, gasping type of inspiratory loop. A more normal inspiratory loop may appear among many abnormal loops (Figure 8-11, A, Trial 4). This is very important to capture when possible. It indicates that the child is capable of performing normal inspiratory loops, and the problem is likely more dynamic in nature, that is, a vocal cord malfunction. If there is a structural upper airway abnormality, the inspiratory loops should all look abnormal and very similar in shape. Structural obstructions are usually more fixed in nature with expiratory clipping also present. Refer again to an example of fixed airflow obstruction, as seen in Figure 8-10.
Under certain circumstances, very unusual inspiratory loops can be seen in multiple trials that are not effort- or technique-related. Consider Figure 8-11, B. These loops were obtained in a patient with excessive secretions and laryngospasm. Flow-volume loops are rarely diagnostic as a single test but certainly can suggest and support other diagnoses that are being considered.
VCD Combined with Intrathoracic Airflow Obstruction
To further complicate matters, vocal cord dysfunction is often seen in children with asthma. The relationship between these two disorders is not fully understood. There is certainly some similarity in symptoms, primarily shortness of breath, chest pain, and/or throat pain. However, some children who experience both asthma and vocal cord dysfunction can actually distinguish between the two disorders. Refer to Figure 8-12, A. These loops are from a known asthmatic child experiencing symptoms of shortness of breath and chest pain. The expiratory loops show very mild (if any) airflow obstruction. However, the inspiratory flow loops are variable and abnormal, as described in the earlier section. Vice versa, in Figure 8-12, B, note the characteristic “scoopy” appearance of severe expiratory airflow obstruction. This is accompanied by a normal appearing inspiratory loop. Note that the relationship of FEF50/FIF50 is skewed when the expiratory loop is not normal. The FEF50/FIF50 ratio discussed earlier is no longer valid in the face of intrathoracic obstruction. This ratio also does not hold true when the inspiratory loops are not complete, full loops or very irregular in shape.
Non-Repeatability in the Expiratory Maneuver
The ATS-ERS recommendations emphasize the importance of repeatability of the FVC and FEV1. In some instances, patients cannot reproduce these parameters, and effort is not the reason. Figure 8-13 shows an example of such an instance. If only a single (best) F-V loop (Trial 1) were reported to the physician, the interpretation would state that this patient has mild to moderate intrathoracic airflow obstruction. However, the next two successive maneuvers performed by this 15-year-old asthmatic are also illustrated (Figure 8-11, A, Trials 2 and 3). These successive trials reveal progressively significant drops in FEV1 and FEV1/FVC, which are not repeatable with Trial 1. This pattern is an extremely important clue to the hyperreactivity of the patient’s airway. Simply performing repeated forced maneuvers may cause an asthmatic to become suddenly more obstructed and vulnerable to further bronchospasm. In such an instance, the technologist should stop testing the patient and administer a bronchodilator. If the patient’s report included only his or her best prebronchodilator and postbronchodilator spirometry, it would completely omit this important information and might prevent necessary changes in his or her asthma medication regimen.
Airway Malacia
For older children, airway malacia may produce some bizarre-shaped F-V curves. Refer to Figure 8-14. These F-V loops are from a 12-year-old child with a malaciac left main stem bronchus. Trial 1 represents a forced exhalation that is normal in shape. Trial 2 is from the same patient during the same testing session. Notice the rapid drop in flow rate, followed by a “flattening” or shelf-like appearance in the curve. Blowing harder caused critical compression at the malaciac segment and resulted in a sudden decrease in flow rate, or flow transient. Note the reduction in FEV1, as well as FEF25%–75%, from Trial 1 to Trial 2. This represents another example of the inadequacy of looking solely at one or two parameters instead of considering the entire picture. The shape of the curve in Trial 2 is characteristic of two lungs emptying at different time constants. One lung empties normally during forced exhalation, whereas the other lung takes considerably longer to empty because of the central intrathoracic obstruction present. Obtaining repeatable and acceptable F-V loops in the face of airway malacia can be challenging. Although not always successful, taking extra time with the child to try different breathing techniques or different mouthpieces may result in a more normal expiratory loop.
Bronchoprovocation challenges
Traditionally, methacholine chloride has been considered to be the “gold standard” for bronchoprovocation testing. If a conclusive answer is not obtained, the physician may then choose to rechallenge the patient with a stimulus that has a different mode of action. For example, a common complaint in adolescents is shortness of breath and chest pain with exercise. The specific question posed by the physician might be: Does this child have exercise-induced asthma? If symptoms present only while the child is exercising, the logical provocation study to perform first would be an exercise stress test. Most pediatric laboratories will admit, however, that only a small percentage of children exercised actually exhibit exercise-induced asthma. This type of provocation study is very specific but not very sensitive. Recall that exercise is an indirect method of provoking bronchospasm and may be influenced by the type of exercise performed (running vs. swimming vs. gymnastics, for example). The environment may contribute to the provocation. Is the child running outdoors during allergy season? Is the child swimming in a chlorinated indoor pool? Do the temperature of the air and humidity affect the response, such as cold ice rinks versus hot, humid football fields. It is not unusual for a child with intermittent or mild persistent asthma to test negative during an exercise challenge in a controlled laboratory environment. The next step might then be a methacholine challenge, a direct stimulus, which is less specific than exercise, but much more sensitive for eliciting bronchospasm. The child with a negative exercise challenge may well have a positive methacholine challenge, although likely positive in the mild or borderline range. Should the physician skip the exercise challenge and move directly to a methacholine challenge? This decision is up to the physician and is dependent on the question he or she is asking. There is neither a right or wrong answer nor a right or wrong challenge to perform. Recently, alternative provocation agents, such as EVH and mannitol, have been investigated. Specific protocols for each type of challenge should be established by the pulmonary laboratory and approved by the medical director. Whichever provocation agent is used, it is very important that the child be capable of performing serial spirometry at specific time intervals in a repeatable manner. Challenges can be time intensive. The child should be continually monitored for signs of fatigue or waning effort. Because children can become fatigued or easily distracted with prolonged testing, abbreviated protocols have been published. In some pediatric laboratories, challenges on very young children who cannot perform spirometry are obtained. Techniques for monitoring airway resistance and reactance, such as impulse oscillometry (IOS), have been successfully used in 3-year-old children and older who cannot perform spirometry adequately. See Figure 8-15 and the IOS discussion to follow later in the chapter. Laboratories that do not have this type of equipment can also perform challenges in the ages 3-5 range by closely monitoring breath sounds, oxygen saturation, respiratory rate, and symptoms. Physicians must be immediately available when challenging very young children. Challenges in pediatric patients are not recommended in any facility unfamiliar or inexperienced with children. A fully stocked emergency cart is also essential. Patient safety and well-being are always the number-one priority.
Inhalation Challenges
The most common type of inhalation challenge performed is the methacholine challenge. The child inhales methacholine chloride in succeedingly higher doses of medication. One popular dosing regimen involves a ten dose schedule beginning at a low dose (0.031 mg/mL), doubling each successive dose to a maximal dose of 16 mg/mL. A second recommended regimen with five levels of dosing starts at 0.0625 mg/mL and increases to 16 mg/mL. The drug can be administered either with a dosimeter that delivers a very specific dose with each breath or via the 2-minute tidal breathing method. Details of these two methods are discussed in Chapter 9 and both methods are generally considered to be equivocal. The 1999 ATS Guidelines provide specific recommendations for choosing the appropriate method, dosing regimens for methacholine chloride and modifications as necessary, and many other considerations for labs undertaking bronchoprovocation studies. As mentioned earlier, it is necessary to establish a consistent and repeatable spirometric flow-volume loop at baseline before the administration of the methacholine. Obtaining not only repeatable expiratory loops, but also maximal inspiratory loops, can be very helpful in considering possible vocal cord dysfunction. Serial spirometry is obtained at approximately 30-60 seconds after the administration of methacholine and again at 90 seconds. Because the half life of methacholine chloride is very short, further spirometry trials may not reflect the action of the methacholine. However, caution is advised if the child’s spirometry worsens with repeated blows, and a third trial of spirometry may be warranted. Additionally, if symptoms such as cough, wheezing, or shortness of breath begin during trials, bronchoconstriction may also be worsening, and this child should not be given an increased dose of methacholine until his or her spirometry stabilizes. A drop of 20% or more in the FEV1 is considered the stopping point for the challenge. Most often, the computer software is able to calculate the provocative concentration that would produce a fall in FEV1 of exactly 20% (PC20), Laboratories that use dosimeters often report the provocative dose (PD20), or the dose of methacholine that correlates with an exact drop of 20% in FEV1. Pediatric patients should always be given a bronchodilator, such as albuterol, to reverse any possible bronchospasm that has occurred from the administration of the methacholine. This is true even if the challenge is considered negative. The bronchodilator may produce a significant response in FEV1 above the child’s baseline spirometry, and that information may be relevant to the physician.
