Pathology of the Cardiac Valves
F. Luke Aldo and Enrique Pantin
Cardiac valves… hopefully somewhere somebody talked about normal valves…
| NORMAL VALVE AREA | CM2 |
| Aortic valve | 3–4 |
| Mitral valve | 4–5 |
| Pulmonic valve | 3.5–4.5 |
| Tricuspid valve | 5–8 |
Normal systolic blood velocities through the valves are:
| Aortic valve | <1.4 m/s |
| Mitral valve | <1.2 m/s |
| Pulmonic valve | <1 m/s |
| Tricuspid valve | <0.8 m/s |
Valves and their supporting structures can sustain several types of damage that can cause them to malfunction. For simplicity, valve dysfunction has been categorized as stenosis or insufficiency. Before we continue any further we must always make sure in cases of valvular stenosis that the problem is at the valve level and not a sub- or supra-valvular stenosis. It takes years to develop tight valves, and thus it takes a while to cause problems. Leaky valves can occur over years, but also acutely. As you can imagine, acute valve leakage is not well tolerated by the heart. This often needs immediate medical intervention and usually surgical repair as the heart has no time to compensate for the extra volume load.
We are going to concentrate on the two valves that most commonly develop problems, the aortic and the mitral. When assessing valves we use 2-D imaging and Doppler-related measurements: continuous wave Doppler (for faster velocities, usually greater than 2–2.5 m/s), pulsed-wave Doppler (for slower velocities, anything less than 2–2.5 m/s), and color flow Doppler (will give us an idea about what the blood flow pattern is). We can also use 3-D, but this is a bit esoteric for us. We know what the normal velocities through the valves are and that if the valve gets narrower, in order to allow the passage of the same stroke volume the blood velocity through the smaller orifice will increase proportionally. This is valve stenosis in action. That is it, you’ve got it! End of chapter, we can stop writing! You wish! Valvular regurgitation is diagnosed when we see diastolic valvular flow in the opposite direction it should be going.
Now we are really done! Just kidding, we will explore stenosis and regurgitation a bit more.


In a tube with an area of focal stenosis:

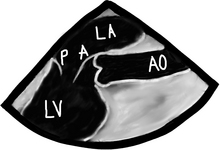
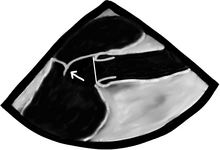
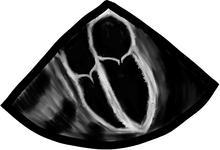
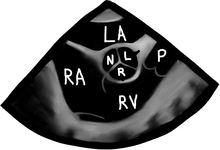
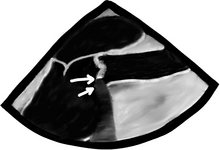
There are a bunch of images and numbers used to categorize the degree of valvular dysfunction. You should always look at the supra-valvular, valvular, and infra-valvular areas. For the aortic valve the mid esophageal long and short axis, and then the deep transgastric views are ideal. The first two will provide a lot of anatomical data and the last one is the best for Doppler measurements. In the ME AV LAX view (during systole and diastole) the areas above, below, and at the level of the valve can be examined in 2-D and then color flow Doppler. The first image below is named Mid Esophageal Aortic Valve LAX (Long Axis) view and is usually obtained at a multiplane angle of about 130 degrees. The image was taken in ventricular diastole; note that the mitral valve is open, and the aortic valve is closed. LA = left atrium; P = posterior mitral valve leaflet; A = anterior mitral valve leaflet (the anterior mitral leaflet is always the closest to the aortic valve); LV = left ventricle; AO = ascending aorta. The anterior mitral leaflet in this image corresponds to a segment of the mitral leaflet called “A2”. “A2” length measurement correlates very closely with the ideal mitral valve ring size that needs to be used when a surgeon performs a mitral valve repair in cases of mitral regurgitation. Hey, you can teach this to your surgeon! The second image is in ventricular systole. Notice the closed mitral valve and the amount of mitral leaflet coaptation (arrow), usually greater than 8 mm. A measurement of the aortic valve annulus is taken during systole (white line). This is the best view to measure the aortic annulus.
(a) enjoy watching your surgeon stomp his feet like a 2-year-old child who can’t get their way
(b) like to see him launch a scalpel across the room like he’s playing a competitive game of darts
(c) want to hear him curse like a truck driver
(d) want to make him realize he is not the omnipotent deity he thought he once was
The following TEE web page is an AMAZING teaching tool, go there and study it:
http://pie.med.utoronto.ca/tee/TEE_content/TEE_standardViews_intro.html
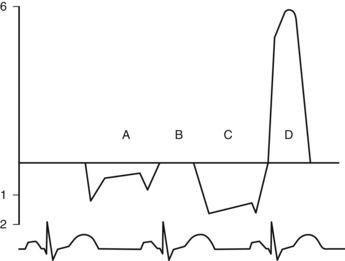
Mitral inflow patterns obtained with CWD can be seen below. All tracings shown below the baseline mean that flow is moving away from the transducer, and all shown above, duh, mean that flow is moving towards the transducer! You feel pretty smart, don’t you? We decided to place several patients in one drawing. “A” and “B” demonstrate normal CWD tracings through the mitral valve in diastole and systole. The Doppler cursor is placed running through the middle of the mitral valve. Take a look at a normal valve tracing during ventricular diastole “A”. You did notice the two peaks of the “A” tracing right? The early one called the “E wave” represents passive ventricular filling, and the late one, the “A wave”, represents additional ventricular filling due to the atrial kick. Yes indeed, the “A wave” is named after the atrial kick. When the mitral valve closes, during ventricular systole, we see a normal mitral valve tracing “B” (no Doppler signal in diastole because the valve is 100% competent). The next patient is Mr. C with a typical severe mitral stenosis tracing “C”. Note the increased velocity, the little “E wave” deceleration slope, and the large area under the curve for “C”. This is reflective of a high gradient across the mitral valve, all indicative of significant mitral stenosis. Finally, in the case of mitral regurgitation we see patient “D”.
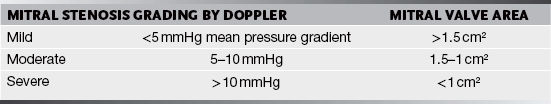
A mean pressure gradient >5 mmHg is suggestive of severe tricuspid stenosis and an area of <1 cm2.
Mitral and tricuspid regurgitation is much easier, especially to differentiate between none or mild (we all can have a bit of leaking in these valves) and severe leakage! The most helpful tool is the CFD. Remember to set the color flow Doppler scale to ≥50 cm/s, otherwise we will be over reading and calling things severe that are not. Starting from the ME4C view, we look at the valve and multiplane to see all sides of the valve. In the 2-D image below, obtained in ventricular systole, it is pretty clear someone bit a piece off of the mitral valve leaflets and a gap can be seen. We then turn on our secret weapon, CFD, and a large, gigantic, humongous flare of color can be seen across the mitral valve. This is severe mitral regurgitation. A wimpy barely visible flare across the tricuspid valve is seen as well. This qualifies for trace tricuspid insufficiency. Please do not panic, we all have a bit of tricuspid regurgitation and other flares as well.
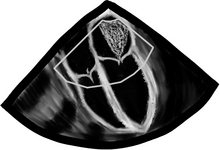
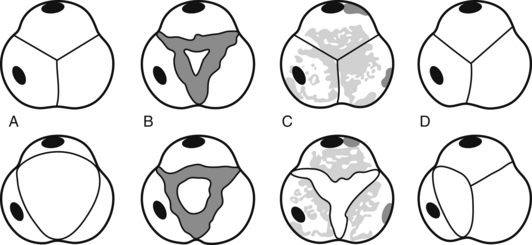
Before we go into fancy methods of valve assessment in the mid esophageal 4-chamber view we need to center the mitral valve in the middle of the screen and at zero degrees scan the entire valve. First, we slowly pull out the TEE probe until the valve disappears and then advance it back in until the valve disappears again. What we just did was scan the valve from the most superior area of the valve, the so-called “Area 1”, then as we reinserted the probe we passed through “Area 2”, and finally before we lost the view of the valve we saw “Area 3”. The posterior mitral valve usually has three clearly differentiated scallops, the most superior numbered “1”, the middle, “2”, and the most inferior, “3”. The corresponding opposing portions of the anterior leaflet are named the same way. This mitral valve nomenclature allows for uniform communication among surgeons, cardiologists, and anesthesiologists. From the Transgastric Basal SAX (short-axis) view of the LV, we can see these three mitral valve segments as well. This view is obtained at ZERO degrees as well with the probe inside the stomach and moderate degree of ante-flexion of the probe tip.
The pulmonic valve for TEE is like the red-headed step child that no one likes. Why is this the case? The pulmonic valve is the furthest away from our TEE probe and as a result, the hardest to image. In the case of pulmonary regurgitation, there are no quantitative measurements to grade the severity. We are left with making a qualitative assessment of the valve and regurgitation. A thin jet with a narrow origin is likely mild and a large jet with a wide origin is likely severe. Not very scientific we know. As for pulmonary stenosis, a CWD can be shot down the valve to obtain a peak gradient.
Pulmonary stenosis can be graded depending on the PEAK pressure gradient as:
| Mild | <36 mmHg |
| Moderate | 36–64 mmHg |
| Severe | >64 mmHg |
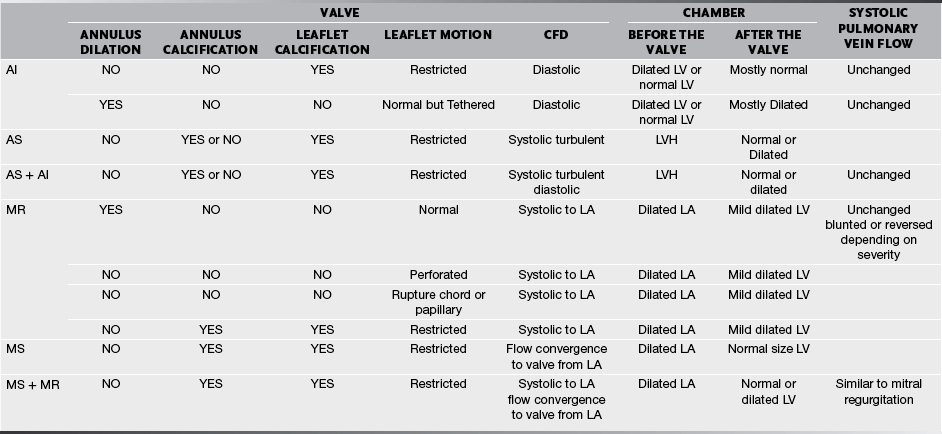
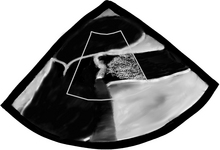
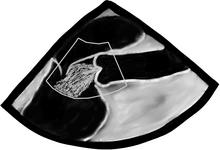
Then again place the CFD over the valve. We will see systolic turbulent flow after the valve in aortic stenosis, and diastolic blood flow across the aortic valve if insufficient. In the picture below, we see the Mid Esophageal Aortic Valve LAX view during ventricular systole. The two following images are of the same patient, both in ventricular systole. On your left, there is an aortic valve that does not visibly open, not even with a microscope can we see an opening! We see that the mitral valve is closed because… yes, you’re correct: the heart is in ventricular systole, because the aortic valve does not open… not because it is lazy, but the leaflets are stuck together… yes, correct again: this is how severe aortic stenosis looks! The aortic valve leaflets are thickened and have areas of calcification (top arrow) with posterior echo shadowing as the ultrasound has trouble seeing beyond the calcified area and thus the machine just shows a black long triangular area after the severely calcified area (bottom arrow). All of this is typical of senile calcific aortic stenosis. To the right, color Doppler demonstrates a mosaic flow pattern after the valve. This is typical of turbulent flow, and flow speed above the flow scale limit aka the Nyquist limit.

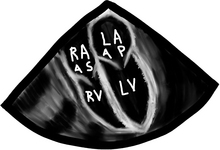
Wider and longer color usually correlates with a more severe problem. If the ventricular function is poor, systolic flow will be decreased as well. Now that we are done with 2-D and CFD, it’s time to do CWD across the valve. The transgastric views are the best views to shoot a CWD across the aortic valve, as they allow parallel alignment of the Doppler beam with the valve. The Deep Transgastric LAX view, obtained at ZERO degrees, is shown below with the Doppler cursor in ideal position across the aortic valve; RV = right ventricle, LV = left ventricle, LA = left atrium, and A = aorta.
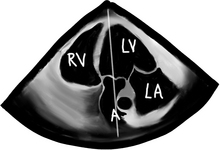
CWD cursor is seen across the LV, aortic valve, and proximal ascending aorta.
CWD systolic envelope with a peak velocity greater than 1.5 m/s is seen in stenosis.
Aortic stenosis can be classified depending on the degree of peak velocity by CWD as:
| Mild | >1.5 m/s, but<3 m/s |
| Moderate | 3–4 m/s |
| Severe | >4 m/s |
These velocities correlate with aortic valve areas of:
>1.5 cm2 = Mild AS
1.5–1 cm2 = Moderate AS
<1 cm2 = Severe AS
These peak velocities are all nice, but if the ventricle is half dead (has poor/crappy function) he is not able to generate large gradients even in the presence of severe stenosis. One easy way to tell, besides looking at the valve, is to measure the PWD at the LVOT and the CWD through the valve. A ratio of LVOT velocity/aortic valve velocity close to 100% is normal, >50% is indicative of mild stenosis; 50–25%, moderate, and <25% is indicative of severe aortic stenosis. These Doppler measurements along with a measurement of the LVOT cross sectional area (which is easily obtained in the ME AV LAX view by measuring the diameter of the LVOT and having the computer figure it out) can also be plugged into the continuity equation, which we reviewed earlier, and an aortic valve area can be calculated. Another quick and dirty measurement could be made using planimetry in the ME AV SAX view. Planimetry is just a fancy word used for tracing the aortic valve orifice and having the machine calculate an area. It has tons of potential for error, especially in a stenotic valve, and is no-where near as impressive as the all great and powerful continuity equation!
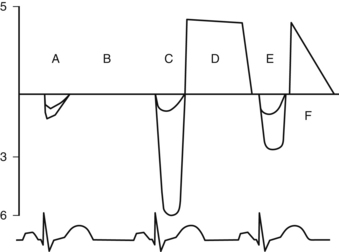
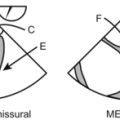
Tracings below the baseline represent systolic flow across the aortic valve, and above, diastolic flow. Note also the “double envelope” in all systolic flow patterns. The larger tracing of the “double envelope” represents flow across the aortic valve and the smaller one represents flow at the LVOT. “A” and “B” = a normal systolic and diastolic (no flow across the valve) flow pattern. “C” = severe aortic stenosis, with a peak velocity of 6 meters/second, which is equivalent to a calculated peak pressure gradient using the simplified Bernoulli equation of 144 mmHg! Yikes! The double envelope relationship, LVOT/AV Doppler, is called the dimensionless index as it is pretty independent of ejection fraction. Normally it is >50%. An index <25% is considered criteria for severe aortic stenosis. “D” = mild aortic insufficiency. The deceleration slope is almost flat. “E” = systolic flow across the aortic valve at 3 m/s, equivalent to a peak gradient of 36 mmHg and moderate aortic stenosis. Finally “F” = severe aortic insufficiency. Note the steep deceleration curve reaching the baseline demonstrating rapid diastolic equilibration between the ascending aorta and the left ventricle. This can only happen if there is a BIG hole across the aortic valve in diastole, or just no aortic valve at all!
Questions
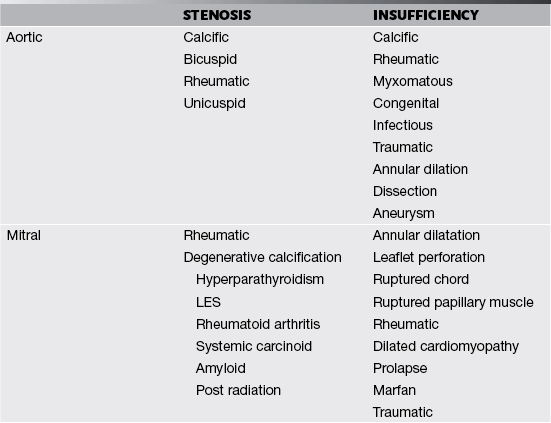
1. What is the most common cause of aortic stenosis in patients <70 years old?
2. What is the most common cause of mitral stenosis?
3. Which Doppler mode is used for velocities >2–2.5 m/s?
4. Which of the following is NOT necessary to calculate the aortic valve area using the continuity equation?
5. Which view is best for doing a CWD measurement through the aortic valve?
6. When evaluating mitral regurgitation and you see systolic flow reversal in the pulmonary veins, how would you grade the MR?
7. When evaluating valvular dysfunction with CFD, what should your scale be set to in order to avoid overreading regurgitation or stenosis?
8. What is the best view to evaluate for subvalvular and supravalvular causes of aortic stenosis?
9. When grading the severity of aortic stenosis using peak jet velocities in a patient with an ejection fraction of 10%, how would you expect your findings to compare to the true severity of the stenosis?
A The severity of the aortic stenosis will be underestimated
B The severity of the aortic stenosis will be overestimated
C The severity of the aortic stenosis will be equal to the true severity
D Peak jet velocities have no relation to the severity of aortic stenosis
E Planimetry is the only way to grade the severity of aortic stenosis
10. An IV drug abuser with endocarditis is most likely to have which valve affected?