Parenchymal Liver Disease
Hepatic Steatosis
Overview: Hepatic steatosis (fatty liver) is the most common cause of chronic liver disease in pediatric patients. It can range from simple steatosis to nonalcoholic steatohepatitis, which can progress to cirrhosis. Obesity and insulin resistance are the most common risk factors for hepatic steatosis, but it also may be associated with a number of metabolic processes and toxins (Box 90-1). The incidence is 2.6% in the general population, with a higher percentage in obese children.1 Adolescents are affected more often than younger children, with a higher prevalence in boys than girls. Fatty replacement of the liver may be diffuse or localized with areas of fatty sparing.
Clinical Presentation: Hepatic steatosis often is asymptomatic and is found incidentally on imaging performed for other reasons, such as nonspecific abdominal pain. Laboratory studies may show elevated liver enzymes (i.e., alanine aminotransferase and aspartate aminotransferase).1 Histologically, hepatocytes contain large cytoplasmic fat vacuoles filled with triglycerides. Pathologic diagnosis of hepatic steatosis is made when more than 5% of the total liver weight is replaced by fat.2
Imaging: Ultrasound evidence of hepatic steatosis includes variable hepatomegaly, increased echogenicity of the liver parenchyma when compared with the adjacent kidney, and poor visualization of the intrahepatic vascular structures (Fig. 90-1).2 Areas of fatty sparing are seen as hypoechoic foci within the fatty liver without mass effect and should not be mistaken for a mass. Ultrasound sensitivity for steatosis decreases with lower degrees of fatty infiltration. Increased obesity of the patient limits ultrasound quality because the increased extrahepatic fat further attenuates the ultrasound beam and decreases ultrasound sensitivity for liver abnormalities, including steatosis.
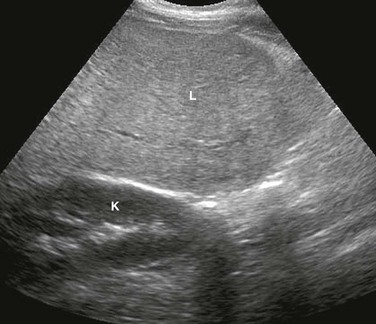
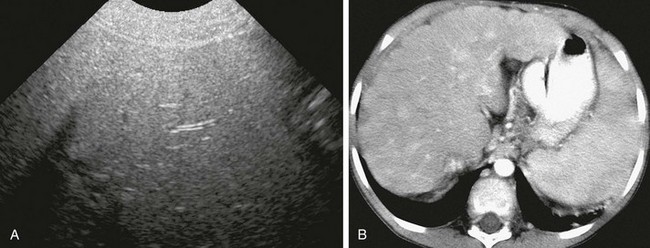
Figure 90-1 Glycogen storage disease in a 17-year-old girl.
Longitudinal ultrasound image of the right hepatic lobe demonstrates diffuse increased echogenicity of the liver (L) parenchyma compared with the adjacent kidney (K). Also notice poorly defined portal triads.
On computed tomography (CT), liver minus spleen attenuation of less than 1 Hounsfield unit (HU) can be used to screen for mild hepatic steatosis.3,4 Moderate to severe cases are indicated by liver minus spleen attenuation of less than −10 HU or absolute hepatic parenchymal attenuation less than 40 HU on noncontrast CT.4
Conventional spin-echo magnetic resonance imaging (MRI) is less sensitive than CT and ultrasound for detection of steatosis. Imaging findings include increased signal intensity on T1-weighted images and decreased signal intensity on fat-saturated and short tau inversion recovery sequences. However, chemical shift imaging with in-phase and out-of-phase sequences that demonstrates loss of signal on out-of-phase images is highly specific for diagnosing hepatic steatosis.2 This modality can be particularly helpful in differentiating this condition from neoplastic disease in equivocal cases, particularly in cases with focal fatty infiltration or sparing.
MR spectroscopy is a more recently described technique that may prove to be the most accurate method to quantitatively assess hepatic steatosis noninvasively. The area under the water and lipid peaks can be measured, allowing estimation of the hepatic fat fraction with a diagnostic accuracy of 80% to 85% in adult studies.2,5,6
Iron Deposition in the Liver
Overview: Approximately 80% of the normal iron stores of 2 to 6 g are in the form of hemoglobin, myoglobin, and enzymes that contain iron, and 20% are in the storage form of ferritin and hemosiderin. In normal situations, trace levels of iron are found in the liver, spleen, and bone marrow. When excess iron is present in the body, deposition may occur in the liver, spleen, lymph nodes, pancreas, kidneys, pituitary, and gastrointestinal (GI) tract. The body can compensate for some excess iron (10 to 20 g) without the occurrence of tissue damage, in which case the term hemosiderosis is applied. However, if functional and structural impairment of organs occurs as a result of excess iron (50 to 60 g), the term hemochromatosis is applied.
Clinical Presentation: Patients with primary hemochromatosis usually become symptomatic in the second decade of life. Symptoms are related to organ injury from excess iron deposition and may include hyperpigmentation, hepatomegaly, arthralgia, diabetes as a result of pancreatic beta cell damage, congestive heart failure, and arrhythmia. Various other complications due to chronic hemochromatosis include periportal fibrosis, cirrhosis, and hepatocellular carcinoma. However, with early diagnosis and treatment, patients may have a normal life expectancy.7 A neonatal form of primary hemochromatosis exists in which newborns (often younger than 12 hours old) present with fulminant hepatic failure, along with pancreatic and cardiac involvement.
Imaging: Ultrasound findings are nonspecific and noncontributory to the diagnosis of hemochromatosis. CT has a low sensitivity (63%) but high specificity (96%) for the diagnosis of iron overload.8 Noncontrast CT shows homogeneous increased density of the liver greater than 72 HU.8 However, coincident steatosis can lower the HU number, causing false-negative examinations. False-positive results may be seen with Wilson disease, gold therapy, or long-standing amiodarone treatment.
MR is the imaging modality of choice for confirming the diagnosis, determining severity, and monitoring therapy in persons with hemochromatosis. Excess iron deposition causes a proportional decrease in signal intensity on T1- and T2-weighted sequences and is most pronounced on gradient echo sequences. Skeletal muscle is unaffected by hemochromatosis and serves as a good internal reference to compare the signal intensity of affected abdominal organs and bone marrow, which will be hypointense to skeletal muscle. On in-phase and out-of-phase imaging, decreased signal intensity is seen in the affected organs on the in-phase sequence (an opposite finding from steatosis). The key findings in primary hemochromatosis are low signal intensity within the liver and pancreas on T2-weighted images (Fig. 90-2). In contradistinction, secondary hemochromatosis demonstrates a low signal in the liver, spleen, and bone marrow (Fig. 90-3) with sparing of the pancreas.9
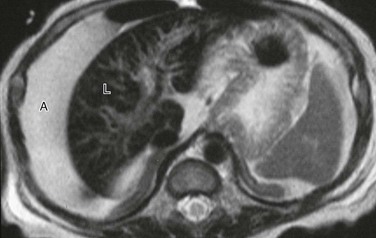
Figure 90-2 Primary hemochromatosis in an infant with multiorgan system failure.
Axial T2-weighted magnetic resonance image reveals extensive ascites (A) surrounding a liver (L) of low signal intensity. (Courtesy Lynn Fordham, MD, University of North Carolina–Chapel Hill.)
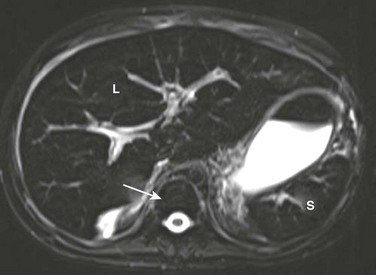
Figure 90-3 Secondary hemosiderosis due to multiple transfusions in a 10-year-old boy with a history of acute myelogenous leukemia.
A T2-weighted axial magnetic resonance image shows low signal within the liver (L) and spleen (S) because of iron deposition. Also note low signal intensity of bone marrow (arrow).
MR quantification of liver iron concentration (LIC) is possible, eliminating the need for multiple biopsies to monitor hemochromatosis. One proposed method uses multiple gradient echo sequences (T1, PD, T2, and T2*). Three regions of interest are placed on the right lobe of the liver and two on skeletal muscle; these values then can be placed in an online algorithm that estimates LIC.10 A more recently described technique utilizes breath-hold multiecho T2*-weighted sequences and generation of a line plotting the natural log of hepatic signal intensity versus time to echo (TE). The slope of the line is R2* where 1/R2* = T2*. The T2* values then can be used to stratify different grades of LIC.11
Glycogen Storage Diseases
Overview: Glycogen storage diseases are autosomal recessive disorders that involve the abnormal storage and synthesis of glycogen and the catabolism of glucose. Six major types have been described, including von Gierke (type I), Pompe (type II), Cori (type III), Anderson (type IV), McArdle (type V), and Hers (type VI).12
Clinical Presentation: von Gierke disease (VGD), which is attributed to glucose-6-phosphatase deficiency, is the most common glycogen storage disease that involves the liver. In VGD, histopathology shows excess intracytoplasmic accumulations of glycogen and small amounts of lipid within hepatocytes and proximal renal tubules. The clinical presentation of VGD includes failure to thrive, hepatomegaly, hypoglycemia, nephromegaly, jaundice, hyperlipidemia, and hyperuricemia.12 Complications of VGD include hepatocellular carcinoma and hepatic adenomas (in up to 40% of patients), which may be multiple and generally increase in number and size with age.12,13 Serial screening is required to monitor for neoplasia.
Imaging: Sonography shows hepatomegaly with diffuse hepatic hyperechogenicity because of the combination of fatty replacement and glycogen deposition (e-Fig. 90-4).14,15 Superimposed hepatic adenomas are common. They are seen as well-defined masses with variable echogenicity (depending on the relative change in liver echotexture) and often demonstrate increased sound transmission and refractory shadowing at the margins. Because hepatic attenuation is increased by glycogen but decreased by fat, the CT findings are variable depending on which factor predominates. When fatty replacement predominates, the result is diffusely low attenuation of the liver.16 Hepatic adenomas likewise vary in appearance depending on the status of the liver; they appear hypodense when found in livers of normal attenuation (e-Fig. 90-5) but are variably hyperdense in the setting of a hepatic steatosis.
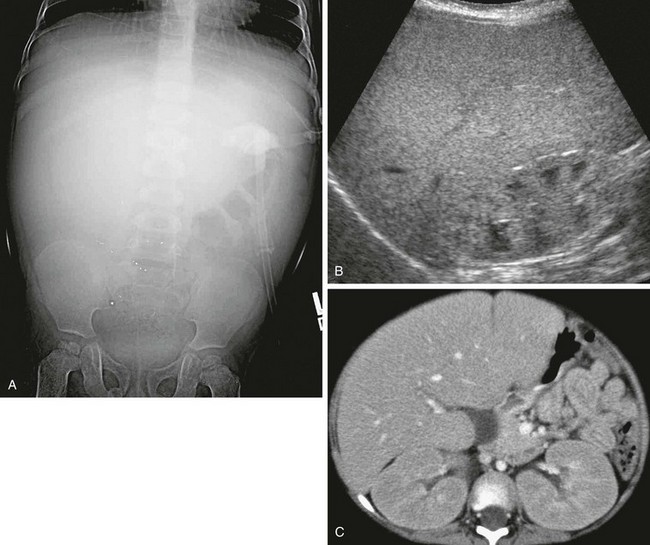
e-Figure 90-4 Glycogen storage disease in a 3-year-old boy with abdominal distention and elevated liver function enzymes.
A, An abdominal radiograph shows mass effect from diffuse hepatomegaly. Punctate radiodense foci over the lower abdomen were artifactual. B, Longitudinal ultrasound of the right upper quadrant shows hepatomegaly and diffusely increased hepatic echogenicity. The renal cortex also is hyperechoic. C, Axial contrast-enhanced computed tomography reveals hepatomegaly and nephromegaly.
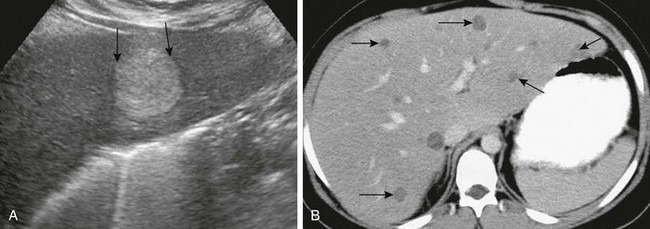
e-Figure 90-5 Glycogen storage disease in a 9-year-old boy with hepatic adenomas.
A, Longitudinal ultrasound reveals a hyperechoic mass with enhanced through-transmission and refractory shadowing at the margins (arrows), typical of a hepatic adenoma. B, Enhanced axial computed tomography demonstrates numerous scattered, low-attenuation, well-defined hepatic adenomas (arrows).
Gaucher Disease
Overview: Gaucher disease is a rare autosomal-recessive lysosomal storage disorder resulting from a deficiency of β-glucocerebrosidase enzyme. The abnormalities are the result of the accumulation of glucocerebroside in cells of the brain and reticuloendothelial system. The disease occurs worldwide, most commonly in Ashkenazi Jews.17
Clinical Presentation: Three forms of Gaucher disease exist. Type 1 is the chronic nonneuropathic form and may present in childhood but commonly is recognized in the third to fourth decade. Type 2, the acute neuropathic or infantile form, rapidly leads to death and presents with severe hepatosplenomegaly, progressive seizures, mental retardation, spasticity, strabismus, and, rarely, skeletal manifestations. Type 3, the subacute neuropathic or juvenile form, is the rarest and presents between 2 and 6 years of age with hepatosplenomegaly, mild neurological symptoms, and late-onset skeletal disease.
Bone marrow histopathology reveals Gaucher cells (kerasin-laden histiocytes). Significant replacement of liver parenchyma by Gaucher cells leads to hepatomegaly. The course of the disease includes regenerating nodules and hepatic fibrosis, leading to cirrhosis and portal hypertension.18 Splenic manifestations include infarcts and focal clusters of glucosylceramide-laden cells. Bone complications as a result of marrow replacement are common, including pathologic fractures, avascular necrosis, and osteomyelitis.
Imaging: Ultrasound, CT, and MRI demonstrate findings of hepatomegaly and possible cirrhosis (e-Fig. 90-6, A).16 On sonography, splenic lesions have variable echogenicity. They usually are hypodense on CT before administration of contrast, isointense on T1-weighted MRI, and hyperintense on T2-weighted MRI (e-Fig. 90-6, B).19
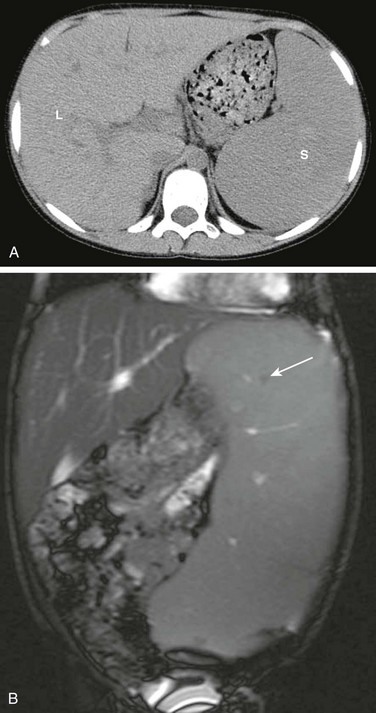
e-Figure 90-6 Gaucher disease in a 10-year-old boy.
A, Computed tomography of the abdomen without contrast demonstrates hepatosplenomegaly. B, A coronal T2-weighted abdominal magnetic resonance image demonstrates hepatosplenomegaly with small hypointense foci in the spleen suggestive of infarcts or Gaucher cells (arrow). L, Liver; S, spleen.
Treatment: Treatment of Gaucher disease with enzyme replacement therapy is possible.18 In general, the degree of liver and spleen enlargement correlates with disease severity. Thus quantification of hepatosplenomegaly (i.e., measurement of liver and spleen volume) has been used to determine treatment response.20 Liver volume can be measured with sonography, CT, or MRI. The prognosis varies with the type, extent, and severity of disease.
α1-Antitrypsin Deficiency
Overview: α1-antitrypsin deficiency is a rare autosomal recessive disorder and is the second most common cause of chronic severe pediatric liver disease. The α1-antitrypsin enzyme normally is produced by the liver, but in this disease the protein is not secreted properly. This situation leads to deficient serum levels of α1-antitrypsin, as well as buildup of abnormal protein in the hepatocytes, leading to inflammation, fibrosis, and cirrhosis.21 Associated damage to lung parenchyma is thought to be due to unhindered neutrophil elastase digestion of collagen as a result of the deficiency of this protease inhibitor.
Clinical Presentation: Although α1-antitrypsin presents most commonly in the second decade as a result of lung disease (e.g., panacinar emphysema, bullae, and bronchiectasis), it also can present in the neonatal period with jaundice that mimics biliary atresia.22 Other symptoms related to the liver include feeding difficulties, failure to thrive, ascites, and elevated liver enzymes. Rarely, children may present with symptoms of cirrhosis.
The diagnosis can be made by measuring the serum α1-antitrypsin level and is confirmed with a liver biopsy.21
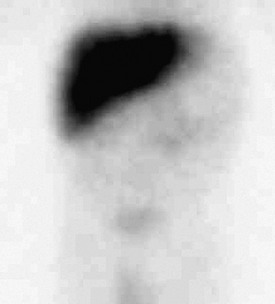
Imaging: Infants presenting in the first months of life with elevated direct bilirubin levels may undergo scintigraphy with the intention of excluding biliary atresia. In these cases, scintigraphy cannot distinguish biliary atresia from α1-antitrypsin deficiency because both conditions may show good hepatocyte uptake without biliary excretion as a result of a paucity of intralobular bile ducts in some cases of α1-antitrypsin deficiency (e-Fig. 90-7).22 Sonographic correlation may be helpful because infants with α1-antitrypsin deficiency generally have normal sonographic findings of the liver and gallbladder. Abdominal cross-sectional imaging in older children typically reveals nonspecific findings of cirrhosis.23
Treatment: No cure exists for α1-antitrypsin deficiency, and the prognosis is extremely variable depending on disease severity, age at diagnosis, and therapeutic interventions. α1-antitrypsin deficiency is second only to biliary atresia as an indication for liver transplantation in pediatric patients.21,22
Wilson Disease
Overview: Wilson disease (hepatolenticular degeneration) is a rare autosomal-recessive disorder of copper metabolism localized to chromosome 13, and in which hepatic excretion of copper into the biliary system does not occur. Normally 95% of copper in the body is bound to the serum protein ceruloplasmin.24 With copper toxicosis, accumulation begins in the liver, and when its copper binding capacity is reached, the basal ganglia, renal tubules, corneas, bones, joints, and parathyroid glands may be affected.
Clinical Presentation: Wilson disease presents most often in children older than 7 years and in young adolescents with hepatic manifestations such as jaundice and hepatomegaly, or acute fulminant hepatitis. Older adolescents and adults with unrecognized, subclinical liver involvement present with a parkinsonian movement disorder (i.e., tremor, rigidity, dysarthria, and dysphagia) or psychosis. Elevated urine copper levels and low ceruloplasmin are the best screening tests for Wilson disease but are not always diagnostic in patients who present with hepatic disease. Serum ceruloplasmin levels are in the low to normal range in 45% of patients with Wilson hepatic disease.25 A biopsy can be performed as well, in which case hepatic copper content is elevated (>250 µg/g dry weight).25
Imaging: Hepatic changes are poorly seen with cross-sectional imaging because multiple processes are occurring in the liver simultaneously: copper accumulation, fatty replacement, hepatitis, cirrhosis, and liver necrosis. The liver is hyperechoic on sonography. Copper has a high atomic number, which increases attenuation on CT. However, hepatic attenuation usually remains normal because of concurrent steatosis, which lowers attenuation and thus may negate the hyperattenuation of copper (e-Fig. 90-8).16 Hepatic MRI early in the course of the disease demonstrates hyperintensity on T1-weighted images and hypointensity on T2-weighted images, but these changes may be overshadowed once cirrhosis supervenes.16,26,27
e-Figure 90-8 Wilson disease in an 8-year-old girl.
A, Transverse hepatic ultrasound identifies diffuse hyperechogenicity with poor sound transmission due to steatosis or copper storage. B, Contrast-enhanced computed tomography reveals hepatomegaly with diffuse architectural changes of the liver due to developing cirrhosis.
Treatment: Early treatment, optimally before the patient is symptomatic, is important, because chelation with penicillamine and zinc is effective in preventing toxic copper deposition in the liver and brain. Treatment of symptomatic patients should result in rapid improvement. Lifelong chelation therapy is required, and severe cases may require liver transplantation.25
Cirrhosis
Overview: Cirrhosis is the end-stage of chronic liver disease in which parenchymal necrosis, nodular regeneration, and active parenchymal fibrosis distort normal lobular and vascular architecture.
Clinical Presentation: In children, cirrhosis is the result of many different disease processes, including biliary, postnecrotic, and metabolic causes (Box 90-2). Cirrhosis traditionally has been classified into three main categories: micronodular (Laënnec), with equal-sized nodules up to 3 mm; macronodular (postnecrotic), with variable-sized nodules ranging from 3 mm to 3 cm; and mixed cirrhosis.28,29 Micronodular cirrhosis in children is caused by disorders such as biliary obstruction, hemochromatosis, and venous outflow obstruction; macronodular cirrhosis results from disorders such as viral hepatitis, Wilson disease, and α1-antitrypsin deficiency.
Imaging: The sonographic features of cirrhosis include heterogeneous echogenicity of the liver and hepatic surface irregularity (e-Fig. 90-9, A). Other findings include regenerative nodules that may have relatively decreased echogenicity, a smaller right hepatic lobe, and compensatory enlargement of the caudate lobe and left lateral segment. Findings of portal hypertension often are seen, with collateral vessels and hepatofugal flow in the portal vein on Doppler interrogation.28,30
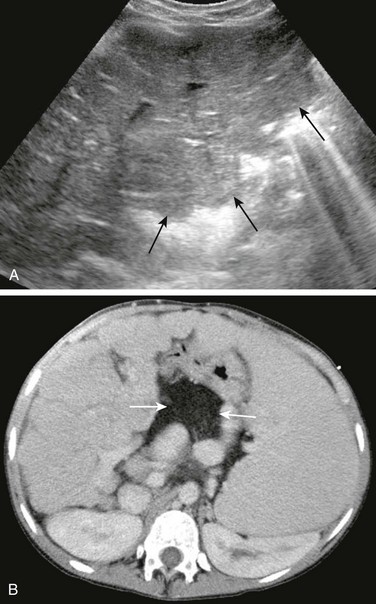
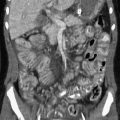
e-Figure 90-9 Cirrhosis in a 14-year-old girl with cystic fibrosis.
A, Tranverse hepatic ultrasound shows heterogeneous hepatic echogenicity and a nodular liver contour (arrows) due to cirrhosis. B, Contrast-enhanced computed tomography of the abdomen confirms hepatic nodularity, splenomegaly, and associated collateral vessels. Note fatty replacement of the pancreas (arrows).
CT shows a small or normal-sized liver with surface nodularity and heterogeneous attenuation that is exaggerated after the administration of contrast material. Decreased attenuation in areas of fatty replacement and normal attenuation in areas of fibrosis and regenerating nodules are common. CT also may demonstrate findings of portal hypertension with development of collateral pathways including coronary to gastroesophageal, paraumbilical, splenorenal, gastrorenal, and hemorrhoidal varices (Fig. 90-9, B).28,30
Typical findings on MRI include morphologic changes already described on ultrasound and CT. Regenerating nodules typically are hypointense to liver on T2-weighted sequences and variable on T1-weighted sequences. No enhancement occurs on postcontrast arterial phase imaging, although enhancement may occur on delayed images when hepatobiliary-specific agents are used (Fig. 90-10). Dysplastic nodules have variable signal intensity on T1-weighted images. Hypointense signal on T2-weighted images is seen in low-grade dysplastic nodules, and hyperintense signal is present in high-grade dysplastic nodules. On postcontrast imaging, low-grade dysplastic nodules are indistinguishable from regenerating nodules, and high-grade dysplastic nodules are indistinguishable from well-differentiated hepatocellular carcinoma (HCC).29 HCC complicating cirrhosis is characterized by variable signal on T1-weighted images and a hyperintense signal on T2-weighted images, in addition to arterial enhancement after administration of contrast material and rapid washout during the portal venous phase.29,30
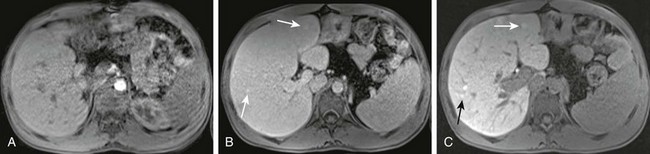
Figure 90-10 Cirrhosis with regenerative or well-differentiated dysplastic nodules in a 17-year-old boy with cystic fibrosis.
Postcontrast magnetic resonance images after administration of Eovist (gadoxetate disodium), a hepatobiliary specific contrast agent. A, The arterial phase shows nodular contour of the liver with no abnormal enhancement. B, The venous phase demonstrates subtle areas of nodular enhancement (arrows). C, The delayed phase reveals more pronounced areas of nodular enhancement (arrows).
Treatment: Complications of cirrhosis include ascites, portal hypertension, and HCC. Mortality most often is related to bleeding esophageal varices, hepatorenal syndrome, spontaneous bacterial peritonitis, and treatment related to ascites. Imaging follow-up and surveillance is performed with ultrasound. Further workup with contrast-enhanced MRI is performed when enlarging or suspicious nodules and/or increasing α-fetoprotein levels are present.29,31
Boll, DT, Merkle, EM. Diffuse liver disease: strategies for hepatic CT and MR imaging. Radiographics. 2009;29:1591–1614.
Hanna, RF, Aguirre, DA, Kased, N, et al. Cirrhosis-associated hepatocellular nodules: correlation of histopathologic and MR imaging features. Radiographics. 2008;28:747–769.
Lindback, SM, Gabert, C, Johnson, BL, et al. Pediatric nonalcoholic fatty liver disease: a comprehensive review. Adv Pediatr. 2010;57:85–140.
Pariente, D, Franchi-Abella, S. Paediatric chronic liver diseases: how to investigate and follow up? Role of imaging in the diagnosis of fibrosis. Pediatr Radiol. 2010;40:906–919.
Queiroz-Andrade, M, Blasbalg, R, Ortego, CD, et al. MR imaging findings of iron overload. Radiographics. 2009;29:1575–1589.
References
1. Alisi, A, Manco, M, Vania, A, et al. Pediatric nonalcoholic fatty liver disease in 2009. J Pediatr. 2009;155:469–474.
2. Lindback, SM, Gabert, C, Johnson, BL, et al. Pediatric nonalcoholic fatty liver disease: a comprehensive review. Adv Pediatr. 2010;57:85–140.
3. Park, YS, Park, SH, Lee, SS, et al. Biopsy-proven nonsteatotic liver in adults: estimation of reference range for difference in attenuation between the liver and spleen on nonenhanced CT. Radiology. 2011;258:760–766.
4. Boyce, CJ, Pickhardt, PJ, Kim, DH, et al. Hepatic steatosis (fatty liver disease) in asymptomatic adults identified by unenhanced low-dose CT. Am J Roentgenol. 2010;194:623–629.
5. Loomba, R, Serlin, CB, Schwimmer, JB, et al. Advances in pediatric nonalcoholic fatty liver disease. Hepatology. 2009;50:1282–1293.
6. Qayyum, A. MR spectroscopy of the liver: principles and clinical applications. Radiographics. 2009;29:1653–1664.
7. van Bokhoven, MA, van Deursen, CT, Swinkels, DW. Diagnosis and management of hereditary haemochromatosis. Br Med J. 2011;342:218–223.
8. Queiroz-Andrade, M, Blasbalg, R, Ortego, CD, et al. MR imaging findings of iron overload. Radiographics. 2009;29:1575–1589.
9. Siegelman, ES, Mitchell, DG, Rubin, R, et al. Parenchymal versus reticuloendothelial iron overload in the liver: distinction with MR imaging. Radiology. 1991;179:361–366.
10. Alústiza, JM, Artetxe, J, Castiella, A, et al. MR quantification of hepatic iron concentration. Radiology. 2004;230:479–484.
11. Chandarana, H, Lim, RP, Jensen, JH, et al. Hepatic iron deposition in patients with liver disease: preliminary experience with breath-hold multiecho T2*-weighted sequence. Am J Roentgenol. 2009;193:1261–1267.
12. Ozen, H. Glycogen storage diseases: new perspectives. World J Gastroenterol. 2007;13:2541–2553.
13. Ou, H-Y, Huang, T-L, Chen, T-Y, et al. Abdominal radiological findings in pediatric glycogen storage disease pre and post liver transplantation. Chin J Radiol. 2009;34:13–20.
14. Tchelepi, H, Ralls, PW, Radin, R, et al. Sonography of diffuse liver disease. J Ultrasound Med. 2002;21:1023–1032.
15. Pozzato, C, Dall’asta, C, Radaelli, G, et al. Usefulness of chemical-shift MRI in discriminating increased liver echogenicity in glycogenosis. Dig Liv Dis. 2007;39:1018–1023.
16. Boll, DT, Merkle, EM. Diffuse liver disease: strategies for hepatic CT and MR imaging. Radiographics. 2009;29:1591–1614.
17. Mistry, PK, Cappellini, MD, Lukina, E, et al. A reappraisal of Gaucher disease—diagnosis and disease management algorithms. Am J Hematol. 2011;86:101–115.
18. Harmanci, O, Bayraktar, Y. Gaucher disease: new developments in treatment and etiology. World J Gastroenterol. 2008;14:3968–3973.
19. Elsayes, KM, Narra, VR, Mukundan, G, et al. MR imaging of the spleen: spectrum of abnormalities. Radiographics. 2005;25:967–982.
20. Di Rocco, M, Giona, F, Carubbi, F, et al. A new severity score index for phenotypic classification and evaluation of responses to treatment in type I Gaucher disease. Haematologica. 2008;93:1211–1218.
21. Kochar, R, Fallon, MB. Pulmonary diseases and the liver. Clin Liver Dis. 2011;15:21–37.
22. Kelly, DA, Mckiernan, PJ. Metabolic liver disease in the pediatric patient. Clin Liver Dis. 1998;2:1–30.
23. Meyer, CA, White, CS, Sherman, KE. Diseases of the hepatopulmonary axis. Radiographics. 2000;20:687–698.
24. Miyajima, H. Genetic disorders affecting proteins of iron and copper metabolism: clinical implications. Intern Med. 2002;41:762–769.
25. Ferenci, P. Review article: diagnosis and current therapy of Wilson’s disease. Aliment Pharmacol Ther. 2003;19:157–165.
26. Cheon, JE, Kim, IO, Seo, JK, et al. Clinical application of liver MR imaging in Wilson’s disease. Korean J Radiol. 2010;11:665–672.
27. Kawamoto, S, Soyer, PA, Fishman, EK, et al. Nonneoplastic liver disease: evaluation with CT and MR imaging. Radiographics. 1998;18:827–848.
28. Lefton, HB, Rosa, A, Cohen, M. Diagnosis and epidemiology of cirrhosis. Med Clin N Am. 2009;93:787–799.
29. Pariente, D, Franchi-Abella, S. Paediatric chronic liver diseases: how to investigate and follow up? Role of imaging in the diagnosis of fibrosis. Pediatr Radiol. 2010;40:906–919.
30. Hanna, RF, Aguirre, DA, Kased, N, et al. Cirrhosis-associated hepatocellular nodules: correlation of histopathologic and MR imaging features. Radiographics. 2008;28:747–769.
31. Robinson, P. Hepatocellular carcinoma: development and early detection. Cancer Imaging. 2008;8:128–131.