Oxygen Equilibrium and Transport
After reading this chapter, you will be able to:
• Describe how the blood takes up, transports, and releases oxygen
• Explain the difference between arterial and venous oxygen contents, and how they are related to oxygen consumption and cardiac output
• Show how oxygen content, oxygen saturation, oxygen partial pressure (PO2), and hemoglobin concentration are related to each other
• Explain why the hemoglobin-oxygen binding process produces a sigmoid-shaped rather than linear PO2-hemoglobin equilibrium curve
• Explain why the sigmoid-shaped oxyhemoglobin equilibrium curve is physiologically advantageous
• Describe how various factors affect the release and binding of oxygen by changing affinity of hemoglobin for oxygen
• Explain why a change in the value of P50 means hemoglobin’s affinity for oxygen has changed
• Explain why changes in cardiac output affect mixed venous PO2, the difference between arterial and mixed venous oxygen content, and the amount of oxygen the tissues extract from the arterial blood each minute
• Calculate oxygen delivery rate, oxygen consumption, and tissue oxygen-extraction percentage
• Explain why arterial oxygen partial pressure (PaO2) and arterial oxygen saturation (SaO2) are insufficient indicators of tissue oxygenation
• Explain why PaO2 is a more sensitive indicator than SaO2 of changes in the lung’s ability to oxygenate the blood
• Define critical oxygen delivery threshold
• Explain why cyanosis may be absent in people who have high percentages of desaturated hemoglobin and why cyanosis may be present in people who have normal arterial oxygen contents
• Describe how anemia caused by low hemoglobin content differs physiologically from anemia produced by carbon monoxide poisoning
• Explain how fetal hemoglobin, methemoglobin, and sickle cell hemoglobin differ physiologically from normal hemoglobin


How Does Blood Carry Oxygen?
Oxygen Dissolved in Plasma
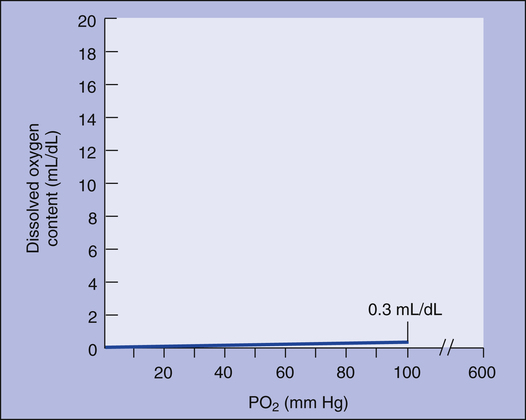
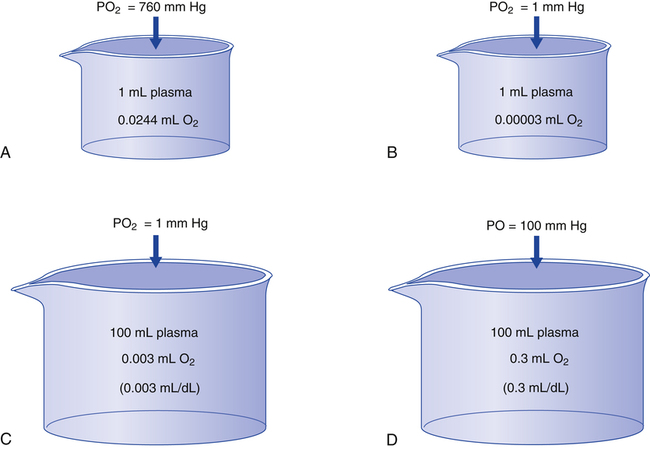
The amount (in milliliters) of O2 that dissolves in plasma is determined by the PAO2 to which the plasma is exposed (Henry’s law). The relationship between PO2 and dissolved O2 is linear (i.e., doubling or tripling PO2 doubles or triples the amount of dissolved O2) (Figure 8-1). Chapter 7 explained that the solubility coefficient of O2 is 0.0244 mL O2/mL plasma/atmosphere of pressure (atm). This means a PO2 of 760 mm Hg causes 0.0244 mL of O2 to dissolve in 1 mL of plasma at a body temperature of 37° C (Figure 8-2, A). It also means that a PO2 of only 1 mm Hg causes 0.00003 mL of O2 to dissolve in 1 mL of plasma, as shown in Figure 8-2, B (0.0244/760 = 0.00003). By convention, blood O2 content units are expressed in milliliters of O2 per 100 mL of blood, or mL/dL. (The unit mL/dL has replaced the outdated term vol%.) To express O2 content in its proper units, the amount of O2 that dissolves in 100 mL of plasma for each millimeter of mercury (mm Hg) of PO2 is 0.003 mL/dL (0.00003 mL O2/mL plasma/mm Hg × 100 mL plasma = 0.003 mL/dL/mm Hg, as shown in Figure 8-2, C). At a normal arterial partial pressure of oxygen (PaO2) of 100 mm Hg, 0.3 mL of O2 dissolves in 100 mL of plasma, or 0.3 mL/dL (PO2 of 100 mm Hg × 0.003 mL/dL/mm Hg = 0.3 mL/dL dissolved O2, as Figure 8-2, D, shows). The 0.003 factor can be used to calculate dissolved plasma O2 content at any PO2 as follows:


Oxygen Combined with Hemoglobin

Hemoglobin Molecule
As its name suggests, hemoglobin consists of heme (an iron-containing pigment) and globin (a protein). Heme is an organic molecule consisting of four symmetrically linked pyrrole rings, with a ferrous iron ion (Fe++) at its center (Figure 8-3, A-C). A pyrrole is an organic molecule organized in a ringlike structure. In addition to carbon atoms, a nitrogen atom helps form the ring. Pyrroles are building blocks for respiratory pigments that take up O2. The four pyrrole rings are linked with methylene bridges (see Figure 8-3, B) to form a porphyrin molecule, the basis for hemoglobin’s respiratory pigment. Porphyrin molecules readily form covalent bonds with metals. In this case, Fe++, which has six available sites for covalent bonding, bonds with four porphyrin molecules, leaving two unused bonding sites (see Figure 8-3, C). One of these sites bonds with a portion of the globin molecule.
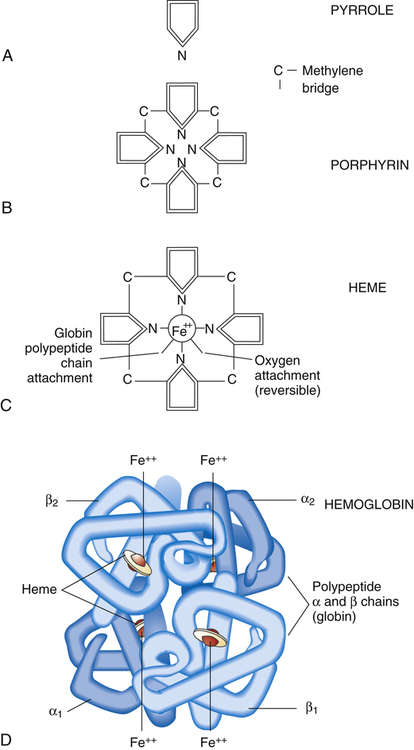
The globin molecule is a complex protein consisting of four linked amino acid chains; normal adult hemoglobin (HbA) has two alpha (α) chains, each composed of 141 amino acids, and two beta (β) chains, each composed of 146 amino acids. These amino acid chains are called polypeptides. Each polypeptide chain bonds with one heme molecule at one of the two remaining sites of the Fe++ ion. A hemoglobin molecule consists of four heme groups, each bonded with and enfolded in one of the globin molecule’s four polypeptide chains (see Figure 8-3, D). Each of the four heme groups has one remaining bonding site on the Fe++ ion. This sixth site binds rapidly and reversibly with an O2 molecule, but iron remains in the nonoxidized, ferrous state (Fe++). Because each of the four polypeptide-heme combinations can bind one molecule of O2, a single hemoglobin molecule can bind four O2 molecules. The hemoglobin molecule is called a tetramer because it contains four polypeptide subunits.
Hemoglobin Combined with Oxygen
The four heme groups of the hemoglobin molecule take up and release their O2 molecules in succession in a process known as cooperative O2 binding.1 The binding of an O2 molecule to one heme group induces a structural change in the shape of the hemoglobin molecule, which increases the affinity of the next heme subunit for O2. Binding of each O2 molecule makes the remaining bonds occur with successively greater speed and ease. Similarly, the release of the first O2 molecule facilitates the release of each remaining molecule. This cooperative binding mechanism is an efficient way to take up O2 when PO2 is increased (in the alveoli) and to release O2 when PO2 is decreased (in the body’s tissues). Cooperative binding means that a hemoglobin molecule either is bound to four O2 molecules or is bound to none. In other words, the hemoglobin molecule either is fully oxygenated or is fully deoxygenated.
Hemoglobin Saturation and Oxygen Partial Pressure


Oxyhemoglobin Equilibrium Curve
The blood plasma PO2 determines hemoglobin’s saturation with O2. The HbO2 equilibrium curve (Figure 8-4), also known as the HbO2 dissociation curve, shows the relationship between plasma PO2 (horizontal axis) and the percentage of hemoglobin saturated with oxygen (SO2) (vertical axis). Because SO2 and O2 content are directly related (as described in the foregoing section), either one can be plotted on the vertical axis of the curve (see Figure 8-4).
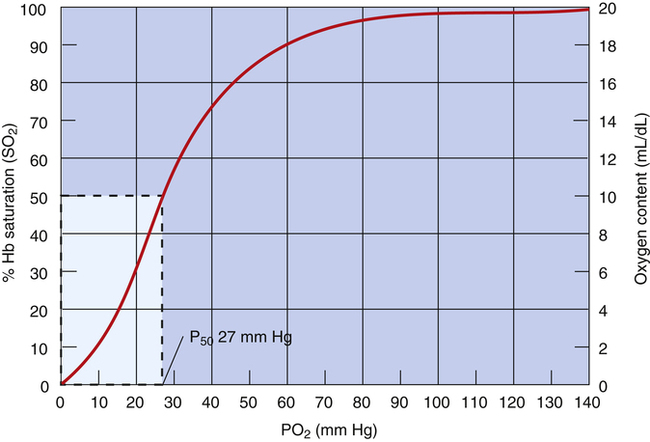
The HbO2 equilibrium curve can be constructed by exposing whole blood (which in Figure 8-4 contains 15 g Hb per 100 mL blood) to gas mixtures with successively higher PO2 values. The blood pH, PCO2, and temperature are held constant throughout the process. When hemoglobin is 100% saturated, each gram carries 1.34 mL of O2. Thus, 100% saturation corresponds to a hemoglobin O2 content of 20.1 mL/dL (15 g/dL × 1.34 mL O2/g = 20.1 mL/dL); 50% saturation corresponds to half this content, or 10.05 mL/dL.
In contrast to the relationship between dissolved O2 content and PO2 (see Figure 8-1), the relationship between PO2 and hemoglobin saturation or O2 content is nonlinear. The sigmoid shape of the HbO2 curve (see Figure 8-4) is caused by the hemoglobin molecule’s change in O2 affinity as each O2 molecule binds in succession with heme. The middle steep portion of the curve reflects the rapid loading or unloading of O2 molecules after hemoglobin’s binding or release of the first O2 molecule. Small PO2 changes cause large blood O2 content changes in the middle steep portion of the curve (20 to 60 mm Hg). In contrast, large PO2 changes cause small to minimal changes in O2 content at the extreme flatter ends of the curve, especially the flat, right end (60 to 100 mm Hg).
Physiological Advantages of the Oxyhemoglobin Equilibrium Curve Shape
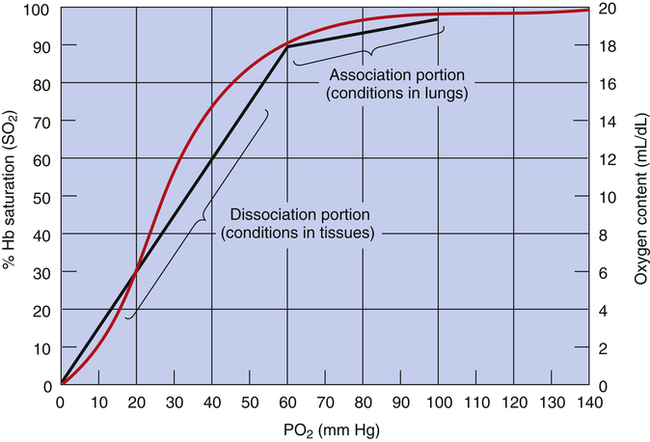
The shape of the HbO2 equilibrium curve has important physiological consequences. As shown in Figure 8-5, the upper flat section between PO2 values of 60 mm Hg and 100 mm Hg can be thought of as the association part of the curve because O2 uptake in the lung normally occurs in this PO2 range. The lower part of the curve (PO2 <60 mm Hg) can be thought of as the dissociation part of the curve because O2 release to the tissues occurs at these lower PO2 values.
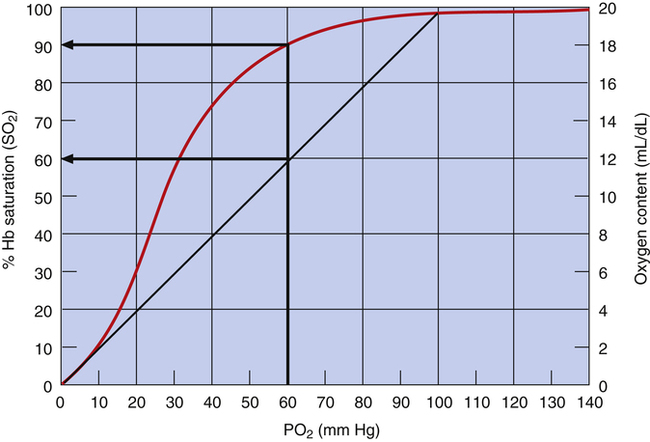
The flat association part of the HbO2 curve provides a considerable safety margin in that blood PO2 can decrease from 100 mm Hg to 60 mm Hg (Figure 8-6) and cause only a small reduction in blood O2 content; SO2 decreases only 7.5% (97.5% to 90%), corresponding to a reduction in arterial oxygen content (CaO2) of only 1.5 mL/dL (19.6 mL/dL to 18.1 mL/dL). PaO2 can decrease considerably without reducing the blood O2 content significantly, as long as this occurs on the flat part of the HbO2 curve; this is diagnostically important because a change in PaO2 reflects oxygenation problems much sooner than a change in SaO2. If the HbO2 curve were linear rather than sigmoid, a reduction in PO2 from 100 mm Hg to 60 mm Hg would greatly decrease SO2 and O2 content (Figure 8-7).
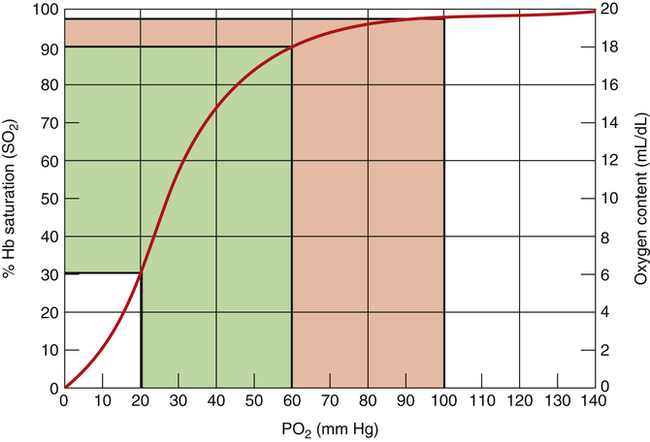
Increases in PO2 above 60 mm Hg do not add much oxygen to the blood; this is especially true for PO2 values greater than 100 mm Hg, where the HbO2 curve is virtually flat. Likewise, maximal hyperventilation is ineffective in increasing SO2 and O2 content in healthy individuals; for example, extreme hyperventilation with room air at best might lower alveolar pressure of carbon dioxide (PACO2) to about 15 mm Hg. According to the alveolar gas equation (see Chapter 7), this would produce a maximally attainable PO2 in the alveolus of about 130 mm Hg and a slightly lower PO2 in the arterial blood because of normal shunt. Even at a normal PaO2 of 100 mm Hg when breathing room air, hemoglobin is already 97.5% saturated with O2; technically, it is fully saturated at a PO2 of about 250 mm Hg2, although for all practical purposes, one can consider hemoglobin to be 100% saturated at a PO2 of 130 mm Hg. Even increasing the PaO2 to 600 mm Hg by breathing 100% O2 increases SaO2 by only 2.5%, from 97.5% to 100%. This increase adds only 0.5 mL/dL of O2 to the blood (from 19.6 mL/dL to 20.1 mL/dL). The steep dissociation part of the HbO2 curve is especially suited for releasing O2 to the tissues, where the PO2 is between 10 mm Hg and 40 mm Hg. A reduction in PO2 from 60 mm Hg to 20 mm Hg causes SO2 to decrease from 90% to about 32% (see Figure 8-6), corresponding to a reduction in CaO2 of about 11.7 mL/dL (from 18.1 mL/dL to 6.4 mL/dL). Thus, hemoglobin releases about 11.7 mL/dL of O2 into the plasma; this increases the plasma PO2, which provides the pressure gradient for O2 to diffuse into the tissues.
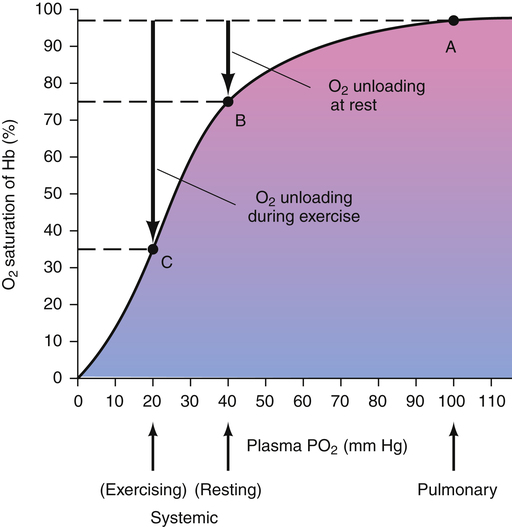
 O2 reflects the average PO2 of all body tissues and is normally about 40 mm Hg. A PO2 of 40 mm Hg corresponds with about 75% Hb saturation with O2. The body’s tissues extract about 25% of the arterial O2 content (about 5 mL/dL) under resting conditions. During heavy exercise, average tissue PO2 may decrease to 20 mm Hg or less, and the tissues may extract 70% or more of the CaO2 (Figure 8-8). Coupled with this greater O2 extraction rate, cardiac output increases considerably—six or seven times the resting level in trained athletes—which can increase O2 delivery to the tissues 20-fold.1
Affinity of Hemoglobin for Oxygen
The O2 pressure at which hemoglobin is half-saturated (P50) is a measure of hemoglobin’s affinity for O2. Normally, a PO2 of 27 mm Hg produces an SO2 of 50% when the blood temperature is 37° C, pH is 7.40, and PCO2 is 40 mm Hg (see Figure 8-4). An increased P50 means more than 27 mm Hg of PO2 is required to saturate 50% of the hemoglobin. In this instance, one can think of Hb as being more “reluctant” to bind O2, and greater pressure is required to make it do so. An increased P50 means hemoglobin’s affinity for O2 is decreased. Similarly, a decreased P50 means hemoglobin’s affinity for O2 is increased, causing it to bind O2 molecules more aggressively (i.e., in this situation, hemoglobin saturation is >50% at a PO2 of 27 mm Hg).
Oxyhemoglobin Curve Shifts
Factors that change Hb affinity for O2 shift the HbO2 curve to the left or to the right. Factors that increase Hb affinity for O2 cause a leftward curve shift, or a decreased P50; factors that decrease Hb affinity cause a rightward curve shift, or an increased P50 (Table 8-1). Figure 8-9 shows HbO2 curves for blood passing through pulmonary capillaries (left, blue curve) and through systemic tissue capillaries of heavily exercising muscle (right, red curve). As blood from the lungs travels through the systemic tissue capillaries, the HbO2 curve shifts rightward from the blue curve position in Figure 8-9 to the red curve position. This right shift reflects hemoglobin’s
TABLE 8-1
Indicators of Hemoglobin Affinity for Oxygen
| Increased Affinity | Decreased Affinity |
| Left HbO2 curve shift | Right HbO2 curve shift |
| Decreased P50 (<27 mm Hg) | Increased P50 (>27 mm Hg) |
| Greater SO2 for given PO2 | Decreased SO2 for given PO2 |
decreasing affinity for O2 as blood enters systemic capillaries; this is shown by the increased P50. Hemoglobin’s decreased affinity for O2 promotes the release of O2 into the plasma, which increases plasma PO2 and creates a gradient for O2 to diffuse into the tissues. Listed to the right of the curves are factors that cause a decrease in hemoglobin affinity (increased blood PCO2, decreased blood pH, increased blood temperature, and increased blood levels of the organic phosphate 2,3-diphosphoglycerate [2,3-DPG]).
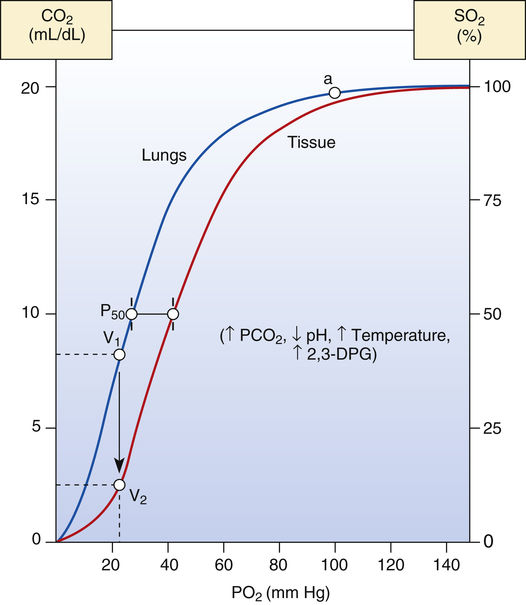
One can also examine the blue curve in Figure 8-9 to see what would happen if hemoglobin’s affinity for O2 did not change as blood passed through the systemic tissue capillaries. For example, if O2 consumption of vigorously exercising muscle decreased tissue PO2 to 22 mm Hg, as shown in Figure 8-9, and if hemoglobin’s O2 affinity did not change, the blood would release about 12 mL/dL of O2 to the tissues (from point a [20 mL/dL] to point V1 [8 mL/dL]). Instead, what actually happens is that hemoglobin’s affinity for O2 decreases at the tissue level, and it gives up much more O2 than it would otherwise release (from point a on the blue curve to point V2 on the red curve in Figure 8-9). The difference in O2 content between V1 and V2 (about 6 mL/dL) is the additional amount of O2 that hemoglobin molecules released when their affinity for O2 decreased. In other words, if hemoglobin’s affinity for O2 had not decreased, the 6 mL/dL of O2 would have remained in the blood, bound to hemoglobin molecules.
Effects of Partial Pressure of Carbon Dioxide, pH, Temperature, and 2,3-Diphosphoglycerate on Hemoglobin Affinity for Oxygen
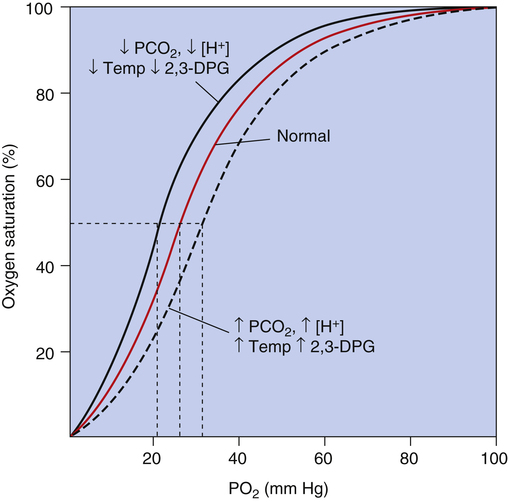
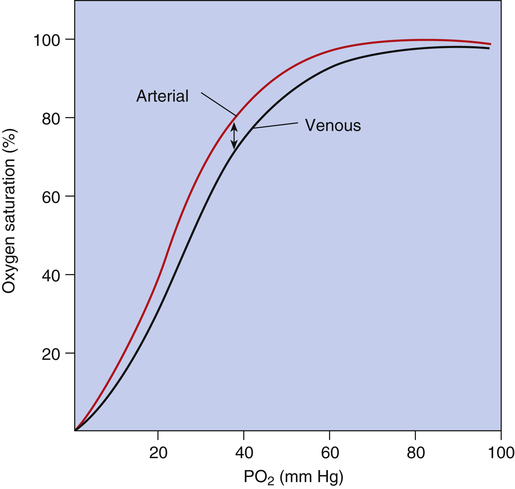
Figure 8-10 summarizes the effects of PCO2, pH, temperature, and 2,3-DPG on P50 and hemoglobin’s affinity for O2, as manifested by the position of the HbO2 curve. Curve shifts affect the dissociation (steep) portion of the curve much more than the association (flat) portion (i.e., curve shifts influence O2 release to the tissues much more than they influence O2 uptake in the lungs). The decreased affinity of hemoglobin for O2, or the rightward curve shift caused by high PCO2, is known as the Bohr effect. In normal resting conditions, changes in PCO2, [H+], temperature, and 2,3-DPG between arterial and venous blood are small. Figure 8-11 compares the HbO2 equilibrium curves for arterial and venous blood. The venous blood curve is shifted slightly to the right, causing P50 to be about 29 mm Hg compared with 27 mm Hg for arterial blood. At an average resting tissue PO2 of 40 mm Hg, the shift of the curve from the arterial position to the venous position increases the amount of O2 released to the tissues.
The effect of PCO2 on the HbO2 equilibrium curve is mediated mostly through its formation of H+; carbon dioxide reacts with water to produce H2CO3, which dissociates to produce H+. Hydrogen ions bind directly with the hemoglobin molecule, especially deoxygenated Hb, causing its affinity for O2 to decrease. Carbon dioxide also directly combines with the hemoglobin molecule, forming carbaminohemoglobin (see Chapter 9). Increased carbaminohemoglobin decreases hemoglobin’s O2 affinity, shifting the HbO2 curve to the right.
Changes in blood pH cause counteracting 2,3-DPG changes. Increased blood pH, or alkalemia, increases production of 2,3-DPG by red blood cells.3 The increase in 2,3-DPG lessens the left HbO2 curve shift caused by the increased pH. Conversely, decreased blood pH, or acidemia, decreases 2,3-DPG production. The decreased 2,3-DPG counteracts the right shift in the HbO2 curve caused by the decreased pH.
Other factors besides acidemia that decrease 2,3-DPG concentration include septic shock (bacterial blood infection) and the storage of blood for transfusions. Banked blood stored with an acid-citrate dextrose anticoagulant loses a considerable amount of 2,3-DPG over time.4 This loss increases hemoglobin affinity for O2, decreasing O2 availability to the tissues. Large transfusions of banked blood stored over several days can theoretically impair O2 release to the tissues. In terms of O2 delivery
rate to the body’s tissues, the transfusion of 2,3-DPG–depleted blood is probably physiologically insignificant.4,5
Clinical Significance of Changes in Hemoglobin Affinity for Oxygen
The normal changes that occur in hemoglobin’s O2 affinity enhance O2 uptake and release in pulmonary and systemic capillaries. As blood enters the systemic capillaries, O2 diffuses out of the plasma into the tissue cells. Plasma PO2 decreases, causing hemoglobin to release O2 in accordance with the HbO2 dissociation curve (see Figure 8-8). At the same time, hemoglobin’s affinity for O2 decreases (for reasons discussed in the previous section), and hemoglobin releases even more O2. The major physiological effect of the right shift of the HbO2 curve is that hemoglobin releases additional O2 into the plasma, which increases the pressure gradient for O2 diffusion into the tissues.
Calculating Oxygen Contents and Tissue Oxygen-Extraction Ratio
CaO2 and mixed venous oxygen content ( O2) are calculated by adding the amount of O2 dissolved in plasma to the amount combined with hemoglobin, as shown in Box 8-1. The percentage of saturation (SaO2 or
  O2), expressed as a decimal, must be multiplied by the O2-carrying capacity of hemoglobin (Hb × 1.34) to arrive at the actual amount of combined O2 present. As shown, the approximate normal values for CaO2 and
  O2 are 20 mL/dL and 15 mL/dL (Boxes 8-2 and 8-3). The arterial-venous oxygen content difference C(a-
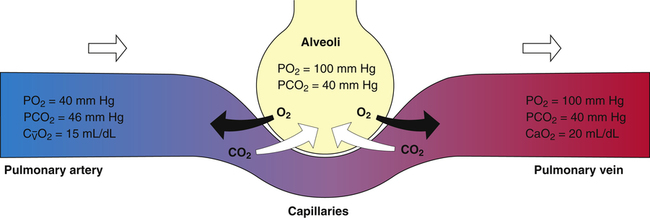
 )O2 is about 5 mL/dL (Box 8-4). This means the systemic tissues at rest extract about 5 mL of O2 from each 100 mL of blood, or about 25% of the CaO2. This oxygen-extraction ratio (O2ER), also known as the O2 utilization coefficient, is calculated as shown in Box 8-5. Figure 8-12 illustrates changes in the O2 content as mixed venous blood passes through pulmonary capillaries and becomes arterialized.
BOX 8-1 Arterial and Venous Oxygen Contents
BOX 8-2 Normal Arterial Oxygen Content
Given the following:


BOX 8-3 Normal Mixed Venous Oxygen Content
Given the following:


BOX 8-4 Arterial-Venous Oxygen Content Difference


Tissues extract about 5 mL of oxygen from each 1 dL of arterial blood.


CONCEPT QUESTION 8-5
All other factors remaining constant, what effect does decreased blood flow have on the C(a- )O2?
)O2?
Oxygen Delivery (Transport) to Tissues
Factors Affecting Oxygen Delivery and Tissue Oxygenation


Normal Oxygen Delivery Rate


The cardiopulmonary system normally delivers about 1000 mL of O2 to the tissues each minute at rest, as shown in Box 8-6. During exercise,  may easily quadruple, increasing O2 DEL to about 4000 mL per minute. The only significant way the body can increase O2 DEL to the tissues is to increase
  , because the blood is normally almost 100% saturated with O2 at rest.


Oxygen Delivery versus Oxygen Consumption
Is the delivery of 1000 mL of O2 per minute to the tissues adequate? Systemic tissues normally extract about 5 mL of O2 from every 100 mL of blood perfusing them (i.e., C[a- ]O2 is about 5 mL/dL). Similarly, the tissues extract 50 mL of O2 from every 1000 mL of blood perfusing them. Consequently, if the tissues receive 5 L of blood flow per minute, they remove a total of 250 mL of O2 from the blood each minute (total extraction = 50 mL O2/L × 5 L/min = 250 mL/min). Normal tissue O2 consumption (
 O2) is about 250 mL/min when the body is at rest; this is only one fourth of the amount of O2 delivered to the tissues each minute. This fraction is consistent with earlier observations that the tissues extract and consume about 25% of the O2 delivered to them by arterial blood. The foregoing is the basis of Fick’s equation, which relates
  , O2 consumption, and C(a-
 )O2 (Box 8-7).


Cardiac Output and Mixed Venous Oxygen Content
As illustrated in Box 8-7, Fick’s equation can be solved for  . If O2 consumption is constant (as it usually is over relatively short time periods), an increased extraction of O2 (i.e., an increased difference between arterial and venous O2 contents) implies that a decrease in
  has occurred. This implication makes sense when one considers the consequences of blood moving more slowly through tissues that continue to consume O2 at a constant rate. That is, slow moving blood gives up more O2 to the tissues because it spends more time in contact with them; this causes the blood leaving the capillaries (now venous blood) to have a relatively low O2 content. The result is a low
  O2 and an increased difference between arterial and venous O2 contents [C(a-
 )O2]. For this reason, a decrease in
  O2 or an increase in C(a-
 )O2 generally signals a reduction in
  , assuming the O2 consumption rate remains constant. In some critically ill patients, this relationship between C(a-
 )O2 and
  may be unreliable because of abnormalities in blood flow distribution through capillary beds.
Critical Oxygen Delivery Threshold
Normally, O2 DEL far exceeds tissue O2 requirements. Variations in the O2 DEL rate do not affect tissue O2 uptake.6
CLINICAL FOCUS 8-5 Effect of Anemia on Oxygenation Status
A patient has the following arterial blood gas values while breathing room air:
Hemoglobin concentration is 7 g/dL, and  is 8 L/min. Is this patient adequately oxygenated?


However, in critically ill patients, O2 DEL may fail to meet tissue O2 demands. Abnormally increased tissue O2 consumption aggravates this situation further. The point below which O2 DEL fails to satisfy the tissue demands for O2 is called the critical oxygen delivery threshold (DO2crit).6 Below DO2crit, tissue hypoxia and lactic acid accumulation occur, marking a transition from aerobic to anaerobic metabolism at the whole-body level. In addition to increased blood lactate levels, a decrease in plasma bicarbonate (a major blood buffer) is a marker for DO2crit.5 The precise DO2crit value in healthy humans is unknown and is difficult to measure experimentally.5,7 One study of healthy human volunteers did not find blood lactate evidence that DO2crit was reached even when O2 DEL decreased to 7.3 mL O2/kg body weight/min, a value that corresponds with an O2 DEL of 511 mL O2/min in an adult weighing 70 kg.7 The investigators concluded that DO2crit is below this level. Nevertheless, it is reasonable to assume that DO2crit is higher in critically ill patients, who often have increased O2 demands, and that an O2 DEL rate of 500 mL per minute would likely produce tissue hypoxia. Clinicians must take measures to ensure that a critically ill patient has an adequate  to maintain O2 DEL above the critical delivery threshold.


Blood Transfusion to Improve Oxygen Delivery
It is intuitively logical to transfuse red blood cells in critically ill anemic patients to improve O2 DEL to the tissues. Paradoxically, various clinical studies have shown that blood transfusions in these patients do not increase O2 availability to the tissues and are associated with increased mortality, independent of disease severity.4,6,8 Although anemia in critically ill patients is associated with increased mortality, correction with red blood cell transfusion does not decrease mortality.4 Transfusions may increase O2 DEL but are generally not associated with increased tissue O2 consumption and are even linked to tissue hypoxia.4,6 The latter may be the result of capillary bed occlusion by stored blood erythrocytes, which are less capable of being deformed than normal erythrocytes as they squeeze through capillaries.4,6 Healthy adults can tolerate an anemia of 3.5 to 5 g/dL without organ failure, mainly by increasing cardiac output and tissue O2 extraction.4 However, blood transfusion is important in anemic patients with coronary artery disease because (1) the heart muscle has little ability to increase its O2 extraction because it already extracts up to 90% of the O2 from the blood it receives, and (2) obstructed or narrowed coronary arteries do not permit much increase in blood flow.4
A landmark Canadian study in 1999 revealed that critically ill patients in the intensive care unit who were transfused only after hemoglobin decreased to less than 7 g/dL had significantly lower mortality rates than patients with equal disease severity who were transfused after hemoglobin decreased to less than 10 g/dL.8 Another, more recent study in the United States, the CRIT study,9 confirmed that the number of blood transfusions a patient receives is independently associated with increased risk of death—even in patients with equal disease severity, more transfusions were associated with higher mortality. Some proposed reasons for increased mortality rates include (1) the release of proinflammatory mediators by white blood cells of stored blood; (2) transfusion-related changes in the ability to mount an immune response, which predisposes the recipient to infections; and (3) decreased erythrocyte deformability.4
Anemia is so common in critically ill patients that it is almost an expected problem; it is thought to be due in large part to overhydration of patients commonly seen in intensive care units.8 The general consensus seems to be that in patients with hemoglobin levels greater than 7 g/dL who are not actively losing blood and are not hypovolemic, blood transfusions are of little or no benefit and expose patients to a potentially toxic substance.8


Hemoglobin Abnormalities
Carboxyhemoglobin
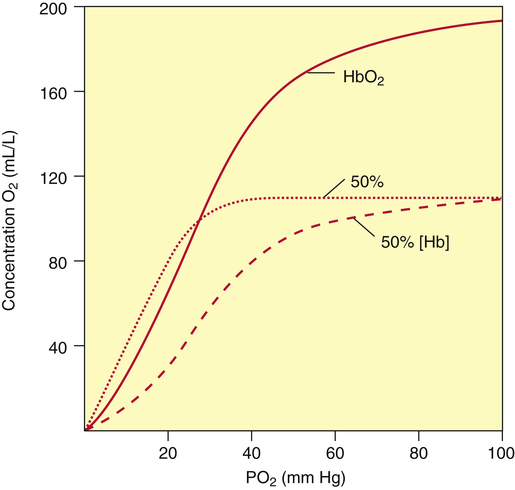
CO not only decreases the amount of hemoglobin available for O2 transport, but it also hampers the ability of hemoglobin to release O2 to the tissues. CO increases hemoglobin’s affinity for O2, shifting the HbO2 equilibrium curve to the left, as shown in Figure 8-13. The solid curve in Figure 8-13 represents normal arterial blood with normal O2 content. The dashed curve represents anemic blood with normal arterial saturation but half-normal O2 content because hemoglobin concentration is half-normal. The dotted curve represents blood with normal hemoglobin concentration but with half of it blocked by CO. As in the anemic curve, half of the normal amount of hemoglobin is available for combination with O2. However, CO also increases hemoglobin’s affinity for O2, as indicated by the left shift of the dotted curve, which means tissue PO2 must decrease to a very low level before hemoglobin releases O2 to the plasma. This lower tissue PO2 is especially dangerous to heart muscle because, in contrast to other tissues, heart muscle extracts 70% to 90% of the O2 present in the blood. Especially in people with decreased coronary blood flow, the impaired release of O2 caused by the effect of CO on the HbO2 curve may cause severe hypoxia of heart muscle.
Hemoglobin Variants
Fetal Hemoglobin
Hemoglobin present in the fetus has a high affinity for O2, apparently because 2,3-DPG does not bind with HbF.2 HbF and HbA without 2,3-DPG have similar left-shifted HbO2 equilibrium curves.2 HbF of normal-term infants has a P50 of about 22 mm Hg. A cyanotic newborn infant has a much lower arterial PO2 than an equally cyanotic adult. It is fortunate that HbF has a high affinity for O2 because the maximum PO2 of fetal blood is less than 40 mm Hg. Despite the low PO2, HbF allows fetal blood to carry adequate amounts of O2. Because of its high affinity for O2, HbF vigorously takes up O2 from the plasma at the placenta. This lowers fetal plasma PO2, promoting O2 transport across the placenta by maintaining an O2 diffusion gradient. By 6 months after birth, most HbF has been replaced with HbA.
Methemoglobin
Methemoglobin (metHb) is formed when the ferrous ion (Fe++) of normal HbA is oxidized to the ferric form (Fe+++). metHb cannot carry O2; in addition, its presence in the blood increases the remaining normal hemoglobin’s affinity for O2, hindering its ability to release O2 to the tissues. Some methemoglobin is normally formed in the blood through spontaneous autooxidation, which is kept in check by antioxidant proteins in the erythrocyte.2 Methemoglobinemia (high blood levels of metHb) can be caused by nitrate poisoning or toxic reactions to oxidant drugs. Normally, the antioxidant protein in the erythrocyte instantly reverses any Fe++ oxidation that occurs, maintaining a metHb content less than 1%. However, this protein is only 50% to 60% as active in newborn infants as in adults, making newborns, especially premature infants, more susceptible to developing methemoglobinemia.2 Well water, which commonly contains nitrates, is a cause of methemoglobinemia in infants in rural areas. Methemoglobinemia produces a slate-gray cyanotic appearance and arterial blood that is chocolate brown in color. Generally, acquired methemoglobinemia resolves spontaneously with the removal of the offending agent; symptomatic cases can be treated with an infusion of methylene blue, a methemoglobin reduction agent.2