Oxygen and Carbon Dioxide Transport
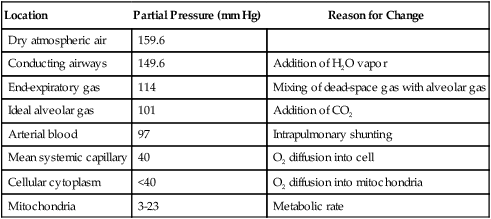
A The partial pressure of oxygen (Po2) decreases from 159.6 mm Hg in dry air at sea level to approximately 3 to 23 mm Hg in the mitochondria of the cell (Table 7-1).
TABLE 7-1
| Location | Partial Pressure (mm Hg) | Reason for Change |
| Dry atmospheric air | 159.6 | |
| Conducting airways | 149.6 | Addition of H2O vapor |
| End-expiratory gas | 114 | Mixing of dead-space gas with alveolar gas |
| Ideal alveolar gas | 101 | Addition of CO2 |
| Arterial blood | 97 | Intrapulmonary shunting |
| Mean systemic capillary | 40 | O2 diffusion into cell |
| Cellular cytoplasm | <40 | O2 diffusion into mitochondria |
| Mitochondria | 3-23 | Metabolic rate |
B Four body systems are responsible for the movement of oxygen from the atmosphere to the mitochondria:
C Specifics regarding movement of oxygen from the atmosphere into the blood are detailed in Chapter 2.
A Approximately 90% of the oxygen consumed is used as the final electron acceptor of the electron transport chain in the mitochondria of the cell.
B The actual reaction produces H2O:
< ?xml:namespace prefix = "mml" />
C Without the presence of O2, aerobic metabolism is stopped, whereas anaerobic metabolism continues, resulting in the production of lactic acid.
D The reaction of O2 with H+ to form H2O allows the formation of the high-energy phosphate group adenosine triphosphate (ATP).
E The yield of ATP molecules from aerobic metabolism significantly exceeds that from anaerobic metabolism:
| Aerobic Metabolism | Anaerobic Metabolism |
| Glucose | Glucose |
| ↓ | ↓ |
| Pyruvic acid | Pyruvic acid |
| ↓ | ↓ |
| CO2 + H2O + 38 moles of ATP | Lactic acid + 2 moles of ATP |
F Mitochondrial Po2 values of <2 mm Hg inhibit aerobic metabolism.
III Carriage of Oxygen in the Blood
A Oxygen is carried in two distinct compartments in the blood:
B Volume physically dissolved in plasma
1. According to the Bunsen solubility coefficient for oxygen, 0.023 ml of oxygen can be dissolved in 1 ml of plasma for every 760 mm Hg Po2.
2. Simplifying the above factor to the number of milliliters of oxygen per milliliter of plasma per mm Hg Po2 equals:
3. Because the oxygen content normally is expressed in volumes percent, multiplying 0.00003 ml of oxygen per milliliter of plasma by 100 results in the common factor expressing the quantity of O2 dissolved in plasma:
4. Thus, multiplying the Po2 of blood by 0.003 will yield the number of milliliters of oxygen physically dissolved in every 100 ml of blood (vol%):
C Hemoglobin: Structure and capacity to react with various substances:
1. Composition of the normal hemoglobin molecule:
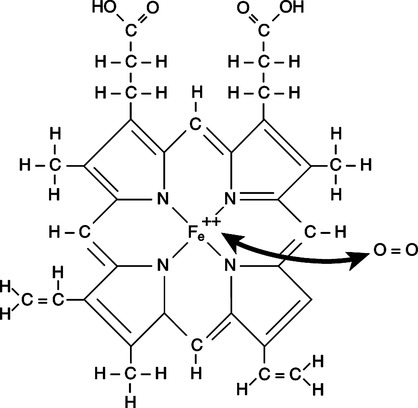
a. Four porphyrin rings, called hemes, each with a central iron atom (Figure 7-1).
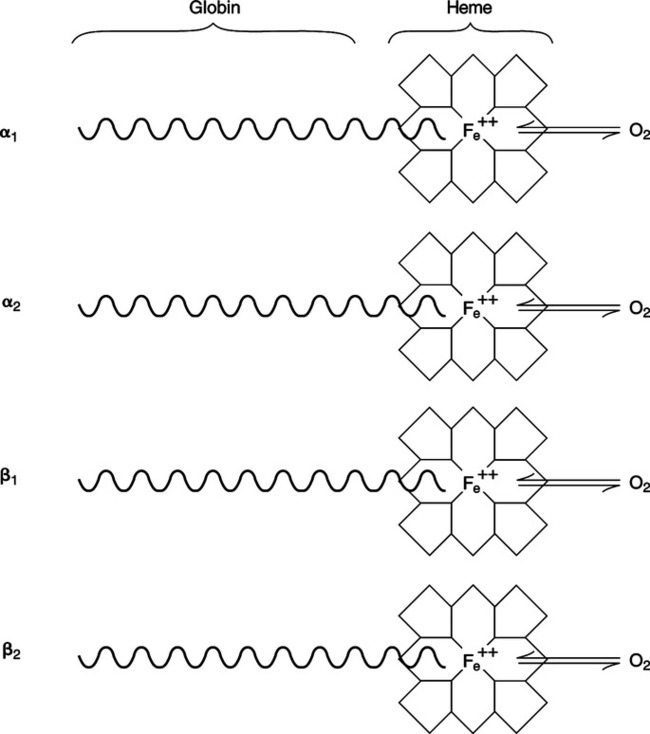
b. Four polypeptide chains: two α chains and two β chains, called the globin portion of the molecule.
c. Each chain is twisted and folded into a basket in which a heme is located.
d. Each iron atom of the heme is bonded via four covalent bonds to the porphyrin ring and via one covalent bond to the globin portion of the molecule. One bond is available to combine with oxygen (Figure 7-2).
e. The four chains are held together by chemical bonds between unlike chains (e.g., α to β and β to α).
f. The hemoglobin molecule undergoes structural changes when it reacts with oxygen.
g. The total molecule contracts when it combines with oxygen and expands when oxygen is released.
h. The site of carbon dioxide attachment is the amino group (R-NH2) on the porphyrin rings (R represents the rest of the molecule).
i. The terminal imidazole (R-NH) groups also are available to buffer H+ (see Chapter 15).
(1) The importance of hemoglobin as a buffer is second only to that of the HCO3−/H2CO3 buffer system.
(2) The buffering capacity of the hemoglobin molecule depends on attachment of oxygen to the iron portion of the heme.
(3) Oxygenated hemoglobin (oxyhemoglobin) is a stronger acid but weaker buffer than unoxygenated hemoglobin (deoxyhemoglobin).
(4) Thus the buffering capacity of venous blood is greater than that of arterial blood.
2. The molecular weight of hemoglobin is approximately 64,500 g.
3. Because oxygen attaches to each of the four iron atoms in the hemoglobin molecule, 4 gram molecular weights (GMWs) or 4 moles of oxygen combine with 64,500 g of hemoglobin (1 mole).
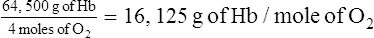 (5)
(5)4. One mole of oxygen can combine maximally with 16,126 g of hemoglobin.
5. Because 1 GMW of oxygen at standard temperature and pressure occupies 22.4 L:
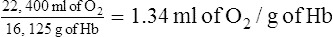 (6)
(6)6. Thus at 100% saturation, 1.34 ml of oxygen can combine with each gram of hemoglobin.
7. The actual volume of oxygen carried attached to hemoglobin is equal to:
8. As hemoglobin combines with oxygen to form HbO2, the complex takes on a negative charge, and as a result it forms a salt with K+, or KHbO2.
9. When O2 is released at the tissue level, the K+ is also released, and the Hb buffers H+, forming HHb (reduced hemoglobin).
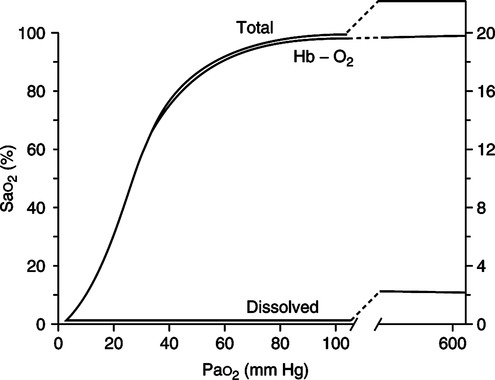
1. The total oxygen content of blood is equal to the volume of oxygen physically dissolved in plasma plus the amount chemically combined with hemoglobin (Figure 7-3).
2. Mathematically this statement is equal to:
E Table 7-2 illustrates the effects of Po2, Hb, and Sao2 on oxygen content.
TABLE 7-2
Effect of PO2, Hb, and Sao2 on Oxygen Content (CaO2)*
| PO2 (mm Hg) | Hb (g%) | Sao2 (%) | CaO2 (vol%) |
| 100 | 15 | 98 | 20.0 |
| 75 | 15 | 94 | 19.3 |
| 50 | 15 | 84 | 17.0 |
| 100 | 10 | 98 | 13.4 |
| 100 | 5 | 98 | 6.9 |
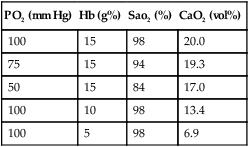
*A decrease in Hb has a greater effect on O2 content than a decrease in PO2.
From Pierson DJ, Kacmarek RM: Foundations of Respiratory Care, Churchill Livingstone, New York, 1992. Churchill Livingstone
F Oxyhemoglobin dissociation curve (Figure 7-4)
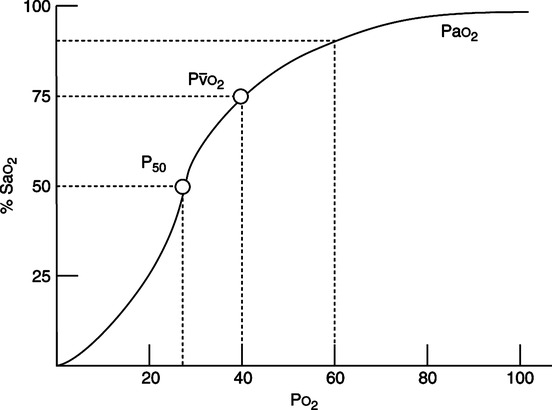
1. The overall sigmoidal shape of the curve is a result of the varied affinities of the four oxygen-bonding sites on the hemoglobin molecule.
a. The affinity of the last site bound generally is considerably less than the other three sites.
b. The affinity of the first site also is less than that of the second or third sites.
2. The steep aspect of the curve is that portion where minimal changes in Po2 normally result in large increases in HbO2% saturation and therefore oxygen content.
a. Increasing the saturation from 50% to 75% normally necessitates only a 13-mm Hg Po2 increase, whereas increasing the saturation from 75% to 100% normally necessitates well over a 100-mm Hg Po2 increase.
3. P50 is defined as that Po2 at which the hemoglobin is 50% saturated with oxygen. Normally the P50 is equal to 27 mm Hg (see Figure 7-4).
a. An increased P50 indicates a shift of the oxyhemoglobin dissociation curve to the right, resulting in a decreased hemoglobin affinity for oxygen (greater unloading of oxygen at the tissue and decreased loading at the alveoli).
b. A decreased P50 indicates a shift of the oxyhemoglobin dissociation curve to the left, resulting in an increased hemoglobin affinity for oxygen (decreased unloading of oxygen at the tissue and increased loading at the alveoli).
c. Hemoglobin is considered an allosteric enzyme because of the two conformational structures it assumes (deoxyhemoglobin and oxyhemoglobin). Allosteric enzymes are substances with two binding sites: one active site and one secondary site. The binding of substances at the secondary site can affect the affinity of binding at the active site.
d. Box 7-1 lists factors that alter the affinity of hemoglobin for oxygen by affecting the secondary site.
4. Various substances affect the shape of the oxyhemoglobin dissociation curve. Shifting the position of the curve alters the binding capabilities of hemoglobin. A shift to the right decreases the affinity of hemoglobin for oxygen, whereas a shift to the left increases affinity of hemoglobin for oxygen.
G Bohr effect: The effect of carbon dioxide or [H+] on uptake and release of oxygen from the hemoglobin molecule. The effect is relatively mild.
1. As seen earlier, carbon dioxide and [H+] cause a shift in the oxyhemoglobin dissociation curve.
2. At the systemic capillary bed, increased carbon dioxide and [H+] moving into the blood decrease hemoglobin affinity for oxygen and increase the volume of oxygen released at the tissue level.
3. At the pulmonary capillary bed, decreased carbon dioxide and [H+] levels increase hemoglobin affinity for oxygen, thus increasing the volume of oxygen picked up at the pulmonary level.
1. Carbon monoxide attaches to hemoglobin at the same site as O2.
2. The affinity of hemoglobin for carbon monoxide is 200 times greater than its affinity for O2.
3. In addition, carboxyhemoglobin (HbCO) shifts the oxyhemoglobin dissociation curve to the left, decreasing the ability of hemoglobin to unload oxygen.
1. There are >100 abnormal forms of hemoglobins.
2. Twelve of these have an effect on the affinity of hemoglobin for oxygen. However, the two most important are fetal hemoglobin and methemoglobin.
3. Oxygen consumption is altered Fetal hemoglobin has two γ chains instead of β chains, which results in a decreased P50 (shift to the left).
4. Fe atoms oxidized from the ferrous to the ferric state form methemoglobin; this also results in a decreased P50 (shift to the left).
J An increased affinity of Hb for O2 means that the hemoglobin carries more O2, but the hemoglobin does not readily release O2 at the tissue level. Conversely, a decreased affinity of Hb for O2 means that the hemoglobin carries less O2, but the hemoglobin does readily release O2 at the tissue level.
A The quantity of oxygen available to the tissue depends on oxygen content and cardiac output (see Figure 7-4).
B The amount of oxygen transported to tissue is equal to:
C In the normal healthy adult, oxygen content equals approximately 20 vol%, and cardiac output is approximately 5 L/min. Thus:
D Oxygen availability is most significantly affected by the hemoglobin level and cardiac output.
E Normal oxygen transport ranges from approximately 900 to 1200 ml/min at rest.
F Oxygen transport may be decreased by any of the following (Table 7-3):
TABLE 7-3
Effect of Cardiac Output and O2 Content on Oxygen Transport*
| CaO2 (vol%) | Cardiac Output (L/min) | O2 Transport (ml/min) |
| 20 | 5 | 1000 |
| 15 | 5 | 750 |
| 10 | 5 | 500 |
| 20 | 10 | 2000 |
| 20 | 2.5 | 500 |
| 15 | 10 | 1500 |
| 15 | 2.5 | 375 |
| 10 | 10 | 1000 |
| 10 | 2.5 | 250 |
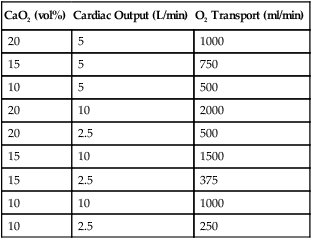
*Reductions in CaO2 and cardiac output can affect O2 transport. Marked reductions in O2 transport occur if CaO2 and cardiac output are simultaneously reduced.
From Pierson DJ, Kacmarek RM: Foundations of Respiratory Care, Churchill Livingstone, New York, 1992. Churchill Livingstone
A The normal arterial oxygen content is 20 vol%.
B The normal mixed venous oxygen content is approximately 15 vol%.
 o2 is 5 vol%.
D If the cardiac output is 5 L/min, the body consumes 250 ml/min of oxygen.
E Oxygen consumption in the adult varies from approximately 150 to 350 ml/min (basal metabolic level), depending on body size and metabolic rate.
F Oxygen consumption is altered by:
G In the adequately perfused normothermic patient who is not shivering or seizing, oxygen consumption is equal to approximately 3.0 ml/kg body weight/min.
VI Production of Carbon Dioxide
A Carbon dioxide is produced by the metabolism of all food.
B In addition, carbon dioxide is produced in the conversion of glucose to fatty acids.
C Normal carbon dioxide production is approximately 120 to 280 ml/min, depending on body size and metabolic rate, or approximately 2.4 ml/kg/min.
VII Carriage of Carbon Dioxide in the Blood
A Carriage in plasma occurs in three distinct ways (Figure 7-5):
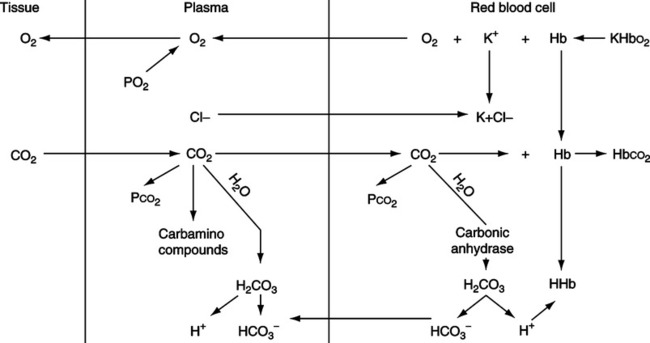
1. Carbon dioxide is dissolved in plasma as Pco2, which is in equilibrium with the Pco2 in red blood cells (RBCs).
2. Carbon dioxide is carried predominantly as bicarbonate (HCO3−) formed in the RBCs and by the kidney. The HCO3− levels in plasma are in equilibrium with the HCO3− in RBCs.
a. Plasma carbon dioxide reacts minimally with water, forming carbonic acid, which dissociates into H+ and HCO3−:
 (10)
(10)b. The H+ formed is buffered in the plasma and therefore causes a mild decrease in pH (venous blood).
c. The previous reaction’s point of equilibrium (equation 10) is shifted to the left in the plasma, therefore favoring formation of the reactants.
d. The mathematical relationship between dissolved CO2 and H2CO3 is:
3. Carbon dioxide is attached to plasma proteins, forming carbamino compounds similar to those formed when CO2 combines with hemoglobin.
a. Carbon dioxide reacts with the terminal amino groups on the plasma proteins (R-NH2):
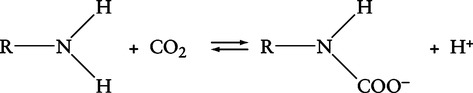 (12)
(12)(R indicates the remainder of the plasma protein)
b. Most of the H+ liberated is buffered and therefore causes a mild decrease in the pH (venous blood).
c. The ionization state of the amino groups affects their ability to bond with carbon dioxide. If the NH2 groups are oxidized to NH3+, their ability to combine with carbon dioxide is significantly decreased.
B Carriage of carbon dioxide in RBCs occurs in three distinct ways (see Figure 7-5):
1. As dissolved Pco2 in equilibrium with plasma Pco2.
2. As HCO3− formed in the RBC.
a. The rate of the reaction shown in equation 10 is significantly increased as a result of the presence of the enzyme carbonic anhydrase (CA). The point of equilibrium is shifted to the right, favoring formation of the products:
 (13)
(13)b. As increasing levels of HCO3− are formed in the RBC, HCO3− diffuses into the plasma. As HCO3− diffuses, there is an imbalance of electric charges inside the RBC, causing C1− to move into the RBC. This process is referred to as the chloride shift or Hamburger phenomenon. The Cl− diffusing into the RBC associates with the K+ released as the hemoglobin molecule gives up O2 and buffers H+.
3. As carbon dioxide attached to the terminal amino (R-NH2) groups of the hemoglobin molecule. This reaction is the same as that shown in equation 12. The H+ released from the formation of HCO3− again must be buffered.
a. In RBCs, the imidazole groups on the hemoglobin molecule are the primary buffer.
b. The ability of the imidazole groups to buffer is affected by oxyhemoglobin saturation. With oxygen bound to the heme, the imidazole groups are poor buffers. Without oxygen attached to the heme, the imidazole groups are good buffers.
c. As oxygen attaches to the heme, more R-NH2 groups will exist in the R-NH3+ form. The tendency for carbon dioxide to attach to the R-NH3+ form is less than to the R-NH2 form.
A Figure 7-6 illustrates the Haldane effect, which is defined as the effect of oxygen on carbon dioxide uptake and release.
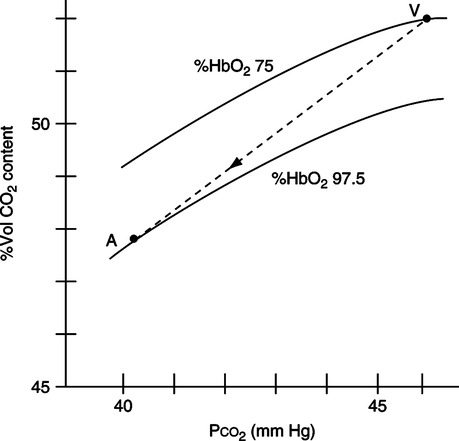
B As Po2 increases at the pulmonary capillary bed, the ability of hemoglobin to carry carbon dioxide is decreased because more amino groups exist in the oxidized R-NH3+ state. This allows large volumes of carbon dioxide to be released at the pulmonary capillary bed.
C As the Po2 decreases at the tissue level, the ability of hemoglobin to carry carbon dioxide is increased because more amino groups exist in the reduced R-NH2 form. This allows large volumes of carbon dioxide to be picked up at the systemic capillary bed (see Figure 7-6).
D The Haldane effect facilitates carriage of the normal 4 vol% (200 ml/min) of carbon dioxide picked up from the tissue and released at the lung.
IX Quantitative Distribution of Carbon Dioxide
A Percentage of carbon dioxide carried in each compartment:
1. Approximately 90% of carbon dioxide in blood exists as HCO3−.
2. Approximately 5% of carbon dioxide in blood exists as carbamino compounds.
3. Approximately 5% of carbon dioxide in blood exists as dissolved Pco2.
B Percentage of carbon dioxide exhaled from various compartments:
A Total carbon dioxide is an expression of the sum of HCO3− plus dissolved CO2.
B Total carbon dioxide may be expressed in millimoles per liter (mmol/L), milliequivalents per liter (mEq/L), or vol%.
 (17)
(17)XI Respiratory Quotient, Respiratory Exchange Ratio, and Ventilation/Perfusion Ratio
A The respiratory quotient (RQ) is defined as the volume of carbon dioxide produced divided by the volume of oxygen consumed per minute; normally the RQ equals:
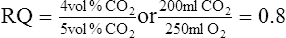 (18)
(18)B The RQ is an expression of internal respiration.
C The respiratory exchange ratio (R) is defined as the volume of carbon dioxide moving from the pulmonary capillaries into the lung divided by the volume of oxygen moving from the lung into the pulmonary capillaries:
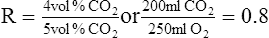 (19)
(19)D R is an expression of external respiration.
E Under normal circumstances RQ and R are equal, with a mean value of approximately 0.8.
F The ventilation/perfusion ( /
/ ) ratio is equal to the minute alveolar ventilation divided by the minute cardiac output:
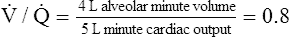 (20)
(20)G  /
/ is equal to RQ and R under normal circumstances.
H It is the alveolar ventilation and the cardiac output that maintain the RQ and R equal.