[level-membership-for-internal-medicine-category]
Chapter 1 Overview of Tracer Kinetics and Cellular Mechanisms of Uptake
CELLULAR UPTAKE OF MYOCARDIAL PERFUSION AGENTS
Thallium-201
Thallium-201 (201Tl) is a radioactive potassium analog. The initial myocardial uptake of 201Tl is dependent upon myocardial blood flow and its first-pass extraction fraction, which is approximately 85% under resting flow conditions.1,2 At higher flow rates, such as those obtained during pharmacologic vasodilation, the extraction of 201Tl is not linear with respect to flow.3 The plateau in extraction results in an underestimation of the true maximal flow. This phenomenon is true of all diffusible flow tracers and will be discussed in detail in the next section of this chapter.
The intracellular uptake of 201Tl predominantly involves active exchange across the sarcolemmal membrane of the myocytes via the Na+/K+ adenosine triphosphate (ATP) transport system.4 Because this system is energy dependent, thallium transport can only occur in viable myocardium. Once inside the myocyte, 201Tl is not bound intracellularly and can diffuse back out into the circulation. As will be discussed in detail later, these uptake and redistribution kinetic properties form the basis of clinical assessment of myocardial perfusion and viability using 201Tl. Although the introduction of 201Tl in the mid-1970s represented a major advance in nuclear cardiology, its physical properties are not ideal for gamma camera imaging. The low-energy 69- to 80-keV x-ray photopeak can result in attenuation artifacts and the relatively long 73-hour half-life limits the maximal dose that can be safely administered.
Monovalent Cationic Technetium-99m-Labeled Tracers
Over the years, there have been a number of 99mTc-labeled myocardial perfusion imaging agents that have been investigated as replacements for 201Tl. The most successful ones to date are the lipophilic monovalent cationic agents, 99mTc-sestamibi (sestamibi, Cardiolite) and 99mTc-tetrofosmin (tetrofosmin, Myoview), that are now widely used for clinical studies. Following an intravenous injection, the first-pass extraction fractions of sestamibi and tetrofosmin are approximately 65% and 54%, respectively, under basal resting flow conditions.5,6 Because of their lower extraction fractions compared with 201Tl, the plateau in tracer uptake observed during hyperemia occurs at lower flow rates. The effect of this “roll-off” in extraction at lower flow rates is to diminish the relative difference in tracer activities between high-flow regions and those myocardial regions subtended by a coronary stenosis, making it more difficult to detect milder stenoses.
Although these agents are members of two distinct chemical classes of compounds, isonitriles and diphosphines, respectively, they share several common properties. Unlike 201Tl, which utilizes a specific membrane-active transporter, these tracers are passively drawn across the sarcolemmal and mitochondrial membranes along a large electronegative transmembrane potential gradient, owing to their lipophilicity and positive charge.7 Once inside the mitochondria, these cationic tracers are tightly bound by the potential gradient such that there is a very slow net efflux resulting in prolonged myocardial retention times. Although ATP is not directly required for the intracellular sequestration of cationic tracers, as it is for 201Tl, the influx and retention of these tracers are energy dependent because the presence of a normal electronegative transmembrane gradient is required. With irreversible injury, the mitochondrial and sarcolemmal membranes are depolarized, and the uptake of these cationic tracers is impaired.8 Accordingly, like 201Tl, the cationic 99mTc-labeled agents can be used to assess myocardial viability.
In addition to the lower plateau in extraction mentioned, another disadvantage to both sestamibi and tetrofosmin is the problem of photon scatter from the adjacent liver that can interfere with the interpretation of myocardial perfusion defects, particularly in the inferior left ventricular wall. Accordingly, there has been renewed interest in recent years to design improved cationic 99mTc-labeled tracers that exhibit more rapid liver clearance. 99mTc-(N)(PNP5)(DBODC5)+ (DBODC5) is a lipophilic nitride that is rapidly taken up and retained by the myocardium in a manner that is mechanistically similar to sestamibi and tetrofosmin. However, studies in both rats and dogs demonstrated that DBODC5 cleared more rapidly from the liver than either of these other cationic tracers, with virtually no liver activity observed after only 1 hour.9,10 The first-pass extraction fraction of DBODC5 is intermediate to that of sestamibi and tetrofosmin.10 Although there is no improvement in the ability of DBODC5 to track myocardial blood flow at hyperemic flow rates, its more favorable biodistribution properties offer a potential advantage that warrants further investigation.
Another new lipophilic cationic tracer with improved biodistribution and very rapid liver clearance is 99mTc-[N(MPO)(PNP5)]+ (MPO). The myocardial uptake of MPO in Sprague Dawley rats was reported to be between that of sestamibi and DBODC5 over 2 hours.11 Interestingly, the heart-liver ratio of MPO at 30 minutes after injection was more than twice that of DBODC5 and approximately 4 times higher than that of sestamibi.11 With such rapid liver clearance, clinically useful images might be obtainable as early as 15 minutes post injection. At the present time, the first-pass extraction fraction studies have not been conducted using MPO.
Neutral Lipophilic Tracers
99mTc-teboroxime (teboroxime) is a member of a class of neutral lipophilic molecules known as BATOs (Boronic acid Adducts of Technetium diOxime). After intravenous injection, the initial instantaneous uptake of teboroxime is high, with a first-pass extraction fraction of approximately 90%—higher than even 201Tl.12,13 However, unlike the cationic 99mTc-labeled myocardial perfusion tracers discussed earlier that are retained in the myocardium, teboroxime exhibits rapid flow-dependent myocardial clearance in under 10 minutes. Thus, although the myocardial extraction fraction that is observed immediately after injection is very high, the rapid clearance of this tracer results in a loss of defect contrast within the first 5 minutes post injection.14 Additionally, because the myocardial clearance rate of teboroxime is flow dependent, with slower clearance from ischemic versus normally perfused zones, the differential clearance rates give the scintigraphic equivalent of “redistribution,” with an apparent filling-in of the initial perfusion defects over time, as is observed with 201Tl.15 The mechanism for such rapid clearance is that teboroxime is believed not to cross the sarcolemmal membrane into the intracellular space of the myocyte, remaining instead within the intravascular space in association with the endothelial layer.16 Furthermore, its myocardial uptake is passive, not dependent on either active transport or other energy-dependent processes. Thus, teboroxime is considered to be a pure perfusion tracer.
Another neutral lipophilic perfusion tracer that has undergone Phase III clinical testing is 99mTc-N-NOET (NOET). Like teboroxime, NOET exhibits a first-pass extraction fraction that is higher than either sestamibi or tetrofosmin, with flow-dependent differential clearance of the tracer from the myocardium.17,18 Because of the differential clearance from ischemic versus normal zones, NOET has been shown to undergo apparent redistribution like teboroxime, albeit at a slower rate.18,19 Another similarity between NOET and teboroxime involves their mechanism of localization in the myocardium. NOET is also believed to remain within the intravascular space in association with the endothelial layer.20 Because of its accessibility, NOET clearance can be affected by a host of intravascular factors. Experimental studies demonstrated that the myocardial clearance rate of NOET could be accelerated not only by increasing the flow rate but also by elevating the blood lipid concentration.16,21 Like teboroxime, the uptake and retention of NOET does not involve active or energy-dependent processes, and thus it would also be considered a pure perfusion tracer.
MODELING TRACER EXTRACTION
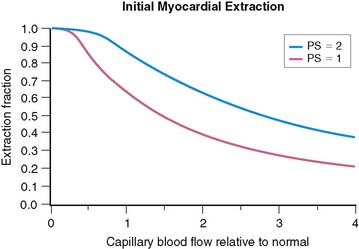
The tracers used for clinical imaging of myocardial blood flow are not completely extracted. For these tracers, the fraction of tracer extracted on passing through a capillary bed depends on the blood flow through the capillary bed. A model based on the work of Gosselin and Stibitz 22 provides insight into this process. The model is that of a diffusible tracer traveling through a cylindrical capillary. The tracer can diffuse outward from the blood across the capillary endothelium, but it can also diffuse back into the blood from outside the capillary endothelium. The outward and back-diffusion coefficients can be different. The extraction coefficient reflects the net loss in tracer concentration between the arterial and venous ends of the capillary. This leads to a tracer “extraction fraction” of the form:

where PS is a product of capillary permeability and surface area, and b is the capillary blood flow. The relationship between blood flow and tracer extraction predicted by this model is shown graphically in Figure 1-1. The top curve with PS = 2 would represent a tracer with high first-pass extraction, such as 201Tl. The lower curve with PS = 1 would represent a tracer with lower first-pass extraction, similar to sestamibi and tetrofosmin. The term first-pass extraction is often used to characterize radionuclide tracers, but it is not often carefully defined. Since the extracted fraction of tracer is flow dependent, the first-pass extraction indicates the fraction of extracted tracer measured at baseline resting blood flow. In Figure 1-1, the first-pass extraction of the two tracers shown would be about 86% for the upper line and about 64% for the lower line.

Although the equation was derived for solute exchange in a single capillary, it can be shown that the functional form remains unchanged for a generalized distribution of capillaries if the parameters are taken to represent the averages over the entire capillary distribution. The curve with the functional form shown has been ubiquitous in representing myocardial uptake as a function of myocardial blood flow. Figure 1-2 shows some experimental data of sestamibi extraction versus blood flow. The solid line of Figure 1-2 has the functional form of Equation 2. It fits the experimental data quite well if the PS coefficient is chosen empirically to best fit the data. However, if we substitute the PS coefficient that best agrees with the first-pass extraction data, it results in the dashed line of Figure 1-2 and produces a poor fit for the flow-versus-extraction curve. The dashed line predicts a more extreme reduction of tracer extraction with increasing myocardial blood than experimentally observed.
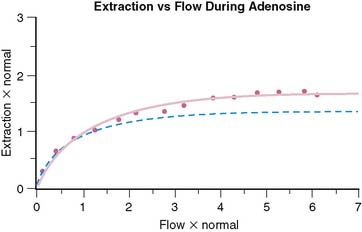
The same PS product should predict both the measured first-pass extraction coefficient and the flow-versus-extraction curve. The fact that it does not indicates that something is wrong with the model. A possible problem with the simple Gosselin and Stibitz model is that it does not account for myocardial flow regulation by opening and closing of capillary channels. Selective opening and closing of parallel capillary channels is thought to be an important mechanism to regulate capillary resistance and myocardial blood flow. This has been experimentally demonstrated.23,24 Further evidence for the role of capillary closure has been more recently found in the context of contrast echocardiography25 and for sestamibi perfusion measurements in the dog model.26
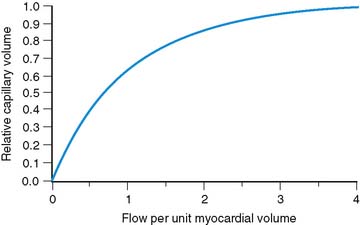
To account for the effect of variable capillary volumes, we wish to extend the basic model as follows: The first factor in Eq. 2 is replaced by F, which represents flow per unit myocardial volume. The term b in the exponential represents flow per unit of open capillary volume. We now introduce a new relationship:
Equation 3 allows for flow in the open capillaries to be different from flow per unit myocardial volume determined by the arterial supply vessels. Equation 3 further introduces the assumption that capillary blood volume decreases with decreasing flow due to capillary closure, and it increases to some maximum value when all the capillary channels are fully utilized at high flow. Figure 1-3 shows the relative capillary volume assumed by Eq. 3. This is in qualitative accord with the observations of Wu et al.23 The exact way that capillary volume changes in the course of vasoregulation is unknown. Our purpose here is limited to that of showing what effect variable capillary volume would have on tracer extraction.
The effect of capillary closure can be seen in Figure 1-4. The curves of first-pass extraction become less blood-flow dependent. The first-pass extraction fraction at low flow is less than would be predicted by the basic model of Gosselin and Stibitz,22 and the decrease of extracted fraction with increasing blood flow is less severe. The curves of Figure 1-4 are plotted for PS = 1.6 and 3.1, which represent the values that fit the experimentally measured extraction fractions of 0.64 and 0.86 for sestamibi and 201Tl, respectively. These values, obtained from first-pass extraction data, were used to compute the myocardial uptake-versus-flow curves, and those curves are plotted with experimental data from Glover in Figure 1-5. The predicted curves fit quite well to the experimental data. Thus, by including the effect of variable capillary blood volume, we are able to simultaneously predict all the experimental data from the same PS coefficient. The modified model is self-consistent, indicating that it is a better representation of reality.

Figure 1-4 These curves show the changes in first-pass extraction caused by the introduction of variable capillary volume as assumed in Figure 1-2. Curves are for values of PS = 1.6 and PS = 3.1, which predict first-pass extractions of 0.64 and 0.86, respectively, for Tc-sestamibi and Tl-201.
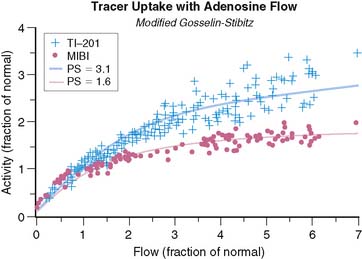
The curves of Figure 1-5 represent a transition from a low-flow state, where tracer extraction is flow limited and therefore proportional to flow, to a high-flow state, where extraction is membrane-diffusion limited and therefore not dependent on flow. Another way of thinking of this is that the tracer spends less time in the capillary at higher flows and consequently has a lower probability of being extracted in a single pass through the capillary. At sufficiently low flows, most of the tracer atoms are extracted, and the tracer acts more like an ideal microsphere. If there is substantial closure of capillary pathways as flow decreases, the increased extraction at low flow is less marked, and tracer extraction remains linear over a somewhat wider range of flow. The introduction of capillary closure was essential in order that the model could simultaneously predict the first-pass extraction fractions and fit the uptake-versus-flow data. We note, however, that if we had modeled the system by having flow entirely controlled by the fraction of open capillaries, the flow-extraction curves would have been linear, and this is clearly not so. Thus, we conclude that there is both capillary flow modulation and partial capillary closure at work simultaneously.
The flow dependence of myocardial tracer uptake has more than theoretical relevance. It limits the sensitivity for a given tracer to detect coronary artery disease (CAD). It has significant implications for pharmacologic stress agents and may be the determining factor in choosing the best tracer for a given circumstance. The flattening of the curves of tracer uptake versus myocardial blood flow means that the tracer defect will be much less than the actual blood-flow disparity. Underestimation of flow disparity will be particularly severe when we compare a viable myocardial region with limited flow reserve with an assumed normal myocardial region. The study by Glover et al.3 showed that obstructions that only limit flow reserve can give minimal tracer defect contrast despite maximum vasodilatation with adenosine. Tracers with higher first-pass extraction will track blood flows over a wider range compared to tracers of lower first-pass extraction. This does not apply to scar. Tracers with different extraction coefficients will indicate myocardial scar with equal contrast.
TRACER RETENTION
All tracers used for myocardial perfusion imaging are extracted in a blood-flow-dependent manner similar to that described. Generally, the tracer must also be retained in the myocardium long enough to acquire an image of the tracer distribution. As reviewed in detail earlier, myocardial perfusion tracers differ greatly in their mechanism of retention. 201Tl, being a potassium analog, enters myocardial cells through active channels and equilibrates with the intracellular cytosolic potassium pool. However, because it is not bound intracellularly, 201Tl is free to back-diffuse out of the myocardial cells and reenter the circulating blood pool where it can undergo further exchange in the myocardium or other tissue beds. Because 60% of the intracellular transport of 201Tl requires ATP,4 only viable myocardial cells that maintain a transmembrane potassium gradient will retain 201Tl. This feature makes 201Tl a useful myocardial cell viability marker.
REDISTRIBUTION
The Mechanism
Most myocardial tracers are not fixed in the myocardium but have some intrinsic rate of washout. If the tracer were injected only in the myocardium, its washout rate would reflect myocardial blood flow, with higher blood flow encouraging more rapid tracer washout.15,21,27 Unfortunately, the tracer washout following intravenous systemic injection will have no simple relationship to myocardial blood flow. Following a systemic tracer injection, no more than 3% to 5% of the tracer is delivered to the myocardium. The rest is distributed through all of the other body compartments. After initial extraction, the tracer will start to exchange between the various compartments. The amount of “washout” from the myocardium depends not only on how much tracer is leaving the myocardium but also on how much is being continuously accumulated by exchange from other compartments. The net washout, which is all we can observe, cannot be expected to be simply related to myocardial blood flow.
Figure 1-6 shows the myocardial uptake and washout of an exchangeable tracer that is injected intravenously. The curves are based on parameters that reflect 201Tl. Specifically, a blood clearance half-time of 1 to 5 minutes is assumed, a systemic excretion of about 10 hours is assumed, and the intrinsic myocardial membrane transport coefficient is taken as 0.01, representing a half-time of 69 minutes, in accordance with experimental data.28 In words, the curves show rapid early myocardial uptake roughly proportional to myocardial perfusion. Blood levels of the tracer fall rapidly as it is extracted by the heart as well as all the other systemic compartments. After initial extraction, the tracer molecules are slowly released back into the blood, maintaining a nearly constant low-level blood concentration of tracer. The subsequent exchange of tracer between blood and myocardial cells continues until an equilibrium point is reached, where the myocardium loses one tracer molecule for each new molecule it picks up from the blood. This exchange equilibrium is not dependent on blood flow, but only on the relative concentrations of intravascular and extravascular tracer molecules. The level of net tracer uptake at equilibrium is determined by the residual blood concentration and by the magnitude of the intracellular/extracellular concentration gradient supported by the membrane potentials or by active membrane transport.
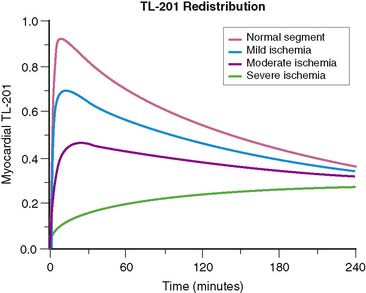
We can summarize the clinically relevant parts of this process as follows: (1) The initial myocardial extraction reflects the distribution of blood flow at the time of injection, and (2) the delayed uptake after equilibrium is reached is flow independent but reflects an intact myocardial cell membrane and membrane potential and is thus a marker of cell viability. This is the principle behind redistribution imaging. The fact that delayed uptake is flow independent means that if a myocardial segment is chronically hypoperfused, even when injection is performed at rest, redistribution can still occur. Redistribution in chronically hypoperfused regions is a clinically useful feature of 201Tl.29 Sestamibi and tetrofosmin are more tightly bound, so myocardial washout is slower and systemic blood clearance is also greater with these tracers. Therefore, while there is the potential for some redistribution, it is too slow and of too little magnitude to be clinically useful.
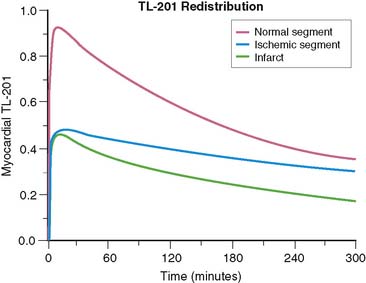
Redistribution Versus Persistent Defect
Consider the tracer uptake and washout curves in Figure 1-7, comparing one myocardial segment, which is a mixture of half infarct and half normal, to another myocardial segment, which is all viable but has 50% reduced blood flow. The half-infarcted defect will continuously have half the uptake of the normal sample. The ischemic segment starts with half-normal uptake but returns to normal by redistribution. Examination of the curves in Figure 1-7 shows that at any one time, the difference between the fixed defect and the redistributing defect is surprisingly small. The “signal” (representing the difference between the two curves) is weak and comparable to the “noise” (representing the error of measurement) involved in real clinical imaging. This means that under the best of circumstances, differentiation of partly infarcted from moderately ischemic myocardium will be a subtle differentiation subject to some uncertainty. We will return to this point when we discuss reinjection.
Reinjection (See Chapter 37)
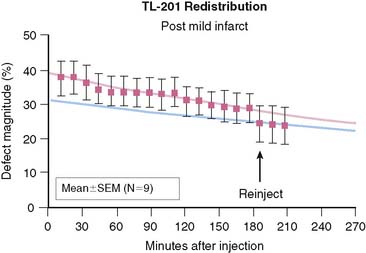
Redistribution of 201Tl is a marker of myocardial viability, but in some cases there appears to be little or no reversibility in viable segments.30 It has been reported that reinjection of 201Tl at rest will expose more redistribution than delayed imaging alone and that this will enhance viability detection.31 We can model this process. Figure 1-8 shows the same comparison of a myocardial segment, half normal and half infarct, with another myocardial segment that is transiently ischemic with half-normal tracer uptake at stress. We have assumed that the blood flow returns to normal following stress, and reinjection of half the initial dose takes place at 150 minutes following stress injection. Figure 1-8 points out that tracer reinjection does two things: First, it adds more tracer to both the normal and abnormal segments. Second, it adds more redistribution—the sudden equivalent of about 2 more hours of redistribution. Figure 1-9 summarizes data from an animal study in which a very severe perfusion defect (resulting from mild subendocardial infarction and surrounding ischemia) was followed for 3 hours of redistribution and then imaged again after reinjection. We see in this experiment a severe defect with slow redistribution and a sudden addition of a bit more reversibility upon reinjection. The change following reinjection is predictable—the equivalent of about 2 more hours of redistribution—but the amount of additional redistribution induced by reinjection is not dramatic.
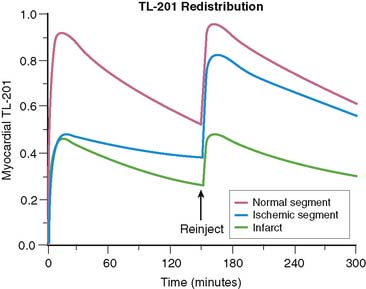
Neither the model in Figure 1-8 nor the animal data of Figure 1-9 show an absence of redistribution in a defect that reverses upon reinjection. However, the juxtaposition of initial and delayed images with reinjection images sometimes creates the appearance of a patently fixed defect that suddenly reverses upon reinjection. There is no physiologically logical model for that and no quantitative measurements that confirm that a truly fixed defect would spontaneously become reversible upon reinjection. Scintiphoto images, however, do occasionally appear to show a fixed defect that reverses only after reinjection.
Reverse Redistribution
All of these situations are common, so the appearance of reverse redistribution must be at least partly the result of image artifact. One possible situation that may create the appearance of reverse redistribution is the result of comparing an infarct to an ischemic segment, with the mistaken assumption that there is a normal myocardial segment for reference. Suppose that we had an ischemic segment and a segment that was partly infarcted as shown in Figure 1-7. Now suppose further that the normal segment (the solid line) was not visible. This could happen in a case of diffuse multiple-vessel disease so severe that there is no normally perfused segment for reference. The tracer then redistributes into the ischemic segments so that they have more uptake than the partly infarcted segments. This can create the appearance of a defect (the infarct) in the delayed or rest images that was not apparent in the stress images.
DETECTION OF CORONARY ARTERY DISEASE
None of these tracers is completely extracted in a single capillary passage. The first-pass extraction coefficients vary from about 54% for tetrofosmin,6 to about 65% for sestamibi,5 and about 85% to 88% for 201Tl.1 Tracers with lower extraction fraction are more blood-flow dependent, with lower extraction at higher blood flow. The blood-flow dependence of tracer extraction places a limitation on our ability to detect CAD at the level where it causes only moderate reduction of the coronary reserve capacity. When comparing a myocardial segment with greatly enhanced flow due to stress or vasodilator to another segment with less enhanced flow due to a flow-limiting stenosis, the tracers will greatly underestimate the flow disparity. This effect is related to the extraction coefficient, and thus a tracer with higher extraction coefficient will be more sensitive for detection of mild flow-limiting stenoses. Detection of myocardial infarction or myocardial regions with severe reduction of flow will be similar for tracers having different extraction fractions.
1. Weich H.F., Strauss H.W., Pitt B. The extraction of thallium-201 by the myocardium. Circulation. 1977;56(2):188-191.
2. Strauss H.W., Harrison K., Langan J.K., Lebowitz E., Pitt B. Thallium-201 for myocardial imaging. Relation of thallium-201 to regional myocardial perfusion. Circulation. 1975;51(4):641-645.
3. Glover D.K., Ruiz M., Edwards N.C., et al. Comparison between 201Tl and 99mTc sestamibi uptake during adenosine-induced vasodilation as a function of coronary stenosis severity. Circulation. 1995;91(3):813-820.
4. McCall D., Zimmer L.J., Katz A.M. Kinetics of thallium exchange in cultured rat myocardial cells. Circ Res. 1985;56(3):370-376.
5. Mousa S.A., Cooney J.M., Williams S.J. Relationship between regional myocardial blood flow and the distribution of 99mTc-sestamibi in the presence of total coronary artery occlusion. Am Heart J. 1990;119(4):842-847.
6. Glover D.K., Ruiz M., Yang J.Y., Smith W.H., Watson D.D., Beller G.A. Myocardial 99mTc-tetrofosmin uptake during adenosine-induced vasodilatation with either a critical or mild coronary stenosis: comparison with 201Tl and regional myocardial blood flow. Circulation. 1997;96(7):2332-2338.
7. Piwnica-Worms D.P., Kronauge J.F., LeFurgey A., et al. Mitochondrial localization and characterization of 99Tc-SESTAMIBI in heart cells by electron probe x-ray microanalysis and 99Tc-NMR spectroscopy. Magn Reson Imaging. 1994;12(4):641-652.
8. Piwnica-Worms D., Kronauge J.F., Delmon L., Holman B.L., Marsh J.D., Jones A.G. Effect of metabolic inhibition on technetium-99m-MIBI kinetics in cultured chick myocardial cells. J Nucl Med. 1990;31(4):464-472.
9. Hatada K., Riou L.M., Ruiz M., et al. 99mTc-N-DBODC5, a new myocardial perfusion imaging agent with rapid liver clearance: comparison with 99mTc-sestamibi and 99mTc-tetrofosmin in rats. J Nucl Med. 2004;45(12):2095-2101.
10. Hatada K., Ruiz M., Riou L.M., et al. Organ biodistribution and myocardial uptake, washout, and redistribution kinetics of Tc-99m N-DBODC5 when injected during vasodilator stress in canine models of coronary stenoses. J Nucl Cardiol. 2006;13(6):779-790.
11. Kim Y.S., Wang J., Broisat A., Glover D.K., Liu S. Tc-99m-N-MPO: novel cationic Tc-99m radiotracer for myocardial perfusion imaging. J Nucl Cardiol. 2008;15(4):535-546.
12. Leppo J.A., Meerdink D.J. Comparative myocardial extraction of two technetium-labeled BATO derivatives (SQ30217, SQ32014) and thallium. J Nucl Med. 1990;31(1):67-74.
13. Beanlands R., Muzik O., Nguyen N., Petry N., Schwaiger M. The relationship between myocardial retention of technetium-99m teboroxime and myocardial blood flow. J Am Coll Cardiol. 1992;20(3):712-719.
14. Glover D.K., Ruiz M., Bergmann E.E., et al. Myocardial technetium-99m-teboroxime uptake during adenosine-induced hyperemia in dogs with either a critical or mild coronary stenosis: comparison to thallium-201 and regional blood flow. J Nucl Med. 1995;36(3):476-483.
15. Stewart R.E., Heyl B., O’Rourke R.A., Blumhardt R., Miller D.D. Demonstration of differential post-stenotic myocardial technetium-99m-teboroxime clearance kinetics after experimental ischemia and hyperemic stress. J Nucl Med. 1991;32(10):2000-2008.
16. Johnson G.3rd, Nguyen K.N., Pasqualini R., Okada R.D. Interaction of technetium-99m-N-NOET with blood elements: potential mechanism of myocardial redistribution. J Nucl Med. 1997;38(1):138-143.
17. Vanzetto G., Calnon D.A., Ruiz M., et al. Myocardial uptake and redistribution of 99mTc-N-NOET in dogs with either sustained coronary low flow or transient coronary occlusion: comparison with 201Tl and myocardial blood flow. Circulation. 1997;96(7):2325-2331.
18. Petruzella F.D., Ruiz M., Katsiyiannis P., et al. Optimal timing for initial and redistribution technetium-99m N-NOET image acquisition. J Nucl Cardiol. 2000;7(2):123-131.
19. Jeetley P., Sabharwal N.K., Soman P., et al. Comparison between Tc-99m N-NOET and Tl-201 in the assessment of patients with known or suspected coronary artery disease. J Nucl Cardiol. 2004;11(6):664-672.
20. Uccelli L., Giganti M., Duatti A., et al. Subcellular distribution of technetium-99m N-NOET in rat myocardium. J Nucl Med. 1995;36(11):2075-2079.
21. Riou L.M., Unger S., Toufektsian M.C., et al. Effects of increased lipid concentration and hyperemic blood flow on the intrinsic myocardial washout kinetics of 99mTcN-NOET. J Nucl Med. 2003;44(7):1092-1098.
22. Gosselin R.E., Stibitz G.R. Rates of solute absorption from tissue depots: theoretical considerations. Pflugers Arch. 1970;318(2):85-98.
23. Wu X.S., Ewert D.L., Liu Y.H., Ritman E.L. In vivo relation of intramyocardial blood volume to myocardial perfusion. Evidence supporting microvascular site for autoregulation. Circulation. 1992;85(2):730-737.
24. Lindner J.R., Kaul S. Insights into the assessment of myocardial perfusion offered by different cardiac imaging modalities. J Nucl Cardiol. 1995;2(5):446-460.
25. Wei K., Le E., Bin J.P., Coggins M., Jayawera A.R., Kaul S. Mechanism of reversible 99mTc-sestamibi perfusion defects during pharmacologically induced vasodilatation. Am J Physiol Heart Circ Physiol. 2001;280(4):H1896-H1904.
26. Jayaweera A.R., Wei K., Coggins M., Bin J.P., Goodman C., Kaul S. Role of capillaries in determining CBF reserve: new insights using myocardial contrast echocardiography. Am J Physiol. 1999;277(6 Pt 2):H2363-2372.
27. Beller G.A., Holzgrefe H.H., Watson D.D. Effects of dipyridamole-induced vasodilation on myocardial uptake and clearance kinetics of thallium-201. Circulation. 1983;68(6):1328-1338.
28. Grunwald A.M., Watson D.D., Holzgrefe H.H.Jr, Irving J.F., Beller G.A. Myocardial thallium-201 kinetics in normal and ischemic myocardium. Circulation. 1981;64(3):610-618.
29. Sansoy V., Glover D.K., Watson D.D., et al. Comparison of thallium-201 resting redistribution with technetium-99m-sestamibi uptake and functional response to dobutamine for assessment of myocardial viability. Circulation. 1995;92(4):994-1004.
30. Yang L.D., Berman D.S., Kiat H., et al. The frequency of late reversibility in SPECT thallium-201 stress-redistribution studies. J Am Coll Cardiol. 1990;15(2):334-340.
31. Dilsizian V., Rocco T.P., Freedman N.M., Leon M.B., Bonow R.O. Enhanced detection of ischemic but viable myocardium by the reinjection of thallium after stress-redistribution imaging. N Engl J Med. 1990;323(3):141-146.
[/level-membership-for-internal-medicine-category][not-level-membership-for-internal-medicine-category]
Chapter 1 Overview of Tracer Kinetics and Cellular Mechanisms of Uptake
CELLULAR UPTAKE OF MYOCARDIAL PERFUSION AGENTS
Thallium-201
Thallium-201 (201Tl) is a radioactive potassium analog. The initial myocardial uptake of 201Tl is dependent upon myocardial blood flow and its first-pass extraction fraction, which is approximately 85% under resting flow conditions.1,2 At higher flow rates, such as those obtained during pharmacologic vasodilation, the extraction of 201Tl is not linear with respect to flow.3 The plateau in extraction results in an underestimation of the true maximal flow. This phenomenon is true of all diffusible flow tracers and will be discussed in detail in the next section of this chapter.
The intracellular uptake of 201Tl predominantly involves active exchange across the sarcolemmal membrane of the myocytes via the Na+/K+ adenosine triphosphate (ATP) transport system.4 Because this system is energy dependent, thallium transport can only occur in viable myocardium. Once inside the myocyte, 201Tl is not bound intracellularly and can diffuse back out into the circulation. As will be discussed in detail later, these uptake and redistribution kinetic properties form the basis of clinical assessment of myocardial perfusion and viability using 201Tl. Although the introduction of 201Tl in the mid-1970s represented a major advance in nuclear cardiology, its physical properties are not ideal for gamma camera imaging. The low-energy 69- to 80-keV x-ray photopeak can result in attenuation artifacts and the relatively long 73-hour half-life limits the maximal dose that can be safely administered.
Monovalent Cationic Technetium-99m-Labeled Tracers
Over the years, there have been a number of 99mTc-labeled myocardial perfusion imaging agents that have been investigated as replacements for 201Tl. The most successful ones to date are the lipophilic monovalent cationic agents, 99mTc-sestamibi (sestamibi, Cardiolite) and 99mTc-tetrofosmin (tetrofosmin, Myoview), that are now widely used for clinical studies. Following an intravenous injection, the first-pass extraction fractions of sestamibi and tetrofosmin are approximately 65% and 54%, respectively, under basal resting flow conditions.5,6 Because of their lower extraction fractions compared with 201Tl, the plateau in tracer uptake observed during hyperemia occurs at lower flow rates. The effect of this “roll-off” in extraction at lower flow rates is to diminish the relative difference in tracer activities between high-flow regions and those myocardial regions subtended by a coronary stenosis, making it more difficult to detect milder stenoses.
Although these agents are members of two distinct chemical classes of compounds, isonitriles and diphosphines, respectively, they share several common properties. Unlike 201Tl, which utilizes a specific membrane-active transporter, these tracers are passively drawn across the sarcolemmal and mitochondrial membranes along a large electronegative transmembrane potential gradient, owing to their lipophilicity and positive charge.7 Once inside the mitochondria, these cationic tracers are tightly bound by the potential gradient such that there is a very slow net efflux resulting in prolonged myocardial retention times. Although ATP is not directly required for the intracellular sequestration of cationic tracers, as it is for 201Tl, the influx and retention of these tracers are energy dependent because the presence of a normal electronegative transmembrane gradient is required. With irreversible injury, the mitochondrial and sarcolemmal membranes are depolarized, and the uptake of these cationic tracers is impaired.8 Accordingly, like 201Tl, the cationic 99mTc-labeled agents can be used to assess myocardial viability.
In addition to the lower plateau in extraction mentioned, another disadvantage to both sestamibi and tetrofosmin is the problem of photon scatter from the adjacent liver that can interfere with the interpretation of myocardial perfusion defects, particularly in the inferior left ventricular wall. Accordingly, there has been renewed interest in recent years to design improved cationic 99mTc-labeled tracers that exhibit more rapid liver clearance. 99mTc-(N)(PNP5)(DBODC5)+ (DBODC5) is a lipophilic nitride that is rapidly taken up and retained by the myocardium in a manner that is mechanistically similar to sestamibi and tetrofosmin. However, studies in both rats and dogs demonstrated that DBODC5 cleared more rapidly from the liver than either of these other cationic tracers, with virtually no liver activity observed after only 1 hour.9,10 The first-pass extraction fraction of DBODC5 is intermediate to that of sestamibi and tetrofosmin.10 Although there is no improvement in the ability of DBODC5 to track myocardial blood flow at hyperemic flow rates, its more favorable biodistribution properties offer a potential advantage that warrants further investigation.
Another new lipophilic cationic tracer with improved biodistribution and very rapid liver clearance is 99mTc-[N(MPO)(PNP5)]+ (MPO). The myocardial uptake of MPO in Sprague Dawley rats was reported to be between that of sestamibi and DBODC5 over 2 hours.11 Interestingly, the heart-liver ratio of MPO at 30 minutes after injection was more than twice that of DBODC5 and approximately 4 times higher than that of sestamibi.11 With such rapid liver clearance, clinically useful images might be obtainable as early as 15 minutes post injection. At the present time, the first-pass extraction fraction studies have not been conducted using MPO.
Neutral Lipophilic Tracers
99mTc-teboroxime (teboroxime) is a member of a class of neutral lipophilic molecules known as BATOs (Boronic acid Adducts of Technetium diOxime). After intravenous injection, the initial instantaneous uptake of teboroxime is high, with a first-pass extraction fraction of approximately 90%—higher than even 201Tl.12,13 However, unlike the cationic 99mTc-labeled myocardial perfusion tracers discussed earlier that are retained in the myocardium, teboroxime exhibits rapid flow-dependent myocardial clearance in under 10 minutes. Thus, although the myocardial extraction fraction that is observed immediately after injection is very high, the rapid clearance of this tracer results in a loss of defect contrast within the first 5 minutes post injection.14 Additionally, because the myocardial clearance rate of teboroxime is flow dependent, with slower clearance from ischemic versus normally perfused zones, the differential clearance rates give the scintigraphic equivalent of “redistribution,” with an apparent filling-in of the initial perfusion defects over time, as is observed with 201Tl.15 The mechanism for such rapid clearance is that teboroxime is believed not to cross the sarcolemmal membrane into the intracellular space of the myocyte, remaining instead within the intravascular space in association with the endothelial layer.16 Furthermore, its myocardial uptake is passive, not dependent on either active transport or other energy-dependent processes. Thus, teboroxime is considered to be a pure perfusion tracer.
Another neutral lipophilic perfusion tracer that has undergone Phase III clinical testing is 99mTc-N-NOET (NOET). Like teboroxime, NOET exhibits a first-pass extraction fraction that is higher than either sestamibi or tetrofosmin, with flow-dependent differential clearance of the tracer from the myocardium.17,18 Because of the differential clearance from ischemic versus normal zones, NOET has been shown to undergo apparent redistribution like teboroxime, albeit at a slower rate.18,19 Another similarity between NOET and teboroxime involves their mechanism of localization in the myocardium. NOET is also believed to remain within the intravascular space in association with the endothelial layer.20 Because of its accessibility, NOET clearance can be affected by a host of intravascular factors. Experimental studies demonstrated that the myocardial clearance rate of NOET could be accelerated not only by increasing the flow rate but also by elevating the blood lipid concentration.16,21 Like teboroxime, the uptake and retention of NOET does not involve active or energy-dependent processes, and thus it would also be considered a pure perfusion tracer.
MODELING TRACER EXTRACTION
The tracers used for clinical imaging of myocardial blood flow are not completely extracted. For these tracers, the fraction of tracer extracted on passing through a capillary bed depends on the blood flow through the capillary bed. A model based on the work of Gosselin and Stibitz 22 provides insight into this process. The model is that of a diffusible tracer traveling through a cylindrical capillary. The tracer can diffuse outward from the blood across the capillary endothelium, but it can also diffuse back into the blood from outside the capillary endothelium. The outward and back-diffusion coefficients can be different. The extraction coefficient reflects the net loss in tracer concentration between the arterial and venous ends of the capillary. This leads to a tracer “extraction fraction” of the form:
where PS is a product of capillary permeability and surface area, and b is the capillary blood flow. The relationship between blood flow and tracer extraction predicted by this model is shown graphically in Figure 1-1. The top curve with PS = 2 would represent a tracer with high first-pass extraction, such as 201Tl. The lower curve with PS = 1 would represent a tracer with lower first-pass extraction, similar to sestamibi and tetrofosmin. The term first-pass extraction is often used to characterize radionuclide tracers, but it is not often carefully defined. Since the extracted fraction of tracer is flow dependent, the first-pass extraction indicates the fraction of extracted tracer measured at baseline resting blood flow. In Figure 1-1, the first-pass extraction of the two tracers shown would be about 86% for the upper line and about 64% for the lower line.
Although the equation was derived for solute exchange in a single capillary, it can be shown that the functional form remains unchanged for a generalized distribution of capillaries if the parameters are taken to represent the averages over the entire capillary distribution. The curve with the functional form shown has been ubiquitous in representing myocardial uptake as a function of myocardial blood flow. Figure 1-2 shows some experimental data of sestamibi extraction versus blood flow. The solid line of Figure 1-2 has the functional form of Equation 2. It fits the experimental data quite well if the PS coefficient is chosen empirically to best fit the data. However, if we substitute the PS coefficient that best agrees with the first-pass extraction data, it results in the dashed line of Figure 1-2 and produces a poor fit for the flow-versus-extraction curve. The dashed line predicts a more extreme reduction of tracer extraction with increasing myocardial blood than experimentally observed.
The same PS product should predict both the measured first-pass extraction coefficient and the flow-versus-extraction curve. The fact that it does not indicates that something is wrong with the model. A possible problem with the simple Gosselin and Stibitz model is that it does not account for myocardial flow regulation by opening and closing of capillary channels. Selective opening and closing of parallel capillary channels is thought to be an important mechanism to regulate capillary resistance and myocardial blood flow. This has been experimentally demonstrated.23,24 Further evidence for the role of capillary closure has been more recently found in the context of contrast echocardiography25 and for sestamibi perfusion measurements in the dog model.26
To account for the effect of variable capillary volumes, we wish to extend the basic model as follows: The first factor in Eq. 2 is replaced by F, which represents flow per unit myocardial volume. The term b in the exponential represents flow per unit of open capillary volume. We now introduce a new relationship:
Equation 3 allows for flow in the open capillaries to be different from flow per unit myocardial volume determined by the arterial supply vessels. Equation 3 further introduces the assumption that capillary blood volume decreases with decreasing flow due to capillary closure, and it increases to some maximum value when all the capillary channels are fully utilized at high flow. Figure 1-3 shows the relative capillary volume assumed by Eq. 3. This is in qualitative accord with the observations of Wu et al.23 The exact way that capillary volume changes in the course of vasoregulation is unknown. Our purpose here is limited to that of showing what effect variable capillary volume would have on tracer extraction.
The effect of capillary closure can be seen in Figure 1-4. The curves of first-pass extraction become less blood-flow dependent. The first-pass extraction fraction at low flow is less than would be predicted by the basic model of Gosselin and Stibitz,22 and the decrease of extracted fraction with increasing blood flow is less severe. The curves of Figure 1-4 are plotted for PS = 1.6 and 3.1, which represent the values that fit the experimentally measured extraction fractions of 0.64 and 0.86 for sestamibi and 201Tl, respectively. These values, obtained from first-pass extraction data, were used to compute the myocardial uptake-versus-flow curves, and those curves are plotted with experimental data from Glover in Figure 1-5. The predicted curves fit quite well to the experimental data. Thus, by including the effect of variable capillary blood volume, we are able to simultaneously predict all the experimental data from the same PS coefficient. The modified model is self-consistent, indicating that it is a better representation of reality.
