[level-membership-for-basic-science-category]Chapter 1
Orientation to the Structure and Imaging of the Central Nervous System
Central, Peripheral, and Visceromotor Nervous Systems
Regions of the Central Nervous System
Functional Systems and Regions
Localizing Signs and Localization
Concept of Afferent and Efferent
Posterior (Dorsal), Anterior (Ventral), and Other Directions in the Central Nervous System
Our nervous system makes us what we are. Personality, outlook, intellect, coordination (or lack thereof), and the many other characteristics are the result of complex interactions within our nervous system. Information is received from the environment and transmitted into the brain or spinal cord. Once this sensory information is processed and integrated, an appropriate motor response is initiated.
The nervous system can be viewed as a scale of structural complexity. At the microscopic level, the individual structural and functional unit of the nervous system is the neuron, or nerve cell. Interspersed among the neurons of the central nervous system are supportive elements called glial cells. At the macroscopic end of the scale are the large divisions (or parts) of the nervous system that can be handled and studied without magnification. These two extremes are not independent but form a continuum; functionally related neurons aggregate to form small structures that combine to form larger structures. Communication takes place at many different levels, the end result being a wide range of productive or life-sustaining nervous activities.
OVERVIEW
Central, Peripheral, and Visceromotor Nervous Systems
The human nervous system is divided into the central nervous system (CNS) and the peripheral nervous system (PNS) (Fig. 1-1A). The CNS consists of the brain and spinal cord. Because of their locations in the skull and vertebral column, these structures are the most protected in the body. The PNS is made up of nerves that connect the brain and spinal cord with peripheral structures. These nerves innervate muscle (skeletal, cardiac, smooth) and glandular epithelium and contain a variety of sensory fibers. These sensory fibers enter the spinal cord through the posterior (dorsal) root, and motor fibers exit through the anterior (ventral) root. The spinal nerve is formed by the joining of posterior (sensory) and anterior (motor) roots and is, consequently, a mixed nerve (Fig. 1-1B). In the case of mixed cranial nerves, the sensory and motor fibers are combined into a single root.
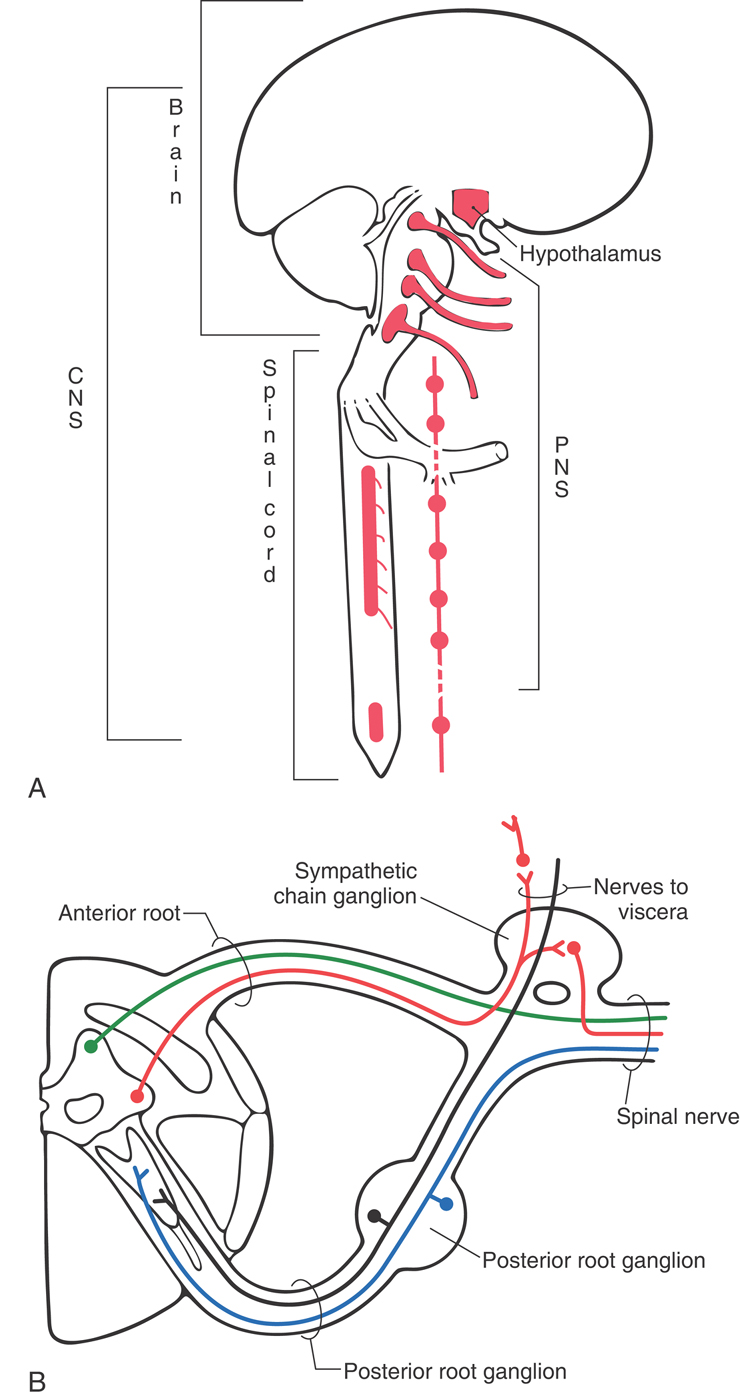
The visceromotor nervous system (also called visceral motor) is a functional division of the nervous system that has parts in both the CNS and the PNS (Fig. 1-1). It is made up of neurons that innervate smooth muscle, cardiac muscle, or glandular epithelium or combinations of these tissues. These individual visceral tissues, when combined, make up visceral organs such as the stomach. The visceromotor nervous system is also called the autonomic nervous system because it regulates motor responses outside the realm of conscious control.
Neurons
At the histologic level, the nervous system is composed of neurons and glial cells. As the basic structural and functional units of the nervous system, neurons are specialized to receive information, to transmit electrical impulses, and to influence other neurons or effector tissues. In many areas of the nervous system, neurons are structurally modified to serve particular functions. At this point, we consider the neuron only as a general concept (see Chapter 2).
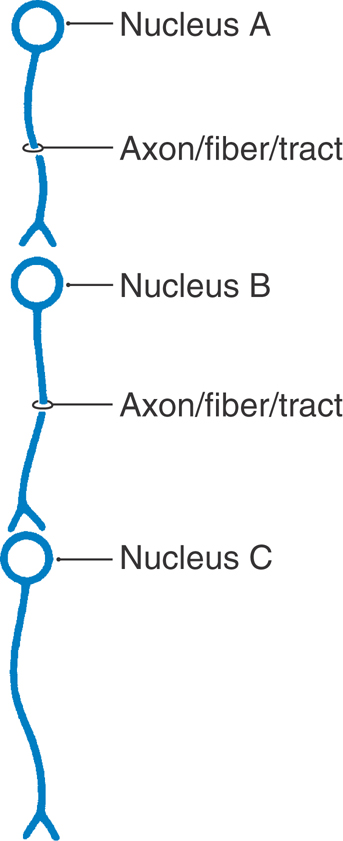
A neuron consists of a cell body (perikaryon or soma) and the processes that emanate from the cell body (Fig. 1-2). Collectively, neuronal cell bodies constitute the gray matter of the CNS. Named and usually function-specific clusters of cell bodies in the CNS are called nuclei (singular, nucleus). Typically, dendrites are those processes that ramify in the vicinity of the cell body, whereas a single, longer process called the axon carries impulses to a more remote destination. The white matter of the CNS consists of bundles of axons that are wrapped in a sheath of insulating lipoprotein called myelin.
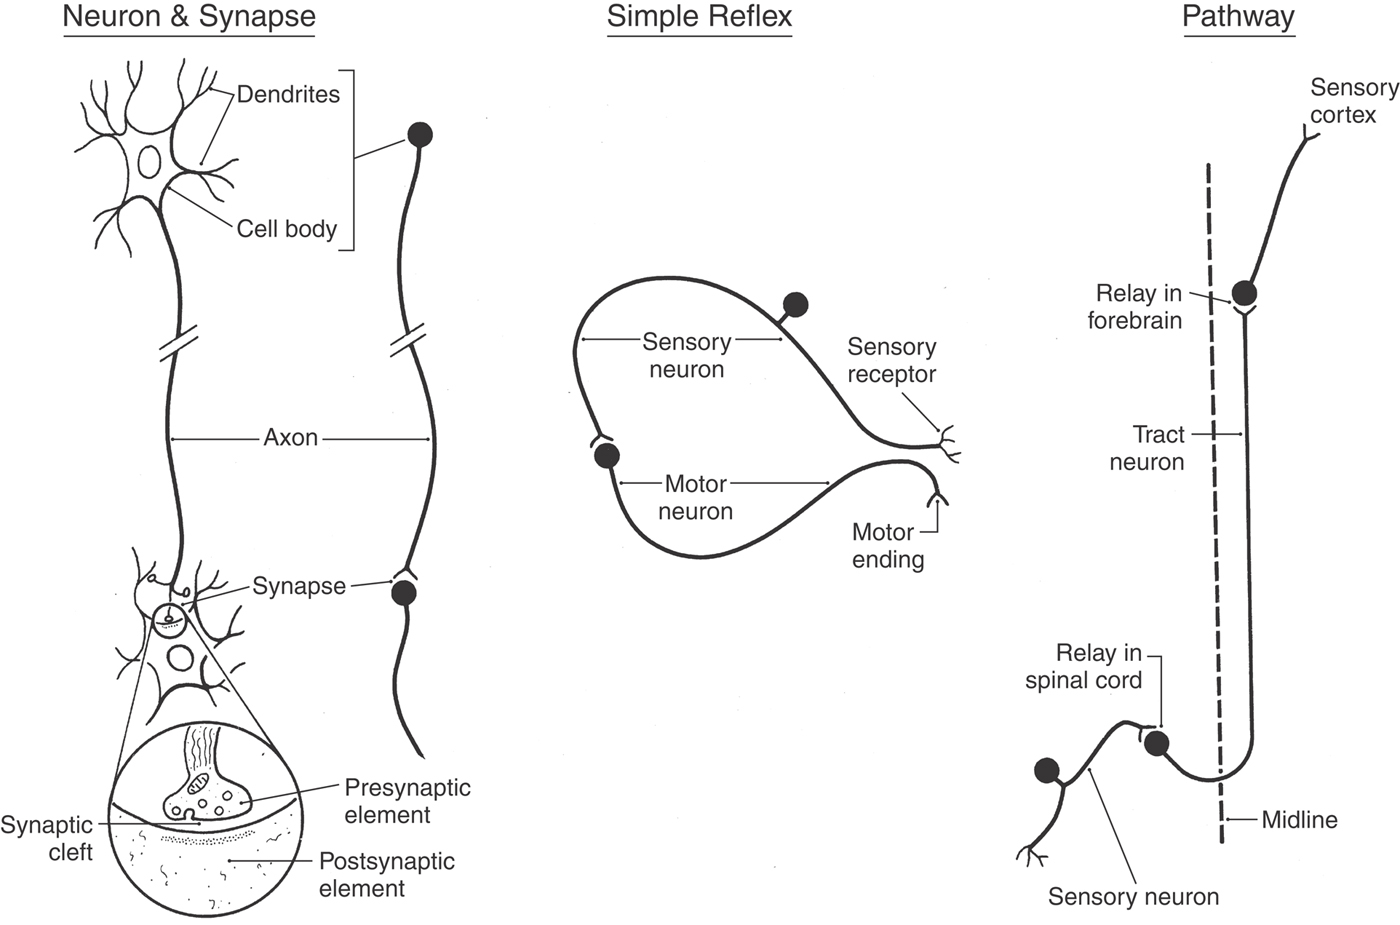
Figure 1-2. A representative neuron and synapse, a simple (monosynaptic) reflex, and a pathway.
In general, there is a direct relationship between (1) the diameter of the axon, (2) the thickness of the myelin sheath, (3) the distance between the nodes of the myelin sheath (nodes of Ranvier), and (4) the conduction velocity of the nerve fiber. Axons with a large diameter have thick myelin sheaths with longer internodal distances and therefore exhibit faster conduction velocities. Likewise, axons with a thin diameter that have thin myelin sheaths with shorter internodal distances have slower conduction velocities. The axon terminates at specialized structures called synapses or, if they innervate muscles, motor end plates (neuromuscular junctions), which function much like synapses.
The generalized synapse (Fig. 1-2) is the most common type seen in the CNS and is sometimes called an electrochemical synapse. It consists of a presynaptic element, which is part of an axon; a gap called the synaptic cleft; and the postsynaptic region of the innervated neuron or effector structure. Communication across this synapse is accomplished as follows. An electrical impulse (the action potential) causes the release of a neuroactive substance (a neurotransmitter, neuromodulator, or neuromediator) from the presynaptic element into the synaptic cleft. This substance is stored in synaptic vesicles in the presynaptic element and is released into the synaptic space by the fusion of these vesicles with the cell membrane (Fig. 1-2).
The neurotransmitter diffuses rapidly across the synaptic space and binds to receptor sites on the postsynaptic membrane. On the basis of the action of the neurotransmitter at receptor sites, the postsynaptic neuron may be excited (lead to generation of an action potential) or inhibited (prevent generation of an action potential). Neurotransmitter residues in the synaptic cleft are rapidly inactivated by other chemicals found in this space. In this brief example, we see that (1) the neuron is structurally specialized to receive and propagate electrical signals, (2) this propagation is accomplished by a combination of electrical and chemical events, and (3) the transmission of signals across the synapse is in one direction (unidirectional), that is, from the presynaptic neuron to the postsynaptic neuron. There are a number of neurologic disorders that represent a failure of neurotransmitter action at the synapse or at the receptors on the postsynaptic membrane.
Reflexes and Pathways
The function of the nervous system is based on the interactions between neurons. Figure 1-2 illustrates one of the simplest types of neuronal circuits, a reflex arc composed of only two neurons. This is called a monosynaptic reflex arc because only one synapse is involved. In this example, the peripheral end of a sensory fiber responds to a particular type of input. The resulting action potential is conducted by the sensory fiber into the spinal cord, where it influences a motor neuron. The axon of the motor neuron conducts a signal from the spinal cord to the appropriate skeletal muscle, which responds by contracting. This is an example of a muscle stretch reflex, which is actually one of the more commonly tested reflexes in clinical medicine. Reflexes are involuntary responses to a particular bit of sensory input. For example, the physician taps on the patellar tendon and the leg jerks; the patient does not think about it—the motor response just happens. The lack of a reflex (areflexia), an obviously weakened reflex (hyporeflexia), or an excessively active reflex (hyperreflexia) is usually indicative of a neurologic disorder.
By building on these summaries of the neuron and of the basic reflex arc, we shall briefly consider what neuronal elements constitute a pathway. If the patient bumps his or her knee and not only hits the patellar tendon but also damages the skin over the tendon, two things happen (Fig. 1-2). First, impulses from receptors in the tendon travel through a reflex arc that causes the leg to jerk (knee jerk, or patellar reflex). The synapse for this reflex arc is located in the lumbosacral spinal cord. Second, impulses from pain receptors in the damaged skin are transmitted in the lumbosacral cord to a second set of neurons that convey them via ascending axons to the forebrain. As can be seen in Figure 1-2, these axons cross the midline of the spinal cord and form an ascending tract on the contralateral side. In the forebrain, these signals are passed to a third group of neurons that distribute them to a region of the cerebral cortex specialized to interpret them as pain from the knee.
This three-neuron chain constitutes a pathway, a series of neurons designed to carry a specific type of information from one site to another (Fig. 1-2). Some pathways carry information to a level of conscious perception (we not only recognize pain but know that it is coming from the knee), and others convey information that does not reach the conscious level. It is common to refer to all the neurons comprising a pathway and conducting a specific type of information as a system. For example, the anterolateral system conducts pain and thermal information, the posterior column–medial lemniscus system conducts vibratory and position sense, and the corticospinal system conducts information from the cerebral cortex to the spinal cord.
REGIONS OF THE CENTRAL NERVOUS SYSTEM
Spinal Cord
The spinal cord is located inside the vertebral canal and is rostrally continuous with the medulla oblongata of the brain (Fig. 1-3). An essential link between the PNS and the brain, it conveys sensory information originating from the body wall, extremities, and gut and distributes motor impulses to these areas. Impulses enter and leave the spinal cord through the 31 pairs of spinal nerves (Fig. 1-1; see also Fig. 9-2). The spinal cord contains sensory fibers and motor neurons involved in reflex activity and ascending and descending pathways or tracts that link spinal centers with other parts of the CNS. Ascending pathways convey sensory information to higher centers, whereas descending pathways influence neurons in the spinal cord or brainstem.
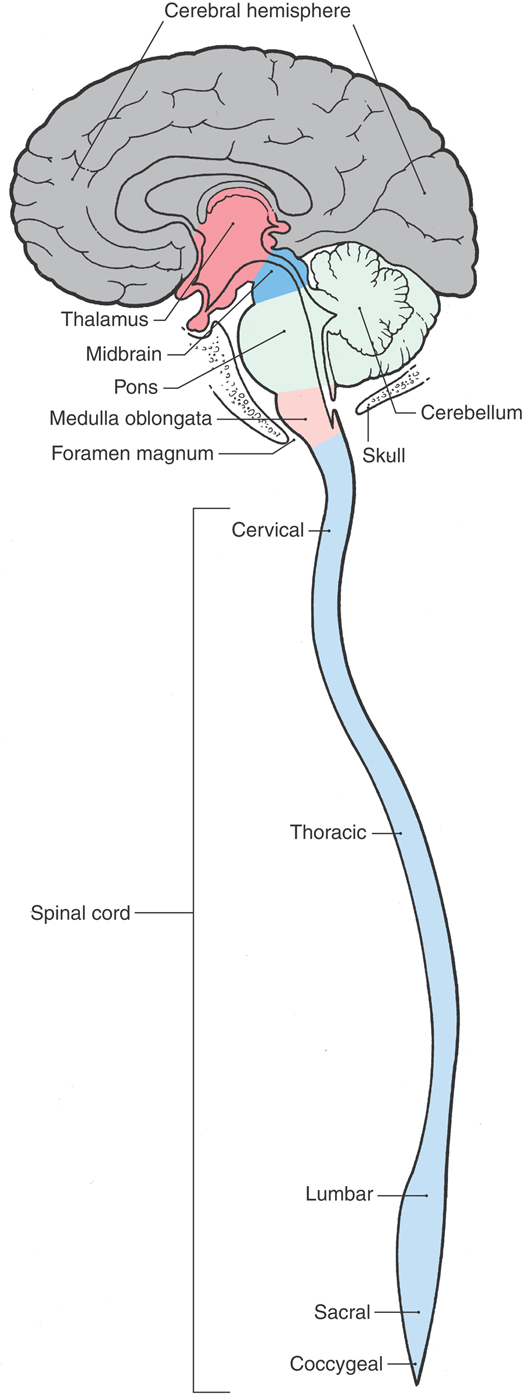
Figure 1-3. The basic divisions of the central nervous system.
Medulla Oblongata
At the level of the foramen magnum, the spinal cord is continuous with the most caudal part of the brain, the medulla oblongata, commonly called the medulla (Fig. 1-3). The medulla consists of (1) neurons that perform functions associated with the medulla and (2) ascending (generally sensory) and descending (generally motor) tracts that pass through the medulla on their way from or to the spinal cord. Some of the neuronal cell bodies of the medulla are organized into nuclei associated with specific cranial nerves. The medulla contains the nuclei for the glossopharyngeal (cranial nerve IX), vagus (X), and hypoglossal (XII) nerves as well as portions of the nuclei for the trigeminal (V), vestibulocochlear (VIII), and spinal accessory (XI) nerves. It also contains important relay centers and nuclei that are essential to the regulation of respiration, heart rate, and various visceral functions.
Pons and Cerebellum
The pons and cerebellum originate embryologically from the same segment of the developing neural tube. However, in the adult, the pons forms part of the brainstem (the other parts being the midbrain and medulla) and the cerebellum is a suprasegmental structure because it is located posterior (dorsal) to the brainstem (Fig. 1-3).
Like the medulla, the pons contains many neuronal cell bodies, some of which are organized into cranial nerve nuclei, and it is traversed by ascending and descending tracts. The pons contains the nuclei of the abducens (VI) and facial (VII) nerves and portions of the nuclei for the trigeminal (V) and vestibulocochlear (VIII) nerves. The anterior (ventral) part of the pons contains large populations of neurons (pontine nuclei) that form a relay station between the cerebral cortex and cerebellum and descending motor fibers that travel to all spinal levels.
The cerebellum is connected with diverse regions of the CNS and is considered part of the motor system. It serves to coordinate the activity of individual muscle groups to produce smooth, purposeful, synergistic movements.
Midbrain
Rostrally, the pons is continuous with the midbrain (Fig. 1-3). This part of the brain is, quite literally, the link between the brainstem and the forebrain. Ascending or descending pathways to or from the forebrain must traverse the midbrain. The nuclei for the oculomotor (III) and trochlear (IV) cranial nerves as well as part of the trigeminal (V) complex are found in the midbrain. Other midbrain centers are concerned with visual and auditory reflex pathways, motor function, transmission of pain, and visceral functions.
Thalamus
The forebrain consists of the cerebral hemispheres, large groups of neurons that comprise the basal nuclei, and the thalamus (Fig. 1-3). We shall see later that the thalamus actually consists of several regions—for example, the hypothalamus, subthalamus, epithalamus, and dorsal thalamus. The thalamus is also commonly called the diencephalon, a term that reflects its embryologic origin.
The thalamus is rostral to the midbrain and almost completely surrounded by elements of the cerebral hemisphere. Individual parts of the thalamus can be seen in detail only when the brain is cut in coronal or axial planes.
With the exception of olfaction, all sensory information that eventually reaches the cerebral cortex must pass through the thalamus. One function of the thalamus, therefore, is to receive sensory information of many sorts and to distribute it to the specific regions in the cerebral cortex that are specialized to decode it. Other areas of the thalamus receive input from pathways conveying information on, for example, position sense or the tension in a tendon or muscle. This input is relayed to areas of the cerebral cortex that function to generate smooth, purposeful movements.
Although it is small, the hypothalamus functions in sexual behavior, feeding, hormonal output of the pituitary gland, body temperature regulation, and a wide range of visceromotor functions. Through descending connections, the hypothalamus influences visceral centers in the brainstem and spinal cord.
Cerebral Hemispheres
The largest and most obvious parts of the human brain are the two cerebral hemispheres. Each hemisphere is composed of three major subdivisions. First, the cerebral cortex is a layer of neuronal cell bodies about 0.5 cm thick that covers the entire surface of the hemisphere. This layer of cells is thrown into elevations called gyri (singular, gyrus) separated by creases called sulci (singular, sulcus).
The second major part of the hemisphere is the subcortical white matter, which is made up of myelinated axons that carry information to or from the cerebral cortex. The largest and most organized part of the white matter is the internal capsule. This bundle contains fibers passing to and from the cerebral cortex, such as corticospinal and thalamocortical fibers.
The third major component of the hemisphere is a prominent group of neuronal cell bodies collectively called the basal nuclei. These prominent forebrain centers are involved in motor function. Parkinson disease, a neurologic disorder associated with the basal nuclei, is characterized by a profound impairment of movement.
The gyri and sulci that make up the cerebral cortex are named, and many are associated with particular functions. Some gyri receive sensory input from thalamic relay nuclei, whereas descending fibers from these gyri may influence centers in the brainstem or spinal cord. The cerebral cortex also has association areas that are essential for analysis and cognitive thought.
FUNCTIONAL SYSTEMS AND REGIONS
A functional system is a set of neurons linked together to convey a particular block of information or to accomplish a particular task. In this respect, systems and pathways, in some cases, may be similar, and their meanings may frequently overlap.
Anatomic parts of the CNS, such as the medulla and pons, are commonly called regions. The study of their structure and function, called regional neurobiology, is the focus of the second section of this book. Systems and pathways, however, generally traverse more than one region. The system of neurons and axons that allows you to feel the edge of this page, for example, crosses every region of the nervous system between your fingers and the somatosensory cortex of the cerebral hemisphere. The study of functional systems, called systems neurobiology, is the focus of the third section of this text. It is important to remember that the functional characteristics of regions coexist with those of systems.
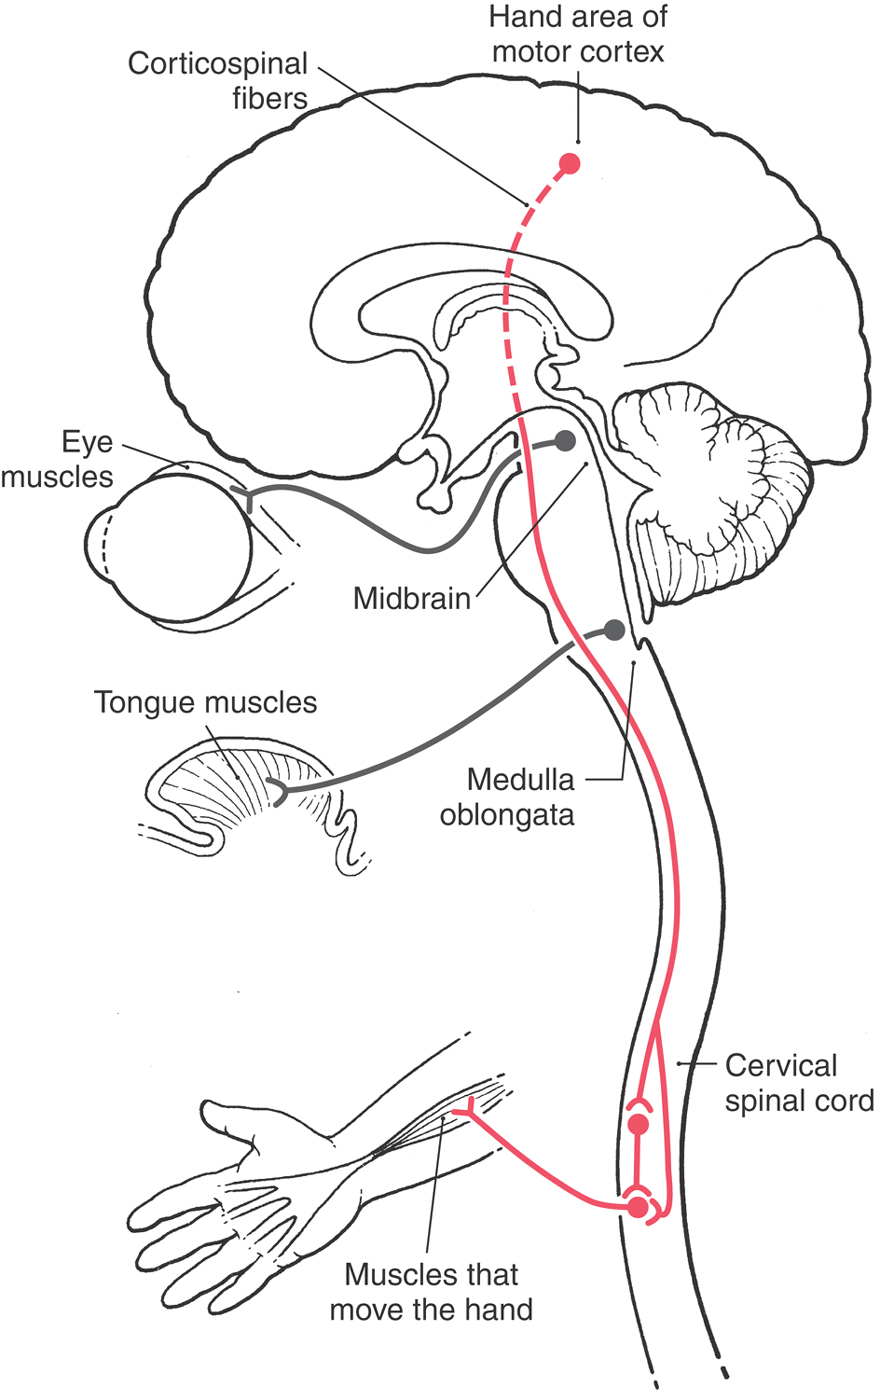
Let us consider an example of how the interrelation of systems and regions can be important clinically. The signals that influence movements of the hand originate in the cerebral cortex. Neurons in the hand area of the motor cortex send their axons to cervical levels of the spinal cord, where they influence spinal motor neurons that innervate the muscles of the forearm. These are called corticospinal fibers because their cell bodies are in the cerebral cortex (cortico-) and their axons end in the spinal cord (-spinal). These fibers pass through the subcortical white matter, the entire brainstem, and the upper levels of the cervical spinal cord. En route, they pass near nuclei and fiber tracts that are specific to that particular region (Fig. 1-4). In the midbrain, for example, they pass near fibers of the oculomotor nerve, which originate in the midbrain and control certain extraocular muscles. In the medulla, they pass near fibers that originate in the medulla and innervate the musculature of the tongue. An injury to the midbrain could therefore cause motor problems in the hand (systems damage) combined with partial paralysis of eye movement (regional damage). In similar fashion, an injury to the medulla could cause the same hand problem but now in association with partial paralysis of the tongue rather than of eye movements. Successful diagnosis of patients with neurologic disorders will depend on, among other things, a good understanding of both regional and systems neurobiology.
Localizing Signs and Localization
The example (Fig. 1-4) of corticospinal fibers that innervate spinal motor neurons serving the hand coupled with neuron cell bodies in the midbrain that innervate eye muscles via the oculomotor nerve also illustrates the concept of localizing signs. Brain injury that results in only a weakness or paralysis of the upper extremity generally localizes the lesion only to one cerebral hemisphere or perhaps to one side of the brainstem. The clinical examination does not tell us which region of the brain is injured (internal capsule, midbrain, pons, or medulla) or, for that matter, even whether the lesion is in the upper portions of the cervical spinal cord. However, if the paralysis of the upper extremity is coupled with a partial paralysis of eye movement, the lesion can be specifically localized to the midbrain. In this example, the lesion in the midbrain damages the fibers of the oculomotor nerve that are specific to this level, whereas the corticospinal fibers are injured as they traverse the midbrain (Fig. 1-4). In general, cranial nerve signs are more helpful than long tract signs in localizing the lesion; that is, they are better localizing signs.
Another general concept of localization states that certain combinations of neurologic deficits may indicate involvement of one of three general locations of the CNS. First, deficits (motor or sensory) located on the same side of the head and body frequently signify lesions in the cerebral hemisphere. Second, deficits on one side of the head and on the opposite side of the body generally indicate a lesion in the brainstem. Such deficits are called crossed (or alternating) deficits. Third, deficits of the body only usually suggest a lesion in the spinal cord. Although there are exceptions to these general rules, we shall see that they hold true in many clinical situations.
CONCEPT OF AFFERENT AND EFFERENT
The terms afferent and efferent are used to describe a variety of structures in the human body, such as nerve fibers, small vessels, and lymphatics. Afferent refers to conduction (of an impulse on a nerve or fluid in a vessel) toward a structure; this is an incoming bit of information. Efferent refers to conduction (of an impulse or fluid) away from a structure; this is an outgoing bit of information.
In this respect, the posterior root of the spinal nerve is afferent because it conducts sensory impulses toward the spinal cord, whereas the anterior root is efferent because it conducts motor impulses away from the spinal cord (Figs. 1-1 and 1-2). This has given rise to the widely held but incorrect view that afferent nerve fibers are always sensory and efferent nerve fibers are always motor. Although this may be true for the restricted examples of spinal and cranial nerves, the terms afferent and efferent can also be used to designate bundles of fibers (axons) traveling toward or away from a specific nucleus.
Whether a bundle of axons is afferent or efferent, in relation to a specific nucleus, depends on what reference point is selected to define the bundle and its relationships. For example, the neuron cell body in nucleus A in Figure 1-5 gives rise to an axon that is an efferent of nucleus A (conducting away from), but at the same time, this axon is an afferent of nucleus B (coming toward). If nucleus B is chosen as the reference point, it would be described as receiving afferent input from nucleus A and sending efferent impulses to nucleus C (Fig. 1-5). The use of these terms is commonplace in describing connections within the nervous system. For example, as described in the previous section, corticospinal fibers are efferents of the cerebral cortex and, at the same time, afferents to the spinal cord.
POSTERIOR (DORSAL), ANTERIOR (VENTRAL), AND OTHER DIRECTIONS IN THE CENTRAL NERVOUS SYSTEM
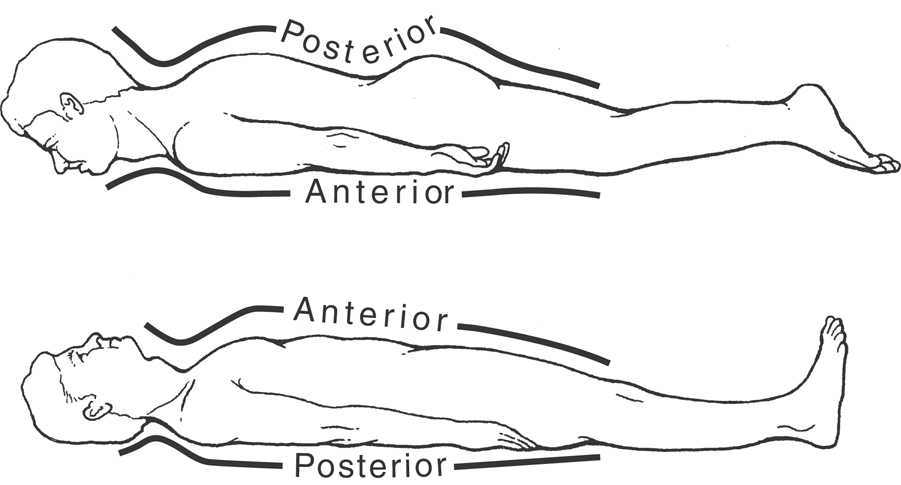
By convention, directions in the human CNS—such as posterior (dorsal) and anterior (ventral), medial (toward or at the midline) and lateral (away from the midline), rostral (or rostrad, a direction toward the nose), and caudal (or caudad, a direction toward the tail)—are absolute with respect to the central axis of the brain and spinal cord. In a similar manner, the anatomic orientation of the body in space is related to its central axis. For example, if the patient is lying on his or her stomach, the posterior surface of the trunk is up and its anterior surface is down (Fig. 1-6). If the patient rolls over, the back remains the posterior surface of the patient’s body even though it now faces down.
As shown in Figure 1-7, the spinal cord and the brainstem (medulla, pons, and midbrain) form a nearly straight line that is roughly parallel with the superoinferior axis of the body. Therefore anatomic directions in these regions of the CNS coincide roughly with those of the body as a whole.
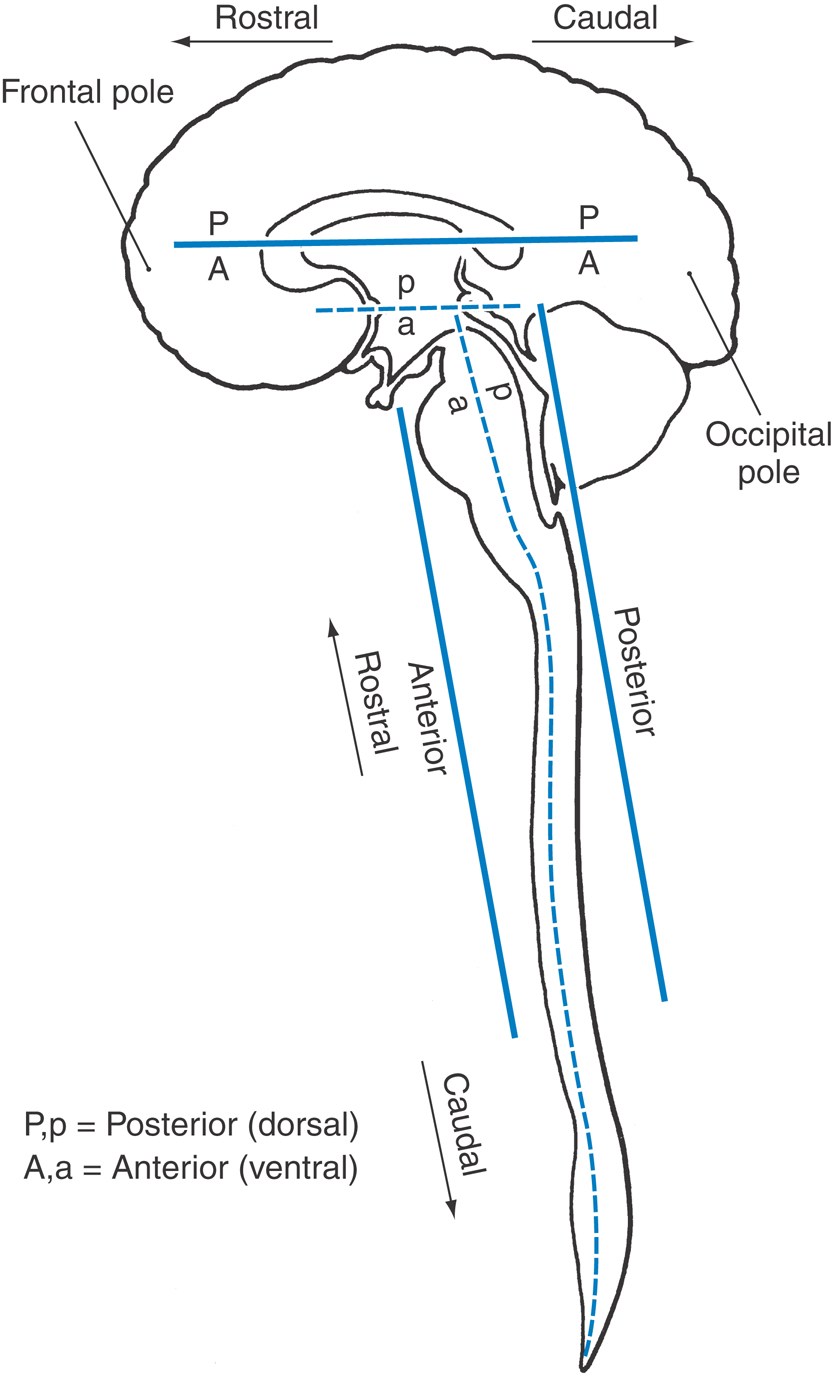
During embryonic development, the forebrain rotates (at the cephalic flexure) relative to the midbrain until its rostrocaudal axis corresponds to a line drawn from the forehead to the occiput (from the frontal to the occipital poles of the cerebral hemispheres). This rotation creates a sharp angle in the long axis of the CNS at the midbrain-thalamus junction. Consequently, the long axis of the CNS bends at the midbrain-thalamus junction, and the directions posterior and anterior follow accordingly (Fig. 1-7).
In the cerebral hemisphere (forebrain), posterior (dorsal) is toward the top of the brain, anterior (ventral) is toward the base of the brain, rostral is toward the frontal pole, and caudal is toward the occipital pole. Anatomic directions in the forebrain relate to its long axis; therefore the posterior side of the forebrain structures faces the vertex of the head, and the anterior aspect of the forebrain faces the base of the skull (Fig. 1-7). Posterior and dorsal and anterior and ventral are considered synonymous and are commonly and frequently used interchangeably.
These directional terms are extremely valuable in the description of the relative position of a structure within the brain or spinal cord or the relative positions of two structures to each other. For example, the midbrain is rostral to the pons but caudal to the thalamus (Fig. 1-3). The midbrain is selected as the reference point and adjacent structures are described in relation to it. Also, directional terms, such as posterior and lateral, can be combined to describe a structure that occupies an intermediate position. For example, the nuclei in the spinal cord transmitting sensory information can be described as posterolateral to the central canal.
SYMPTOM OR SIGN?
These terms are used literally every day in countless clinical settings and serve to form an essential and important part of the physician-patient relationship—that is, the communication of information that will result in proper and successful medical treatment. It is useful to establish what constitutes a symptom versus a sign at this early point. These concepts and definitions are revisited throughout subsequent chapters.
Symptom
A symptom is a departure from any normal state of structure or function that is experienced by the patient. In other words, something is wrong and the patient knows it. Symptoms may develop slowly, almost imperceptibly, as in a slow-growing tumor or as part of the aging process, or appear suddenly, as in hemorrhage or trauma. A symptom such as pain may be clear to the patient (a symptom) but difficult for the attending physician to evaluate. A symptom is a subjective indicator of a presumably abnormal process.
Sign
A sign is a departure from any normal state of structure or function that is discovered, observed, and evaluated by a health care professional on examination of the patient. In this situation, the clinical problem (be it great or small) is seen and can be evaluated by the physician. It is possible that a patient may have signs of a disease process, seen during the examination, that he or she is unaware of; the patient has signs but no symptoms. A sign is an objective indicator of a presumably abnormal process.
CLINICAL IMAGES OF THE BRAIN AND SKULL
The most routinely used methods to image the brain and skull are computed tomography (CT) and magnetic resonance imaging (MRI) (Fig. 1-8). As we shall see, CT is especially useful in visualizing the skull and the brain in the early stages of subarachnoid hemorrhage. On the other hand, MRI, by use of T1-weighted or T2-weighted techniques, shows brain anatomy in elegant detail, cisternal relationships, cranial nerves, and a wide variety of clinical abnormalities.
Magnetic resonance angiography (MRA) visualizes arteries and veins by measuring the velocity of flow in these structures (Fig. 1-9A). The resultant images show detail of vascular structures that, in some situations, may be superior to that seen on angiograms. Arterial structures may be selectively imaged, or combinations of arterial and venous structures or only venous structures can be visualized. Some clinicians refer to these images of venous structures as MRVs (magnetic resonance venograms).
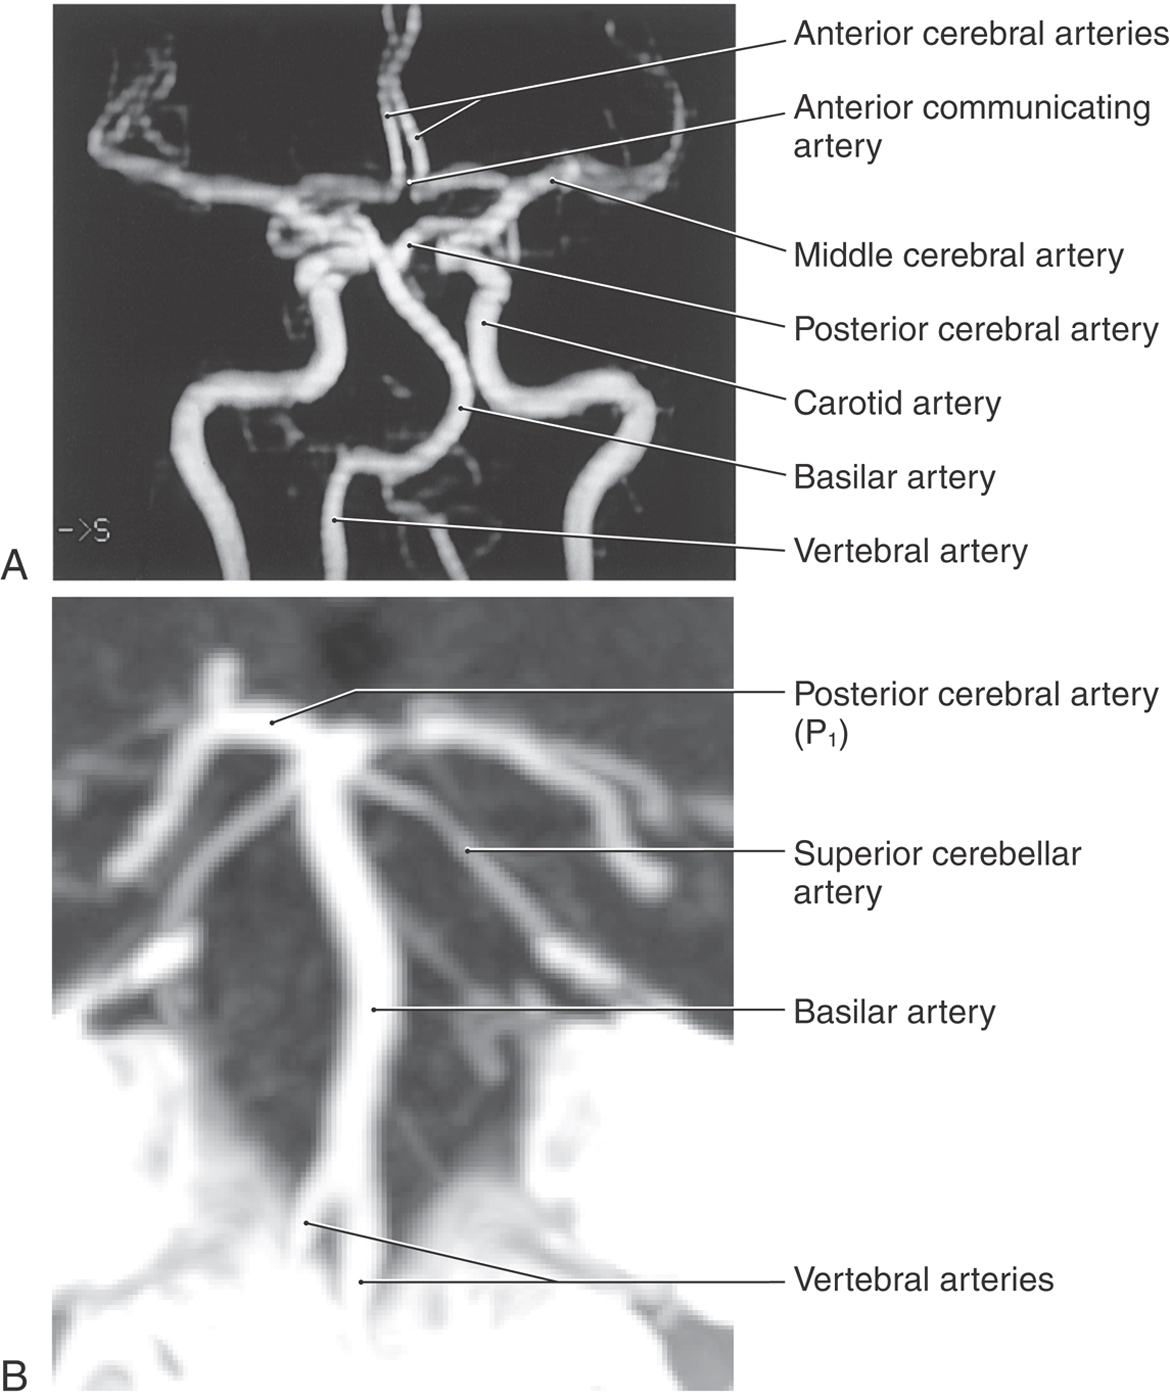
Computed tomography angiography (CTA, Fig. 1-9B) visualizes arteries with use of an injectable radiopaque substance (such as ioversol, Optiray 300) that can be infused through superficial veins on the upper extremity. When x-rays are passed through the patient, the infused vessels appear clearly more white than the surrounding brain (they are hyperdense). As with MRA, arterial and venous structures may be imaged in great detail, and in certain clinical situations, CTA offers advantages over standard angiography.
Computed Tomography
CT is an x-ray imaging technique that measures the effects that tissue density and the various types of atoms in the tissue have on x-rays passing through that tissue (Table 1-1; see also Fig. 1-8A, B). Changes in the emerging x-ray beam are measured by detectors.
Table 1-1 Appearance of Tissues Imaged by CT and MRI
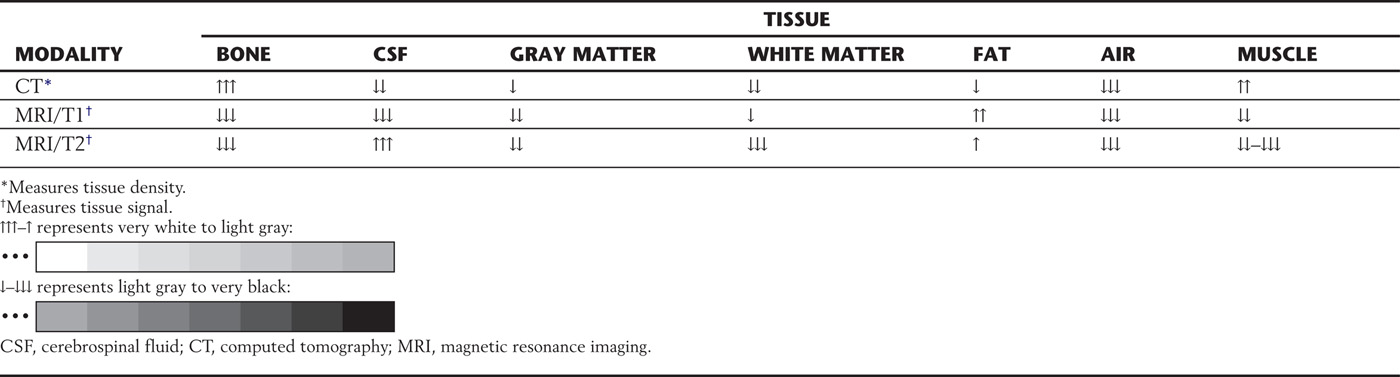
The higher the atomic number, the greater the ability of the atom to attenuate, or stop, x-rays. These attenuation transmission intensities emerging from the tissue are transformed by a computer into numbers that represent values found in all the points located in the volume of the tissue slice. These values are expressed in Hounsfield units (HUs). HU values, also known as CT numbers, are used in an arbitrary scale in which bone is specified as +1000 (and is very white; Fig. 1-8A, B), water as zero, and air as −1000 (and is very black). With use of this scale, the HU values, or CT numbers, represent specific shades of gray for each of the various points located in the slice (Table 1-1; see also Fig. 1-8A, B).
Present-generation CT scanners, known as helical (spiral) scanners, image a continuous spiral slice through a preselected body region very quickly. Computer software converts this information into contiguous slices of a chosen thickness. This technique eliminates movement artifacts and enables reconstruction of soft tissues, bone, or contrast medium–enhanced vessels into three-dimensional images that can be manipulated in any plane.
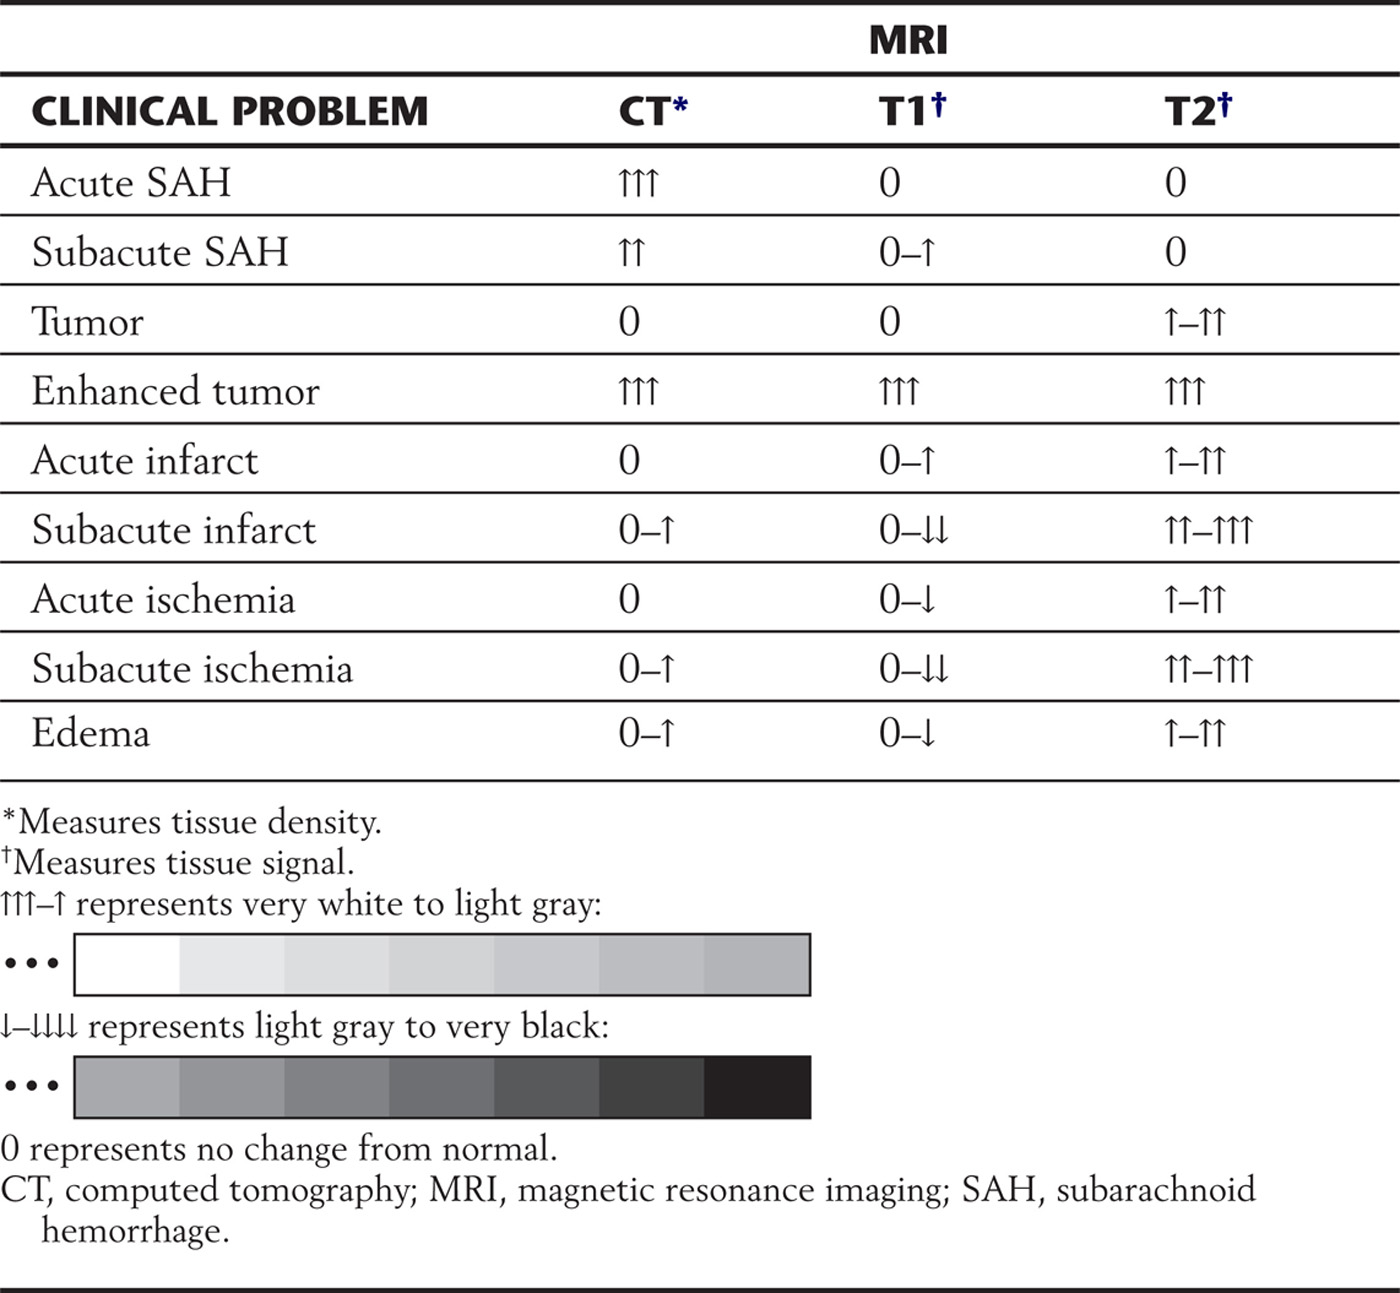
CT is a fast and accurate method of detecting recent subarachnoid hemorrhage (Table 1-2; see also Fig. 1-8A). An acute subarachnoid hemorrhage in a noncontrast CT scan appears hyperdense (white) in contrast to the subarachnoid spaces and cisterns, which normally are hypodense (dark).
Table 1-2 Differences in CT Density and MRI Signals in Representative Clinical Examples
Enhanced CT is a technique using an iodinated contrast material injected intravenously followed by CT examination. Iodine has a large atomic number and attenuates x-rays. As a result, vasculature is visualized as hyperdense (white) structures. This contrast material may also enhance neoplasms or areas of inflammation because the contrast agent leaks from the vessels into the cellular spaces owing to a breakdown of the blood-brain barrier. Imaged in this way, the tumor, inflamed meninges, or brain parenchyma will show varying degrees of enhancement or hyperdensity (varying degrees of whiteness).
Magnetic Resonance Imaging
Protons (hydrogen) constitute a large proportion of body tissue. These atoms have a nucleus and a shell of electrons and a north and a south pole, and they spin around an angulated axis like small planets. As the electrons move with the spinning atom, they induce an electrical current that creates a magnetic field. These atoms function somewhat like little spinning bar magnets. They are aligned randomly because of the changing magnetic effects on each other. When these protons are exposed to a powerful magnet, they stop pointing randomly and align themselves parallel to the external magnetic field but at different energy levels. The stronger the external magnetic field, the faster the frequency of the spin at that angle. When undergoing an MRI examination, the patient becomes a magnet, with all the protons aligning along the external magnetic field and spinning at an angle with a certain frequency.
A radio wave is an electromagnetic wave. When a radio wave is sent as a short burst into the magnet containing the patient, it is known as a radiofrequency (RF) pulse. This RF pulse can vary in frequency strength. Only when the frequency strength of the RF pulse matches the frequency strength of the angulated spinning proton will the proton absorb energy from the radio wave. This phenomenon is called resonance and is the “resonance” in “magnetic resonance imaging.” This results in a twofold effect: it cancels out the magnetic effects of certain protons, and it raises the energy levels and magnetic effects of another group of protons. When the radio wave is turned off, the canceled-out protons gradually return to their original state and strength of magnetization, which is called relaxation and is described by a time constant known as T1 (Fig. 1-8D). The protons that aligned themselves at a higher energy level and magnetization also start to lose their energy (relaxation), and this time constant is known as T2 (Fig. 1-8C). The T1 relaxation time is longer than the T2 relaxation time. The “de-excited” or relaxed protons release their energy as an “echo” of radio waves. A receiver coil (antenna) absorbs this information, and a computer determines the characteristics of the emitted radio waves from all the specific points in that section of the body. The MR image is then constructed and transferred to a computer monitor or recorded on film. T1-weighted or T2-weighted images can be obtained by use of varying times to receive the echoes (TE).
Conventional spin-echo sequences generate images that may be T1-weighted or T2-weighted according to the time interval in milliseconds between each exciting radio wave. This is called repetition time (TR). The time interval, in milliseconds, required to collect these radio waves from the relaxing protons is called echo time (TE). With spin-echo pulse sequences, the shorter the TR and TE, the more the image is considered T1-weighted. The longer the TR and TE, the more the image is considered T2-weighted.
The contrast material used to enhance tumors and blood vessels is the paramagnetic rare earth gadolinium. It is chelated to a certain molecule and is in solution for intravenous injection. The gadolinium causes an increase in signal by shortening the relaxation time for T1. Owing to a breakdown of the blood-brain barrier, intravascular gadolinium enters the pericellular spaces, where it increases the relaxation state of water protons and generates a bright signal on T1-weighted images (Table 1-1).
Acute subarachnoid hemorrhage is poorly imaged by MRI on T1-weighted images but well imaged by CT (Table 1-2). Some MRI sequences are sensitive for detection of acute bleeding, but other factors may limit this method of examination. Special MRI techniques can also determine if a brain infarct or ischemia is acute (about 1 to 3 hours old) or subacute (about 4 hours old or more). Contraindications to MRI are cardiac pacemakers, cochlear implants, implantable cardioverter-defibrillators, ferromagnetic foreign bodies in the eye, and certain aneurysm clips. Large metallic implants or ferromagnetic foreign bodies in the body may heat up. The general appearance of the brain and adjacent structures in health and disease on MRI and CT is summarized in Tables 1-1 and 1-2.
Image Density and Intensity
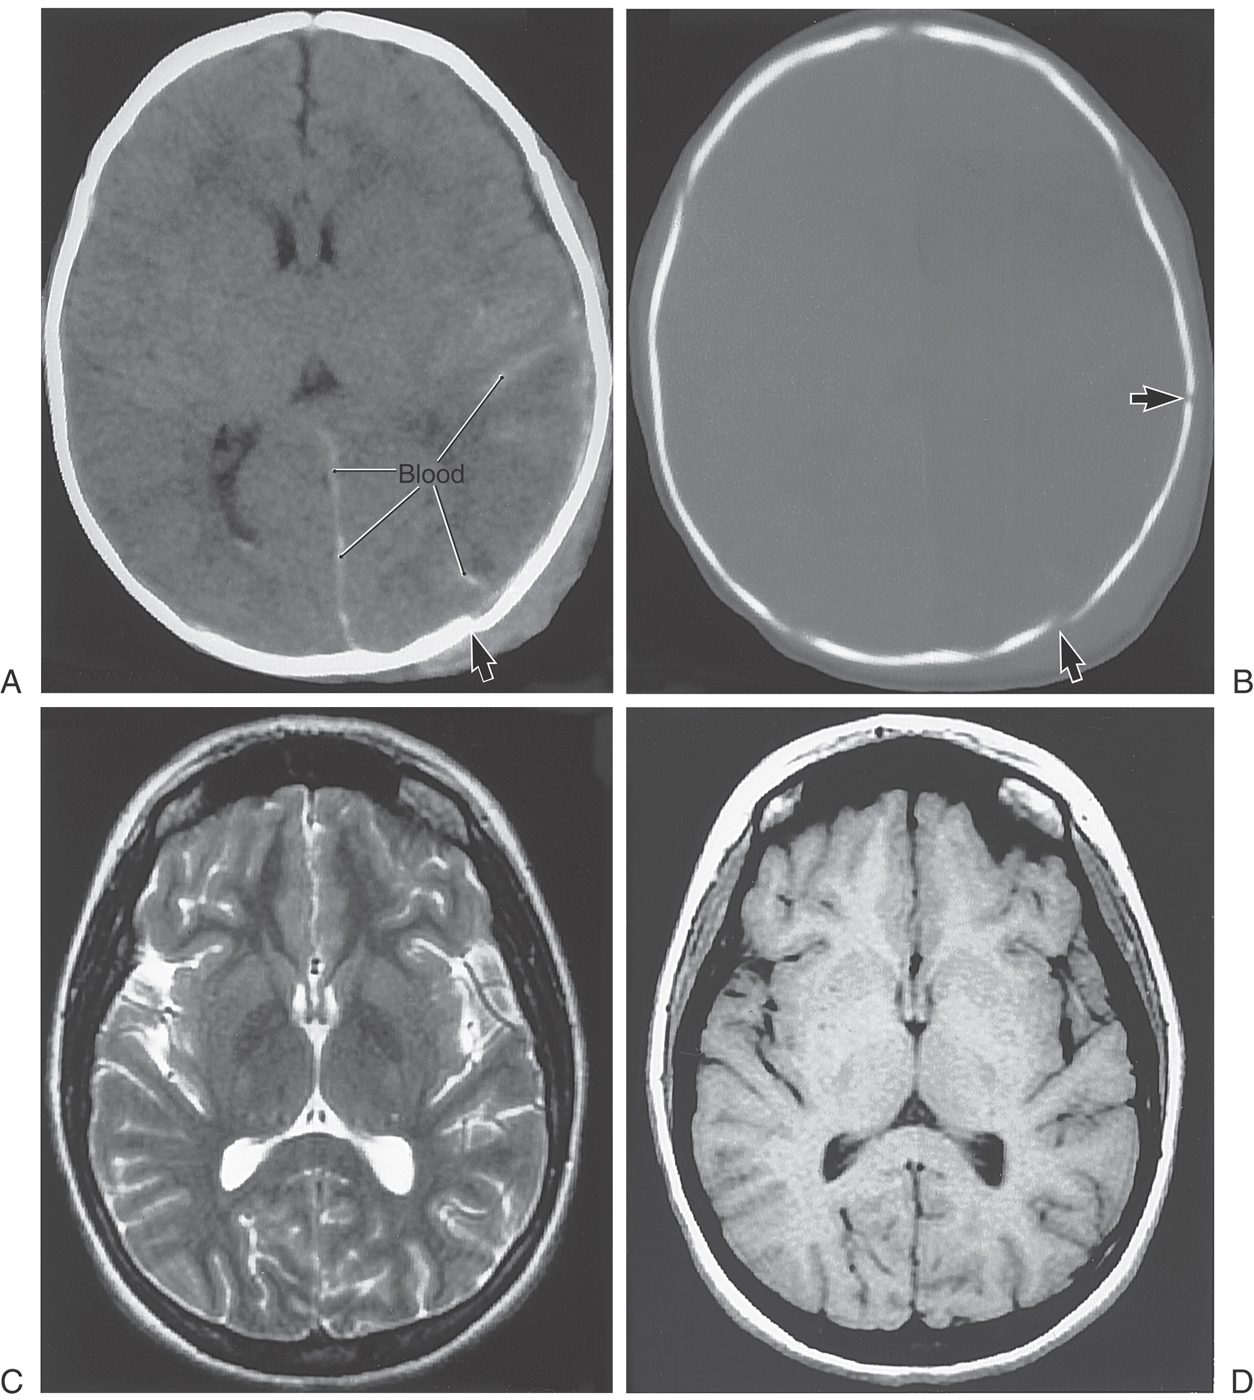
As described before, a CT scan is produced when the patient is placed between a source of x-rays and detectors; the degree to which the tissues of the body attenuate these x-rays is a measure of its density. The various textures of gray seen in CT are a representation of this relative tissue density. Hyperdense, hypodense, and isodense are terms used in the clinical setting to specify various abnormal states in CT. Bone in CT greatly attenuates x-rays, has a high CT number, and appears white. Acute subarachnoid blood in CT is hyperdense; its appearance is shifted toward that of bone and is clearly whiter than the surrounding brain (Fig. 1-10A). On the other hand, air in CT poorly attenuates x-rays, has a low CT number, and appears black. An area of ischemia in CT is hypodense; its appearance is shifted toward that of air (or cerebrospinal fluid) and is darker than the surrounding brain (Fig. 1-10B, arrows). When the lesion, or tissue damage, appears basically the same as the surrounding brain, it is specified as isodense (Fig. 1-10C, arrow).
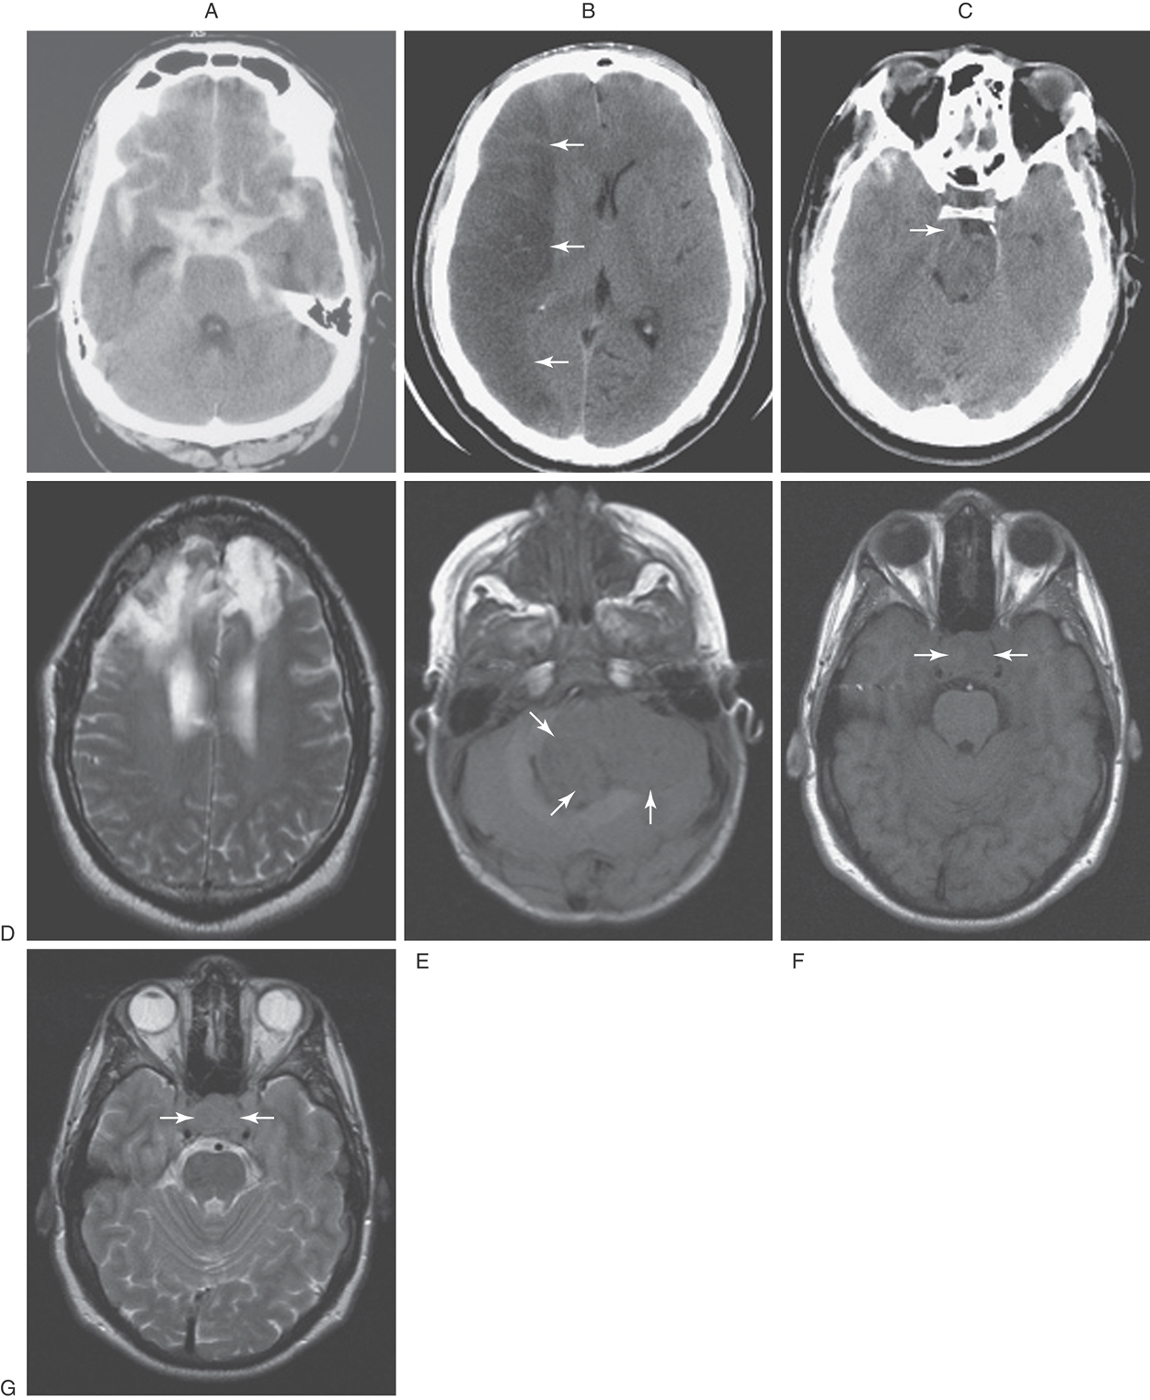
Also described before, an MR image is produced when the patient is exposed to a magnetic field and the effects of this field on protons within the body are measured. Under the influence of an external magnet, these protons align themselves parallel to the source. When the external source is removed, the protons “relax”; those that relax more slowly from a lower energy level produce a T1-weighted image, whereas those that relax more rapidly from a higher energy level produce a T2-weighted image. Hyperintense, hypointense, and isointense specify various abnormal states in MRI in the clinical setting. In the normal patient, fat (T1) and cerebrospinal fluid (T2) appear distinctly more white. A lesion that is hyperintense in MRI appears whiter than the surrounding brain—for example, a meningioma and the surrounding edema (Fig. 1-10D). An example of a tumor that is hypointense is a medulloblastoma in the posterior fossa; this lesion appears darker than the surrounding brain (Fig. 1-10E, arrows). In between these extremes are lesions that are isointense; these lesions have basically the same appearance as the surrounding brain (Fig. 1-10F, G, between arrows).
Imaging of the Brain and Skull
Patients lie on their backs (supine) for imaging of the brain or spinal cord and the surrounding bony structures (Fig. 1-11). In this position, the posterior (dorsal) surface of the brainstem and spinal cord and the caudal aspect (occipital pole) of the cerebral hemispheres face down. The anterior (ventral) surface of the brainstem and spinal cord and the frontal pole are face up (Fig. 1-11).
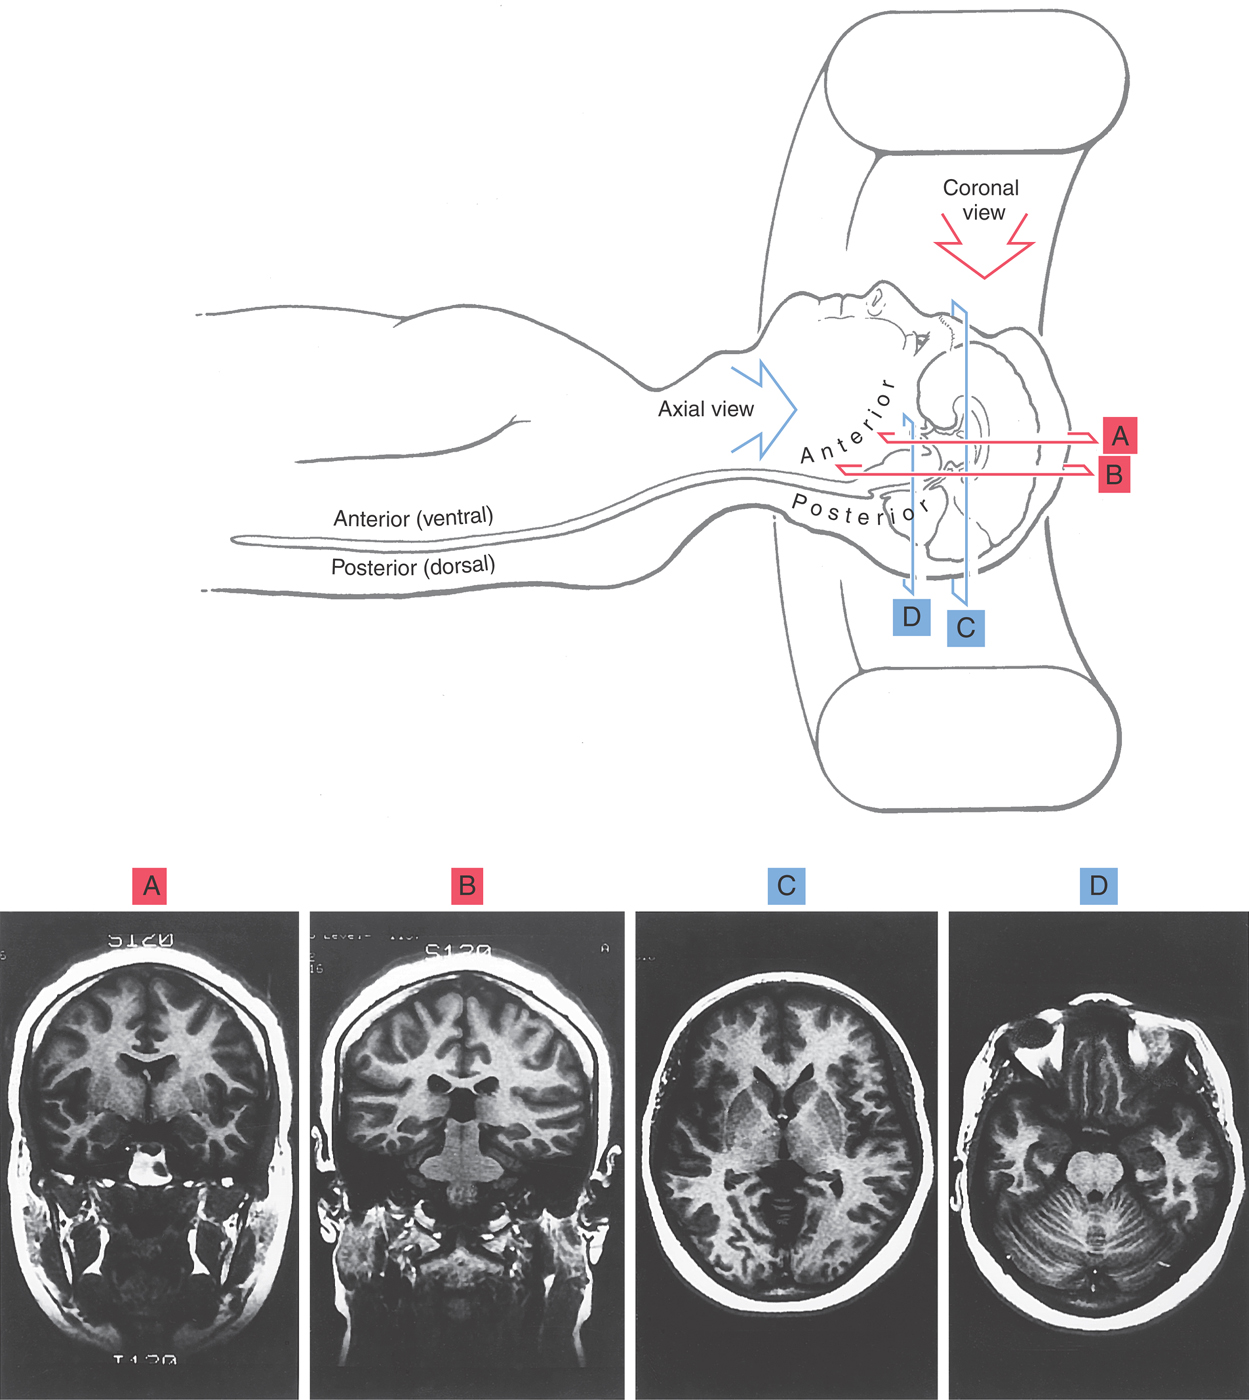
Images of the brain are commonly made in coronal, axial (horizontal), and sagittal planes. To illustrate the basic orientation of the CNS in situ, we shall look at examples of images in all three of these planes as they appear in the clinical setting (Figs. 1-11 and 1-12). Coronal imaging planes are oriented perpendicular to the rostrocaudal axis of the forebrain but are nearly parallel to the rostrocaudal axis of the brainstem and spinal cord. Therefore a coronal image obtained at a relatively rostral level of the cerebral hemispheres (Fig. 1-11A) will show only forebrain structures, and these structures will appear in cross section (perpendicular to their long axis). As the plane of imaging is moved caudally, brainstem structures enter the picture (Fig. 1-11B), but the brainstem is cut nearly parallel to its rostrocaudal axis.
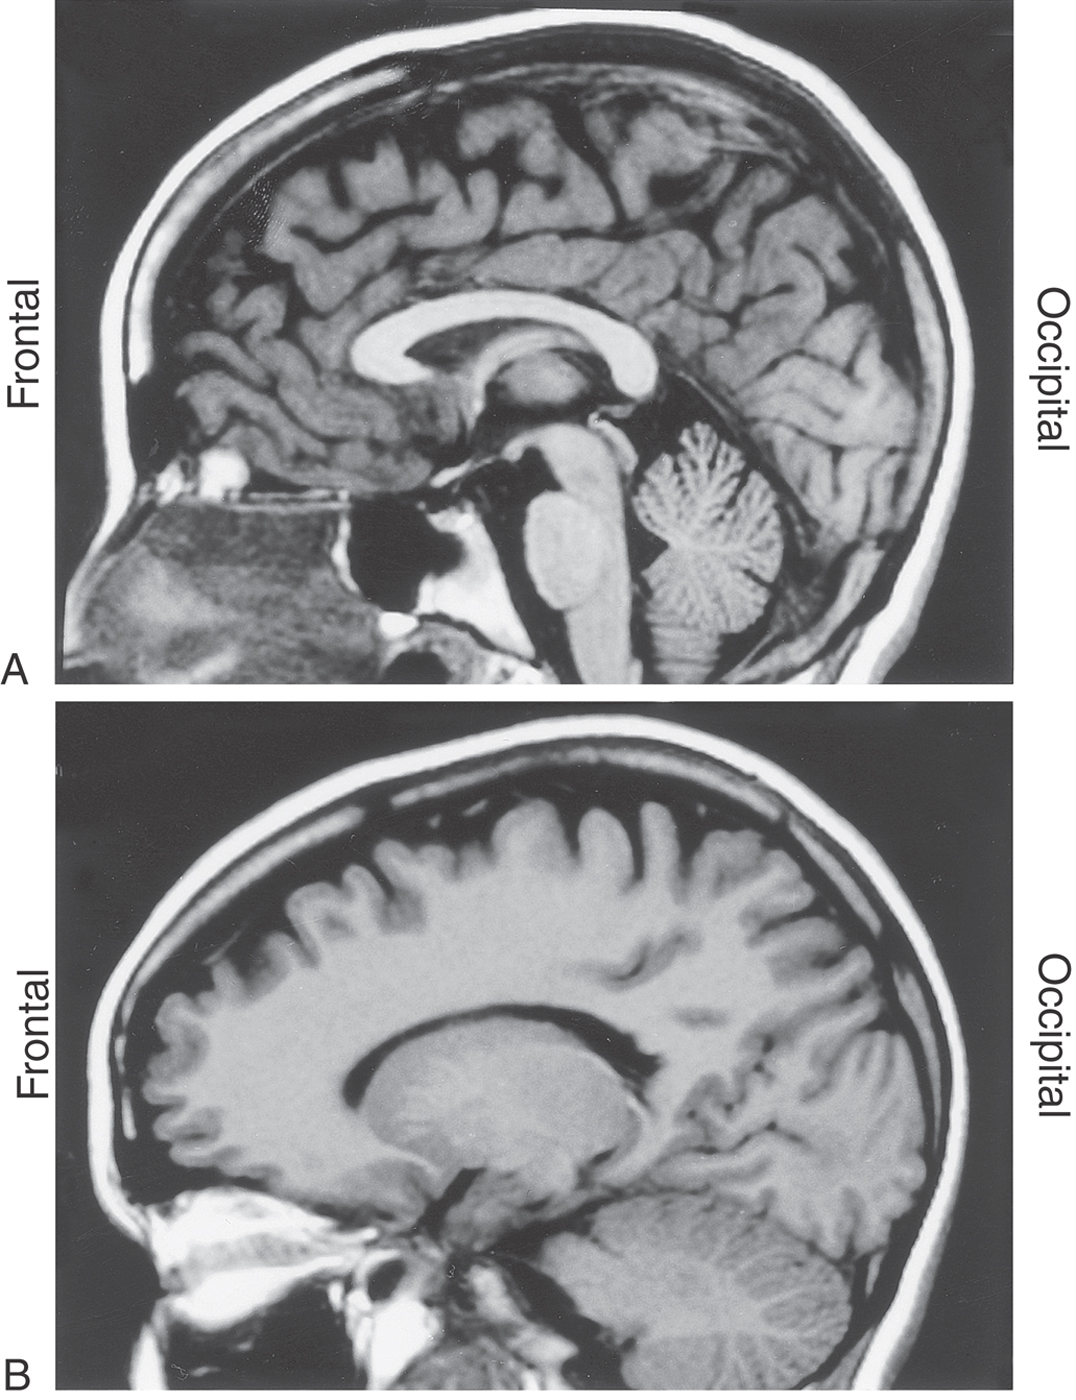
Figure 1-12. MRI of the brain in the median sagittal plane (A) and in the sagittal plane but off the midline (B). The frontal lobe is to the left, and the occipital lobe is to the right. Other directions within the brain in this plane are appreciated by a comparison with Figure 1-7.
Axial images, in contrast, are oriented parallel to the rostrocaudal axis of the cerebral hemispheres but nearly perpendicular to the long axis of the brainstem and spinal cord. Consequently, an axial image obtained midway through the cerebral hemispheres (Fig. 1-11C) will show only forebrain structures, with the rostral end of the forebrain at the top of the image and the caudal end at the bottom. As the plane of imaging is moved farther anteriorly (ventrally) relative to the forebrain, the brainstem appears (Fig. 1-11D). The brainstem, however, is cut nearly in cross section and is oriented with the anterior (ventral) surface “up” (toward the top of the image) and the posterior (dorsal) surface “down.”
Images made in the sagittal plane are at, or parallel to, the midsagittal plane of the brain or spinal cord. This is the plane running right through the middle (midline) of the head from rostral to caudal (along the frontal to occipital axis) or along the midline of the spinal cord in a rostrocaudal axis. Sagittal images of the brain, be they at the midline (Fig. 1-12A) or in the sagittal plane but off the midline (Fig. 1-12B), are oriented such that the frontal area is to the left and the occipital area is to the right. The various directions within the brain can be appreciated with a comparison of the midsagittal MR image with a drawing in the comparable orientation (compare Fig. 1-7 with Fig. 1-12A).
A point also needs to be made about how the clinician looks at CT or MRI scans. Coronal scans are viewed as though you are looking the patient in the face, whereas axial scans are viewed as though you are standing at the patient’s feet looking toward the head while the patient lies supine in the machine. Axial scans, in other words, show the cerebral hemispheres from anterior (the more inferior portion of the hemisphere) to posterior (the more superior portion of the hemisphere), with the patient’s frontal area and orbits at the top of the image and the occiput at the bottom. In both coronal and axial views, the patient’s left side is to the observer’s right. This is an absolutely essential concept to remember as one examines MRI and CT scans.
Sources and Additional Reading
Kirkwood JR. Essentials of Neuroimaging. New York: Churchill Livingstone; 1990.
Osborn AG. Diagnostic Neuroradiology. St. Louis: Mosby; 1994.
[/level-membership-for-basic-science-category][not-level-membership-for-basic-science-category]Chapter 1
Orientation to the Structure and Imaging of the Central Nervous System
Central, Peripheral, and Visceromotor Nervous Systems
Regions of the Central Nervous System
Functional Systems and Regions
Localizing Signs and Localization
Concept of Afferent and Efferent
Posterior (Dorsal), Anterior (Ventral), and Other Directions in the Central Nervous System
Our nervous system makes us what we are. Personality, outlook, intellect, coordination (or lack thereof), and the many other characteristics are the result of complex interactions within our nervous system. Information is received from the environment and transmitted into the brain or spinal cord. Once this sensory information is processed and integrated, an appropriate motor response is initiated.
The nervous system can be viewed as a scale of structural complexity. At the microscopic level, the individual structural and functional unit of the nervous system is the neuron, or nerve cell. Interspersed among the neurons of the central nervous system are supportive elements called glial cells. At the macroscopic end of the scale are the large divisions (or parts) of the nervous system that can be handled and studied without magnification. These two extremes are not independent but form a continuum; functionally related neurons aggregate to form small structures that combine to form larger structures. Communication takes place at many different levels, the end result being a wide range of productive or life-sustaining nervous activities.
OVERVIEW
Central, Peripheral, and Visceromotor Nervous Systems
The human nervous system is divided into the central nervous system (CNS) and the peripheral nervous system (PNS) (Fig. 1-1A). The CNS consists of the brain and spinal cord. Because of their locations in the skull and vertebral column, these structures are the most protected in the body. The PNS is made up of nerves that connect the brain and spinal cord with peripheral structures. These nerves innervate muscle (skeletal, cardiac, smooth) and glandular epithelium and contain a variety of sensory fibers. These sensory fibers enter the spinal cord through the posterior (dorsal) root, and motor fibers exit through the anterior (ventral) root. The spinal nerve is formed by the joining of posterior (sensory) and anterior (motor) roots and is, consequently, a mixed nerve (Fig. 1-1B). In the case of mixed cranial nerves, the sensory and motor fibers are combined into a single root.
The visceromotor nervous system (also called visceral motor) is a functional division of the nervous system that has parts in both the CNS and the PNS (Fig. 1-1). It is made up of neurons that innervate smooth muscle, cardiac muscle, or glandular epithelium or combinations of these tissues. These individual visceral tissues, when combined, make up visceral organs such as the stomach. The visceromotor nervous system is also called the autonomic nervous system because it regulates motor responses outside the realm of conscious control.
Neurons
At the histologic level, the nervous system is composed of neurons and glial cells. As the basic structural and functional units of the nervous system, neurons are specialized to receive information, to transmit electrical impulses, and to influence other neurons or effector tissues. In many areas of the nervous system, neurons are structurally modified to serve particular functions. At this point, we consider the neuron only as a general concept (see Chapter 2).
A neuron consists of a cell body (perikaryon or soma) and the processes that emanate from the cell body (Fig. 1-2). Collectively, neuronal cell bodies constitute the gray matter of the CNS. Named and usually function-specific clusters of cell bodies in the CNS are called nuclei (singular, nucleus). Typically, dendrites are those processes that ramify in the vicinity of the cell body, whereas a single, longer process called the axon carries impulses to a more remote destination. The white matter of the CNS consists of bundles of axons that are wrapped in a sheath of insulating lipoprotein called myelin.
Figure 1-2. A representative neuron and synapse, a simple (monosynaptic) reflex, and a pathway.
In general, there is a direct relationship between (1) the diameter of the axon, (2) the thickness of the myelin sheath, (3) the distance between the nodes of the myelin sheath (nodes of Ranvier), and (4) the conduction velocity of the nerve fiber. Axons with a large diameter have thick myelin sheaths with longer internodal distances and therefore exhibit faster conduction velocities. Likewise, axons with a thin diameter that have thin myelin sheaths with shorter internodal distances have slower conduction velocities. The axon terminates at specialized structures called synapses or, if they innervate muscles, motor end plates (neuromuscular junctions), which function much like synapses.
The generalized synapse (Fig. 1-2) is the most common type seen in the CNS and is sometimes called an electrochemical synapse. It consists of a presynaptic element, which is part of an axon; a gap called the synaptic cleft; and the postsynaptic region of the innervated neuron or effector structure. Communication across this synapse is accomplished as follows. An electrical impulse (the action potential) causes the release of a neuroactive substance (a neurotransmitter, neuromodulator, or neuromediator) from the presynaptic element into the synaptic cleft. This substance is stored in synaptic vesicles in the presynaptic element and is released into the synaptic space by the fusion of these vesicles with the cell membrane (Fig. 1-2).
The neurotransmitter diffuses rapidly across the synaptic space and binds to receptor sites on the postsynaptic membrane. On the basis of the action of the neurotransmitter at receptor sites, the postsynaptic neuron may be excited (lead to generation of an action potential) or inhibited (prevent generation of an action potential). Neurotransmitter residues in the synaptic cleft are rapidly inactivated by other chemicals found in this space. In this brief example, we see that (1) the neuron is structurally specialized to receive and propagate electrical signals, (2) this propagation is accomplished by a combination of electrical and chemical events, and (3) the transmission of signals across the synapse is in one direction (unidirectional), that is, from the presynaptic neuron to the postsynaptic neuron. There are a number of neurologic disorders that represent a failure of neurotransmitter action at the synapse or at the receptors on the postsynaptic membrane.
Reflexes and Pathways
The function of the nervous system is based on the interactions between neurons. Figure 1-2 illustrates one of the simplest types of neuronal circuits, a reflex arc composed of only two neurons. This is called a monosynaptic reflex arc because only one synapse is involved. In this example, the peripheral end of a sensory fiber responds to a particular type of input. The resulting action potential is conducted by the sensory fiber into the spinal cord, where it influences a motor neuron. The axon of the motor neuron conducts a signal from the spinal cord to the appropriate skeletal muscle, which responds by contracting. This is an example of a muscle stretch reflex, which is actually one of the more commonly tested reflexes in clinical medicine. Reflexes are involuntary responses to a particular bit of sensory input. For example, the physician taps on the patellar tendon and the leg jerks; the patient does not think about it—the motor response just happens. The lack of a reflex (areflexia), an obviously weakened reflex (hyporeflexia), or an excessively active reflex (hyperreflexia) is usually indicative of a neurologic disorder.
By building on these summaries of the neuron and of the basic reflex arc, we shall briefly consider what neuronal elements constitute a pathway. If the patient bumps his or her knee and not only hits the patellar tendon but also damages the skin over the tendon, two things happen (Fig. 1-2). First, impulses from receptors in the tendon travel through a reflex arc that causes the leg to jerk (knee jerk, or patellar reflex). The synapse for this reflex arc is located in the lumbosacral spinal cord. Second, impulses from pain receptors in the damaged skin are transmitted in the lumbosacral cord to a second set of neurons that convey them via ascending axons to the forebrain. As can be seen in Figure 1-2, these axons cross the midline of the spinal cord and form an ascending tract on the contralateral side. In the forebrain, these signals are passed to a third group of neurons that distribute them to a region of the cerebral cortex specialized to interpret them as pain from the knee.
This three-neuron chain constitutes a pathway, a series of neurons designed to carry a specific type of information from one site to another (Fig. 1-2). Some pathways carry information to a level of conscious perception (we not only recognize pain but know that it is coming from the knee), and others convey information that does not reach the conscious level. It is common to refer to all the neurons comprising a pathway and conducting a specific type of information as a system. For example, the anterolateral system conducts pain and thermal information, the posterior column–medial lemniscus system conducts vibratory and position sense, and the corticospinal system conducts information from the cerebral cortex to the spinal cord.
REGIONS OF THE CENTRAL NERVOUS SYSTEM
Spinal Cord
The spinal cord is located inside the vertebral canal and is rostrally continuous with the medulla oblongata of the brain (Fig. 1-3). An essential link between the PNS and the brain, it conveys sensory information originating from the body wall, extremities, and gut and distributes motor impulses to these areas. Impulses enter and leave the spinal cord through the 31 pairs of spinal nerves (Fig. 1-1; see also Fig. 9-2). The spinal cord contains sensory fibers and motor neurons involved in reflex activity and ascending and descending pathways or tracts that link spinal centers with other parts of the CNS. Ascending pathways convey sensory information to higher centers, whereas descending pathways influence neurons in the spinal cord or brainstem.
Figure 1-3. The basic divisions of the central nervous system.
Medulla Oblongata
At the level of the foramen magnum, the spinal cord is continuous with the most caudal part of the brain, the medulla oblongata, commonly called the medulla (Fig. 1-3). The medulla consists of (1) neurons that perform functions associated with the medulla and (2) ascending (generally sensory) and descending (generally motor) tracts that pass through the medulla on their way from or to the spinal cord. Some of the neuronal cell bodies of the medulla are organized into nuclei associated with specific cranial nerves. The medulla contains the nuclei for the glossopharyngeal (cranial nerve IX), vagus (X), and hypoglossal (XII) nerves as well as portions of the nuclei for the trigeminal (V), vestibulocochlear (VIII), and spinal accessory (XI) nerves. It also contains important relay centers and nuclei that are essential to the regulation of respiration, heart rate, and various visceral functions.
Pons and Cerebellum
The pons and cerebellum originate embryologically from the same segment of the developing neural tube. However, in the adult, the pons forms part of the brainstem (the other parts being the midbrain and medulla) and the cerebellum is a suprasegmental structure because it is located posterior (dorsal) to the brainstem (Fig. 1-3).
Like the medulla, the pons contains many neuronal cell bodies, some of which are organized into cranial nerve nuclei, and it is traversed by ascending and descending tracts. The pons contains the nuclei of the abducens (VI) and facial (VII) nerves and portions of the nuclei for the trigeminal (V) and vestibulocochlear (VIII) nerves. The anterior (ventral) part of the pons contains large populations of neurons (pontine nuclei) that form a relay station between the cerebral cortex and cerebellum and descending motor fibers that travel to all spinal levels.
The cerebellum is connected with diverse regions of the CNS and is considered part of the motor system. It serves to coordinate the activity of individual muscle groups to produce smooth, purposeful, synergistic movements.
Midbrain
Rostrally, the pons is continuous with the midbrain (Fig. 1-3). This part of the brain is, quite literally, the link between the brainstem and the forebrain. Ascending or descending pathways to or from the forebrain must traverse the midbrain. The nuclei for the oculomotor (III) and trochlear (IV) cranial nerves as well as part of the trigeminal (V) complex are found in the midbrain. Other midbrain centers are concerned with visual and auditory reflex pathways, motor function, transmission of pain, and visceral functions.
Thalamus
The forebrain consists of the cerebral hemispheres, large groups of neurons that comprise the basal nuclei, and the thalamus (Fig. 1-3). We shall see later that the thalamus actually consists of several regions—for example, the hypothalamus, subthalamus, epithalamus, and dorsal thalamus. The thalamus is also commonly called the diencephalon, a term that reflects its embryologic origin.
[/not-level-membership-for-basic-science-category]
