[level-membership-for-opthalmology-category]
Chapter 17 Ocular Laboratory Applications
Introduction
Utilization of high-frequency ultrasonography, also referred to as ultrasound biomicroscopy or ultrasound backscatter microscopy, to visualize microscopic scale structures began in the 1930s with the advent of acoustic microscopes and laser scanning microscopes.1–3 These instruments were designed to offer “acoustic” contrast in excised, thin tissue specimens, without the necessity for time-consuming cross-sectioning and staining procedures necessary in traditional histopathological examination. While these microscopes were not widely accepted as alternatives to optical microscopy, the use of high frequency, pulsed transducers for in vivo longitudinal, high resolution visualization of tissue began to emerge in the 1980s (Chapters 4 and 6).4,5 Providing greater depth of view than optical systems, these high frequency probes were initially utilized in clinical applications for ophthalmology and dermatology. Using a 100 MHz probe, Pavlin et al,6 were able to acquire images of Schlemm’s canal, cornea, iris, ciliary muscles, and retina in intact eye cross-sections at axial depths approaching 4 mm and with a lateral resolution of 20 µm. Similarly, 20–30 MHz probes have been utilized to accurately assess extent and thickness of skin melanomas and basal cell carcinomas in large patient cohorts.7,8
Instrumentation
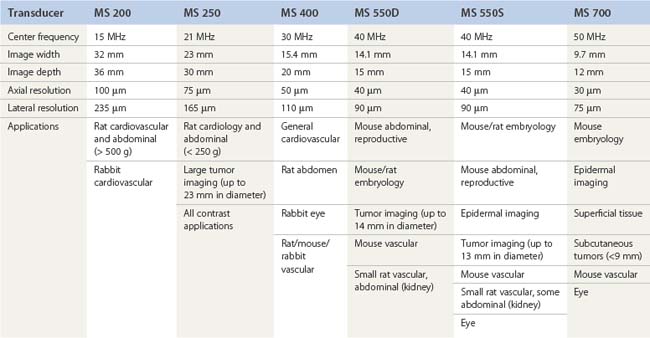
A pioneer in the development of the high frequency ultrasound transducers and ultrasound biomicroscopy, Dr. Stuart Foster founded VisualSonics in 1999 and developed the first commercial preclinical ultrasound. The most recent version of this system, the Vevo 2100, utilizes a 256-element linear array transducer that offers dynamic focusing, Doppler steering, acquisition rates of 300–400 frames per second, and axial resolutions approaching 30 µm (Figure 17.1A). Depending upon the application and size of the animal model utilized (i.e., zebrafish to rabbits), a user can select one of six transducers that range in frequency from 15 to 50 MHz (Table 17.1). Each transducer offers three adjustable focal depths and can acquire two modes simultaneously.
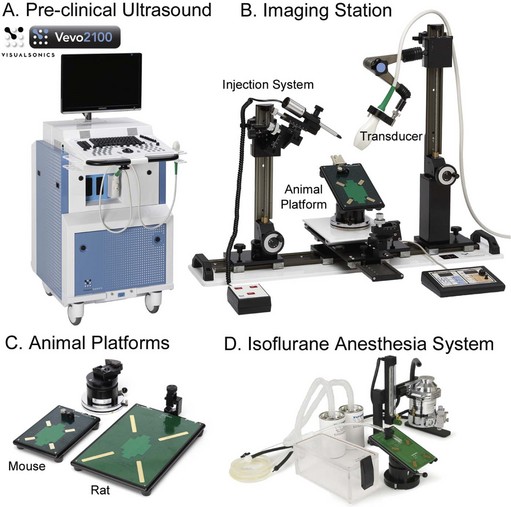
For imaging of larger organs or anatomical regions, transducers may be hand held; however, for applications that require strict transducer motion control such as image-guided injection, high-resolution imaging of small structures, or temporal imaging, transducers may be mounted onto the bench-top Vevo imaging station (Figure 17.1B). This “integrated rail system” provides a mount for free rotation and fixation of the transducer, an animal platform that sits above a ball-joint for precise angling, and a set of rails for X–Y positioning of this platform and Z-axis movement of the transducer mount. Animal platforms (dedicated rat or mouse) include imprinted sensors that monitor respiration, ECG, and heart rate, each of which are captured in real time and can be displayed/exported with every image series acquired (Figure 17.1C). Platforms can be heated to a user-defined temperature and a rectal probe is available to monitor animal temperature (particularly important for denuded mice prone to hypothermia). A nose-cone is attached to each platform for continuous flow of isoflurane supplied by an external anesthesia system (Figure 17.1D). For real-time, image-guided injection/extraction of drugs, contrast agents, genetic material, cells, and retroviruses an optional injection mount may be added to the Vevo imaging system. This injection mount includes a separate set of rails for positioning and can accommodate any number of syringes and needles.
Due to the rapid heart-rate of small animals, particularly under anesthesia, cardiac and respiratory motion can significantly affect image quality and accuracy of subsequent measurements. To compensate, the respiration/ECG signals acquired from the animal platform described above, may be utilized to gate/trigger image acquisition. This provides users with the ability to make measurements and attribute phenomena to specific respiratory and cardiac phases (Figure 17.2).
Imaging modes
Taking advantage of the increased spatial resolution provided by the high frequency transducers, two-dimensional (2D) scans may be acquired over a predefined range and rendered into a three-dimensional (3D) volume for visualization, segmentation, and volumetric analysis (Figure 17.3A). Since such acquisition requires motion precision that is not possible with the rails on the imaging station, a motorized transducer mount is necessary. This motor allows a minimum step size of ~32 µm, up to a 500 slice acquisition, and maximum scan range of 40 mm. 3D imaging is possible in B-, Power Doppler, and contrast modes and may be integrated with ECG and respiration gating to minimize motion artifacts (Chapter 5).
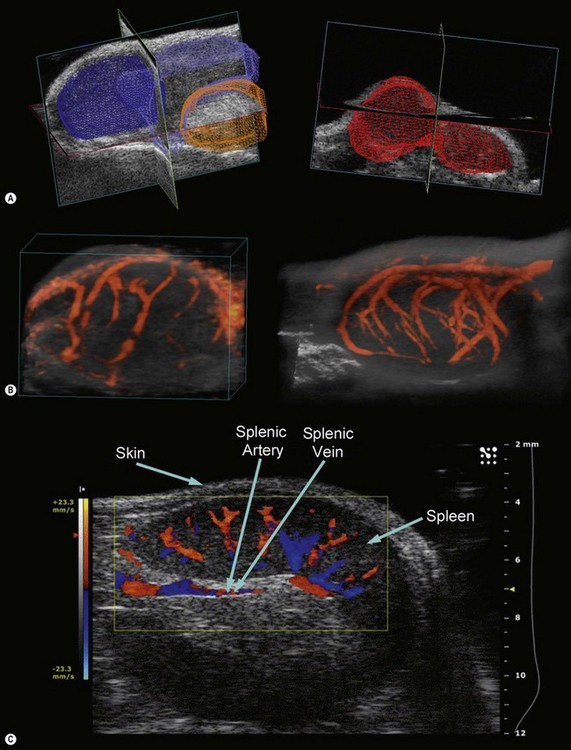
Power Doppler mode on the Vevo systems may be employed for a visual and semi-quantitative representation of blood flow and vascular density (percent vascularity). Since color intensity is assigned according to blood flow energy in this mode, power Doppler is better suited for slow blood flow detection (regions where saturation of the intensity scale is absent). When simultaneously acquired in 3D with B-Mode data, volumetric reconstructions of power Doppler data can be particularly useful in non-invasive, temporal analysis of vasculature changes in tumors and evaluation of the effectiveness of various therapeutic approaches (Figure 17.3B).
On the Vevo systems, pulsed-wave Doppler mode involves the transmission of a series of pulses for the detection of motion. Resulting Doppler shifts are processed and visualized in a spectral display. This mode can be utilized for studies requiring quantitative characterization of blood flow direction, velocity, or presence of turbulence within a specified vessel. To enable adequate discrimination of flow within a particular region of interest, sampling rates and sweep speeds may be changed to adjust magnitude and range of velocity scales displayed (1–2 kHz to 125 kHz sampling rates; velocity from a few mm/s to ~6 m/s; sweep speeds of 0.25 s at 4000 Hz to 5.1 s at 200 Hz). This mode can be applied to a number of animal models in which blood flow velocity is an indication of a specific pathology (i.e., renal blood flow in diabetes). Since pulsed-wave Doppler can determine directionality of blood flow away from and towards the transducer array, a visual representation of blood flow velocity (intensity) and directionality (red and blue hues) is possible in color Doppler mode (Figure 17.3C). This mode can enable rapid visual assessment of turbulent flow.
Contrast imaging
Contrast agents used in high frequency based ultrasonography systems generally consist of air or gas-filled micron-sized microbubbles surrounded by a lipid shell. These agents may be easily introduced intravascularly without generating a host response (Chapter 5). Contrast imaging can be performed in either linear or non-linear fashion in the Vevo system. The linear mode of acquisition involves B-mode imaging of tissue perfused with contrast agents followed by application of a reference subtraction algorithm to enable segmentation of contrast from tissue. Non-linear acquisition and analysis provides a more sensitive method for delineation of contrast and tissue. This technique exploits the respective non-linear and linear responses of contrast agent and tissue to applied ultrasound energy by transmitting multiple pulses with modulated amplitudes that suppress the linear tissue response and enhance the detection of microbubbles (Figure 17.4A). Microbubble contrast agents can be non-targeted for general imaging and analysis of tumor volume or organ perfusion, or tagged with specific ligands (streptavidin–biotin system) to quantify expression of endothelial cell surface receptors. Currently available targeted contrast agents (MicroMarker™ Contrast Agents) include microbubbles conjugated to ligands that target receptors involved in tumor angiogenesis and inflammation such as vascular endothelial growth factor receptor 2 (VEGFR2), p-selectin, integrins, vascular cell adhesion molecule, and platelet cellular adhesion molecule (Figure 17.4B).
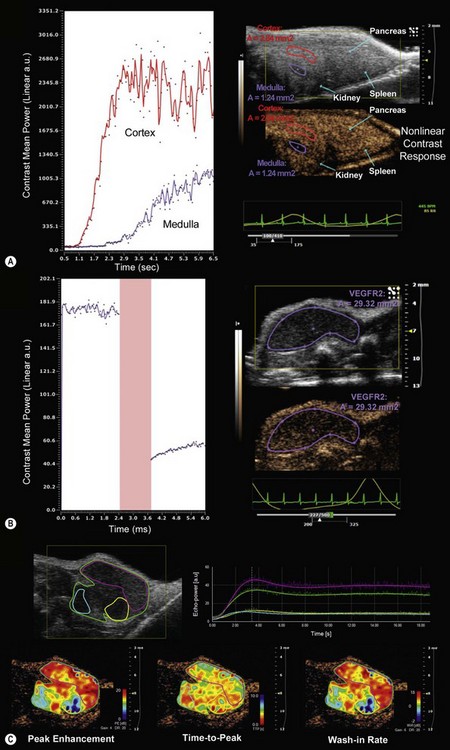
VevoCQ™ software provides advanced analysis of perfusion kinetics for images acquired in non-linear contrast mode. Analysis tools include uptake kinetics and late phase targeted enhancement with advanced curve fitting algorithms for extraction of numerous perfusion parameters. For bolus perfusion models, peak enhancement, rise time, time to peak, wash-in rate, and perfusion index may be assessed, while for destruction-replenishment models (burst of ultrasound energy to destroy microbubbles in a particular region and subsequent imaging to follow reperfusion) relative blood volume, mean transit time and relative blood flow may be determined. Each of these parameters may be analyzed in specific, user-defined regions of interest and displayed in pseudo-colored parametric maps (Figure 17.4C).
Microbubble contrast agents may also be used to deliver drugs or genes to cells. In Vevo’s SoniGene™ system microbubbles and drugs or genes are added into a single suspension and administered via image-guided injection to a specific region of interest. Subsequently, a low frequency (1–3 MHz), high-energy pulse is transmitted to this region to induce microbubble cavitation of cell membranes (sonoporation) for intracellular delivery of the interspersed drugs/genes. This ultrasound-based method of delivery has been proven to be both effective and efficient with regard to cell expression and reagents required.9
Ophthalmic applications
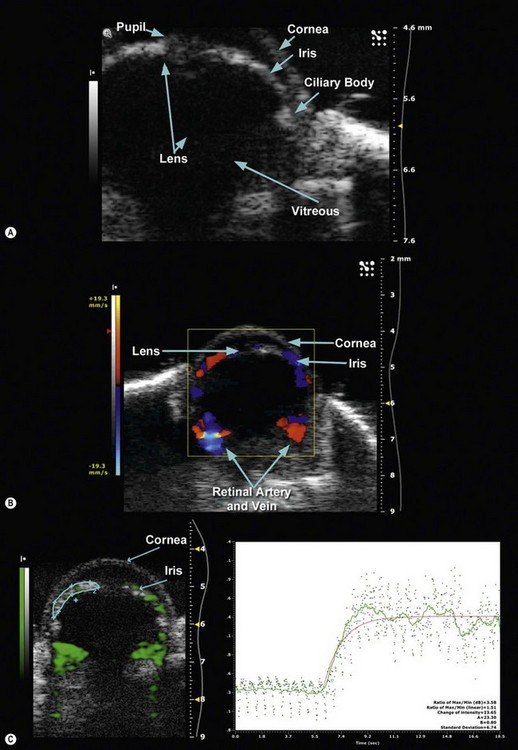
Using a 50 MHz transducer, the Vevo preclinical ultrasound can provide an axial resolution of 30 µm, lateral resolution of 75 µm, and maximum imaging depth of 12 mm. These specifications are more than adequate to provide both 2D and 3D visualization of ophthalmic structures such as the pupil, lens, cornea, iris, ciliary body, and vitreous in small animal models such as mice and rats (Figure 17.5A). With such spatial resolutions, in-vivo, longitudinal visualization and morphological quantification of tumors and their response to therapeutic agents can be performed. Employing pulsed-wave, color and power Doppler modes, it is also possible to determine velocity profiles of vessels 100 µm or greater in diameter (i.e., retinal vein and artery) (Figure 17.5B). For smaller diameter vessels non-targeted contrast agents are necessary. Additionally, tagged contrast agents such as microbubbles conjugated with VEGFR2 ligands (Figure 17.5C) may be utilized to visualize and quantify presence of angiogenesis in retinoblastomas.
The utility of animal models for orthotopic ophthalmic tumor progression was recently demonstrated by Braun et al.10 In their study, primary human choroidal melanoma spheroids were implanted in the suprachoroidal space of 26 rats and followed longitudinally using high frequency ultrasonography (35 MHz transducer). Since their ultrasound system (MHF-1, E-Technologies) did not include an option for 3D imaging, B-mode images were captured every 250 µm, and tumor area was manually analyzed for every serial image. These serial slice areas were then integrated to determine tumor volume (9.7 ± 5.1% intraobserver variation and 12.1 ± 6.8% intrascan variation for three imaging series of the same tumor). Imaging 12 rats every 4–5 days for 2 weeks, the group discovered exponential growth for six rats at day 14 and average tumor volumes of 1.19, 2.28, and 5.45 mm3 for days 5, 9, and 14 respectively. Final endpoint histological analysis of tumor volume showed a 0.923 correlation to ultrasound measured volumes, thus validating the use of high-frequency ultrasound biomicroscopy to non-invasively monitor progression of human ophthalmic tumor xenografts in small animals.
Brown et al11 utilized high-frequency ultrasound biomicroscopy to study hyaloid vascular regression during neonatal mouse eye development. In this study, B-mode and Doppler ultrasound imaging (40 MHz) was performed everyday from birth (P0) to postnatal day 16 (P16) in the eyes of CD-1 mice. Doppler flow measurements were made specifically in the hyaloid artery (HA), vasa hyaloidea propria (VHP), tunica vasculosa lentis (TVL), and retina. B-mode images showed significant reduction in branching in the VHP and shortening of the HA from P1–P16 with hyaloid vasculature disappearing after P12. Such phenomena were confirmed in concurrently acquired 3D (post-sacrifice, contrast enhanced) micro-CT volumes of the hyaloid vasculature. Due to the 3D structure of hyaloid vasculature, histological cross-sections proved to be ineffective in demonstrating such changes. In addition to structural information provided in B-mode images, ultrasound imaging in Doppler mode was able to provide evidence of blood flow changes in specific regions during ocular development. Significant increases in peak blood flow velocity were measured in HA from P3 to P4 with significant decreases between P6 to P7 and P11 to P12 (no flow past P12). VHP blood flow velocity, however, trended differently with significant decreases observed from P1 to P2 and P8 to P9. Finally, lens and retinal peak blood flow velocities exhibited inverse trends with retinal blood flow velocity increasing dramatically from P3 to P4. This study demonstrates the utility of longitudinal high-frequency ultrasound imaging to non-invasively study ocular blood flow in small animal models and potentially elucidate mechanisms involved in diabetic retinopathy and glaucoma, and in particular, diseases that result from failed regression of the hyaloid vascular system such as persistent hyperplastic primary vitreous.
1 Foster FS, Pavlin CJ, Harasiewicz KA, et al. Advances in ultrasound biomicroscopy. Ultrasound Med Biol. 2000;26:1-27.
2 Sokolov SJ. Ultrasonic oscillations and their applications. Tech Phys USSR. 1935;2:522-534.
3 Kessler LW, Korpel A, Palermo PR. Simultaneous acoustic and optical microscopy. Nature. 1972;239:111-112.
4 Sherar MD, Noss MB, Foster FS. Ultrasound backscatter microscopy images the internal structure of living tumour spheroids. Nature. 1987;330:493-495.
5 Sherar MD, Starkoski BG, Foster FS. A 100 MHz B-scan ultrasound backscatter microscope. Ultrasonic Imaging. 1989;11:95-105.
6 Pavlin CJ, Sherar MD, Foster FS. Subsurface imaging of the eye by ultrasound biomicroscopy. Ophthalmology. 1990;97:244-250.
7 Hoffmann K, el Gammal S, Matthes U, et al. Digital 20 MHz sonography of the skin in preoperative diagnosis. Z Hautkr. 1989;64:851-858.
8 Hayashi K, Koga H, Uhara H, et al. High-frequency 30-MHz sonography in preoperative assessment of tumor thickness of primary melanoma: usefulness in determination of surgical margin and indication for sentinel lymph node biopsy. Int J Clin Oncol. 2009;14:426-430.
9 Huang SL. Liposomes in ultrasonic drug and gene delivery. Adv Drug Deliv Rev. 2008;60:1167-1176.
10 Braun RD, Vistisen KS. Measurement of human choroidal melanoma xenograft volume in rats using high-frequency ultrasound. IOVS. 2008;49:16-22.
11 Brown AS, Leamen L, Cucevic V, et al. Quantitation of hemodynamic function during developmental vascular regression in the mouse eye. IOVS. 2005;46:2231-2237.
[/level-membership-for-opthalmology-category][not-level-membership-for-opthalmology-category]
Chapter 17 Ocular Laboratory Applications
Introduction
Utilization of high-frequency ultrasonography, also referred to as ultrasound biomicroscopy or ultrasound backscatter microscopy, to visualize microscopic scale structures began in the 1930s with the advent of acoustic microscopes and laser scanning microscopes.1–3 These instruments were designed to offer “acoustic” contrast in excised, thin tissue specimens, without the necessity for time-consuming cross-sectioning and staining procedures necessary in traditional histopathological examination. While these microscopes were not widely accepted as alternatives to optical microscopy, the use of high frequency, pulsed transducers for in vivo longitudinal, high resolution visualization of tissue began to emerge in the 1980s (Chapters 4 and 6).4,5 Providing greater depth of view than optical systems, these high frequency probes were initially utilized in clinical applications for ophthalmology and dermatology. Using a 100 MHz probe, Pavlin et al,6 were able to acquire images of Schlemm’s canal, cornea, iris, ciliary muscles, and retina in intact eye cross-sections at axial depths approaching 4 mm and with a lateral resolution of 20 µm. Similarly, 20–30 MHz probes have been utilized to accurately assess extent and thickness of skin melanomas and basal cell carcinomas in large patient cohorts.7,8
Instrumentation
A pioneer in the development of the high frequency ultrasound transducers and ultrasound biomicroscopy, Dr. Stuart Foster founded VisualSonics in 1999 and developed the first commercial preclinical ultrasound. The most recent version of this system, the Vevo 2100, utilizes a 256-element linear array transducer that offers dynamic focusing, Doppler steering, acquisition rates of 300–400 frames per second, and axial resolutions approaching 30 µm (Figure 17.1A). Depending upon the application and size of the animal model utilized (i.e., zebrafish to rabbits), a user can select one of six transducers that range in frequency from 15 to 50 MHz (Table 17.1). Each transducer offers three adjustable focal depths and can acquire two modes simultaneously.
For imaging of larger organs or anatomical regions, transducers may be hand held; however, for applications that require strict transducer motion control such as image-guided injection, high-resolution imaging of small structures, or temporal imaging, transducers may be mounted onto the bench-top Vevo imaging station (Figure 17.1B). This “integrated rail system” provides a mount for free rotation and fixation of the transducer, an animal platform that sits above a ball-joint for precise angling, and a set of rails for X–Y positioning of this platform and Z-axis movement of the transducer mount. Animal platforms (dedicated rat or mouse) include imprinted sensors that monitor respiration, ECG, and heart rate, each of which are captured in real time and can be displayed/exported with every image series acquired (Figure 17.1C). Platforms can be heated to a user-defined temperature and a rectal probe is available to monitor animal temperature (particularly important for denuded mice prone to hypothermia). A nose-cone is attached to each platform for continuous flow of isoflurane supplied by an external anesthesia system (Figure 17.1D). For real-time, image-guided injection/extraction of drugs, contrast agents, genetic material, cells, and retroviruses an optional injection mount may be added to the Vevo imaging system. This injection mount includes a separate set of rails for positioning and can accommodate any number of syringes and needles.
Due to the rapid heart-rate of small animals, particularly under anesthesia, cardiac and respiratory motion can significantly affect image quality and accuracy of subsequent measurements. To compensate, the respiration/ECG signals acquired from the animal platform described above, may be utilized to gate/trigger image acquisition. This provides users with the ability to make measurements and attribute phenomena to specific respiratory and cardiac phases (Figure 17.2).
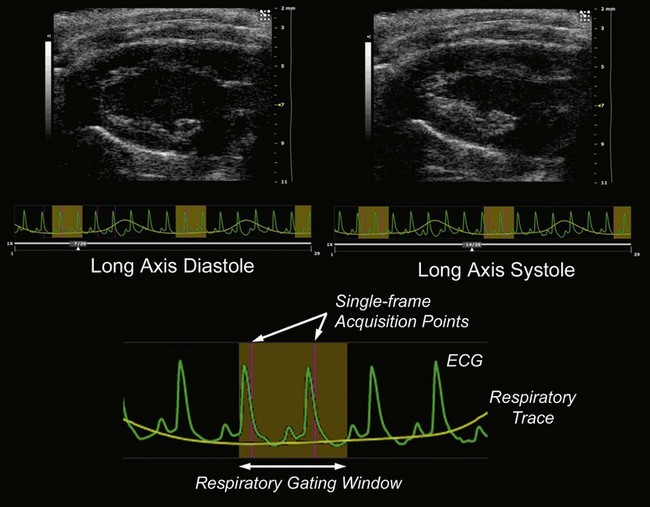
Figure 17.2 ECG triggering/respiratory gating.
Reproduced with permission from VisualSonics Inc. 3080 Yonge Street, Suite 6100, Box 66, Toronto, Ontario, Canada M4N 3N1.
[/not-level-membership-for-opthalmology-category]
