OCT Interpretation
Qualitative Interpretation
When performing qualitative interpretation, it is important to be aware of the following issues:
▶ Registration: future line scans must be ‘registered’ to past scans. In other words, the examiner must be certain that the precise anatomic area of interest is scanned similarly in future tests. All SD-OCT machines have the capability of registering future line scans to past scans.
▶ Sampling error: if only one or several line scans are examined, the true pathology may be missed. It is important when doing qualitative interpretation that multiple line scans through the macula are examined.
▶ Subjective evaluation: by its nature, the lack of accurate quantitative numbers mean that line scan interpretation will be individualized. In addition, it is hard to gauge the effects of pathology that is improving in one area of the macula but getting worse in another.
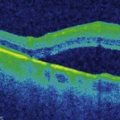
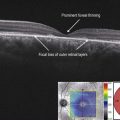
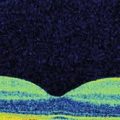
Zones of line scans can be qualitatively described as hyper-reflective or hyporeflective, and demonstrate ‘shadowing’ or ‘reverse shadowing.’ Hyper-reflective areas reflect more light than normal for a given region. On the grey-scale image, they appear whiter than the surrounding areas. Examples include epiretinal membranes and hard exudates. Hyporeflective areas reflect less light than the surrounding areas. Areas with a higher fluid content, e.g. intraretinal cysts, are usually hyporeflective. Shadowing occurs when there is increased absorption of light compared to the surrounding tissue. This causes optical shadowing and decreased visualization of the outer tissues. Vitreous debris, larger retinal vessels, hard exudates and highly pigmented areas cause shadowing. Reverse shadowing occurs when there is loss/atrophy of pigmented tissue that allows excessive light to be transmitted through to the outer layers. The retinal pigment epithelium (RPE) is a major source of light absorption on OCT scanning, so atrophy of the RPE can cause reverse shadowing.