[level-membership-for-basic-science-category]52
Nutritional assessment
Malnutrition to the layman usually means starvation, but the term has a much wider meaning encompassing both the inadequacy of any nutrient in the diet as well as excess food intake. The pathogenesis of malnutrition is shown in Figure 52.1.
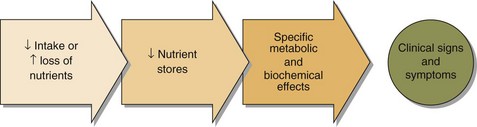
Malnutrition related to surgery or following severe injury occurs because of the extensive metabolic changes that accompany these events: the ‘metabolic response to injury’ (pp. 110–111).
The assessment of a patient suspected of suffering from malnutrition is based on:


Biochemistry
 Protein. Serum albumin concentration is a widely used but insensitive indicator of protein nutritional status. It is affected by many factors other than nutrition, e.g. hepatic and renal diseases and the hydration of the patient. Serum albumin concentration rapidly falls as part of the metabolic response to injury, and the decrease may be mistakenly attributed to malnutrition.


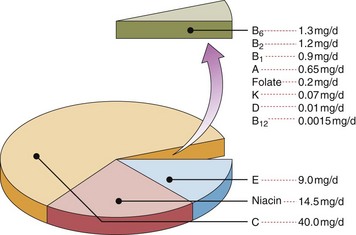
 Vitamins. These organic compounds are vital for normal metabolism. Usually they are classified by their solubility; they are listed in Table 52.1 and their average adult daily requirements shown in Figure 52.2. Some assays are available to measure the blood levels of vitamins directly, but often functional assays that utilize the fact that many vitamins are enzyme cofactors are used. These latter assays may help identify gross abnormalities. However, to detect subtle deficiencies and the increasing problem of excess intake, quantitative measurements are required.
Table 52.1
| Vitamins | Deficiency state | Lab assessment |
| Water soluble | ||
| C (Ascorbate) | Scurvy | Plasma or leucocyte levels |
| B1 (Thiamin) | Beri-beri | Red cell levels |
| B2 (Riboflavin) | Rarely single deficiency | Red cell levels |
| B6 (Pyridoxine) | Dermatitis/Anaemia | Red cell levels |
| B12 (Cobalamin) | Pernicious anaemia | Serum B12, full blood count |
| Folate | Megaloblastic anaemia | Serum folate, RBC folate, full blood count |
| Niacin | Pellagra | Urinary niacin metabolites (not commonly available) |
| Fat soluble | ||
| A (Retinol) | Blindness | Serum vitamin A |
| D (Cholecalciferol) | Osteomalacia/rickets | Serum 25-hydroxycholecalciferol |
| E (Tocopherol) | Anaemia/neuropathy | Serum vitamin E |
| K (Phytomenadione) | Defective clotting | Prothrombin time |

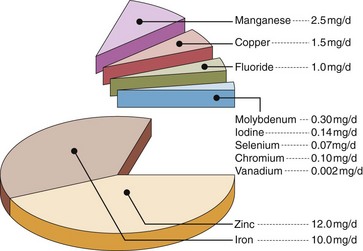
 Trace elements. Inorganic elements present in the body in quantities less than 5 g are often found in complexes with proteins. The essential trace elements are shown in Figure 52.3.
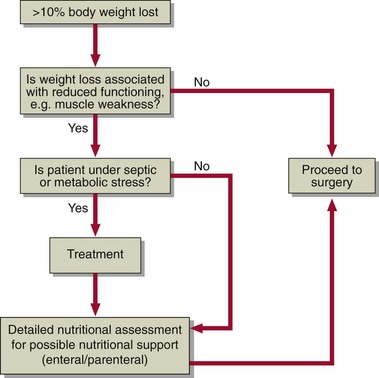
Preoperative nutritional assessment
Nutritional assessment is not only necessary following surgical procedures. Patients need to be in good nutritional condition before an operation and the assessment should be done well in advance to allow build-up of reserves before surgery (Fig 52.4).
 Clinical note


[/level-membership-for-basic-science-category][not-level-membership-for-basic-science-category]52
Nutritional assessment
Malnutrition to the layman usually means starvation, but the term has a much wider meaning encompassing both the inadequacy of any nutrient in the diet as well as excess food intake. The pathogenesis of malnutrition is shown in Figure 52.1.
Malnutrition related to surgery or following severe injury occurs because of the extensive metabolic changes that accompany these events: the ‘metabolic response to injury’ (pp. 110–111).
The assessment of a patient suspected of suffering from malnutrition is based on:
