[level-membership-for-pediatrics-category]
Chapter 43 Nutrition, Food Security, and Health
Malnutrition as the Intersection of Food Security and Health Security
Undernutrition is usually an outcome of 3 factors: household level food security, access to health and sanitation services, and child caring practices. A mother with few economic resources who knows how to care for her children and is enabled to do so can often use available food and health services to produce well-nourished children. If food resources and health services are available in a community, but the mother does not access immunizations or does not know how or when to properly add complementary foods to her child’s diet, that child might become malnourished (Table 43-1).
Table 43-1 THREE MYTHS ABOUT NUTRITION
From World Bank: Repositioning nutrition as central to development, 2006 (PDF). http://web.worldbank.org/WBSITE/EXTERNAL/TOPICS/EXTHEALTHNUTRITIONANDPOPULATION/EXTNUTRITION/0,contentMDK:20787550~menuPK:282580~pagePK:64020865~piPK:149114~theSitePK:282575,00.html. Accessed May 23, 2010.
Undernutrition
The greatest risk of undernutrition occurs during pregnancy and in the first 2 years of life (Fig. 43-1); the effects of this early damage on health, brain development, intelligence, educability, and productivity are potentially irreversible (Table 43-2). Governments with limited resources are therefore best advised to focus publicly funded actions on this critical window of opportunity, between preconception and 24 mo of age. Folate deficiency also increases the risk of birth defects; this particular window of opportunity is before conception, as it is with iodine. Iron deficiency anemia is another dimension of undernutrition that has measurable risks that extend outside of the early years of life, with particular risks to the health of a mother as well as for the birth weight of her child. Anemia can also reduce physical and cognitive function and economic productivity of adults of both sexes.
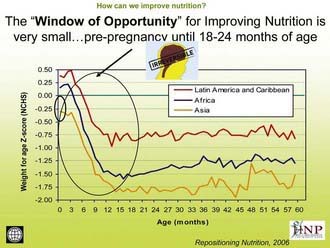
Figure 43-1 The window of opportunity for improving nutrition is very small: prepregnancy until 18-24 mo of age.
(From The World Bank’s Human Development Network: Better nutrition = less poverty: repositioning nutrition as central to development: a strategy for large scale action, 2006 [PDF]. http://siteresources.worldbank.org/NUTRITION/Resources/281846-1114108837888/RepositioningNutritionLaunchJan30Final.pdf. Accessed May 23, 2010.)
Table 43-2 WHY MALNUTRITION PERSISTS IN MANY FOOD-SECURE HOUSEHOLDS
From World Bank: Repositioning nutrition as central to development, 2006 (PDF). http://web.worldbank.org/WBSITE/EXTERNAL/TOPICS/EXTHEALTHNUTRITIONANDPOPULATION/EXTNUTRITION/0,contentMDK:20787550~menuPK:282580~pagePK:64020865~piPK:149114~theSitePK:282575,00.html. Accessed May 23, 2010.
Measurement of Undernutrition
The term malnutrition encompasses both ends of the nutrition spectrum, from undernutrition (underweight, stunting, wasting, and micronutrient deficiencies) to overweight. Many poor nutritional outcomes begin in utero and are manifest as low birthweight (LBW). Prematurity and intrauterine growth restriction (IUGR) are the two main causes of LBW, with prematurity relatively more important in developed countries and IUGR relatively more important in developing countries (Chapter 90).
In preschool- and school-aged children, nutritional status is often assessed in terms of anthropometry. International references have been established that allow normalization of anthropometric measures in terms of z scores defined as the child’s height (weight) minus the median height (weight) for the age and sex of the child divided by the relevant standard deviation (Table 43-3). The World Health Organization (WHO) recently revised the child growth references based on data from healthy children in 5 countries. Comparisons of malnutrition rates across countries are meaningful, and these growth references are applicable to all children across the globe.
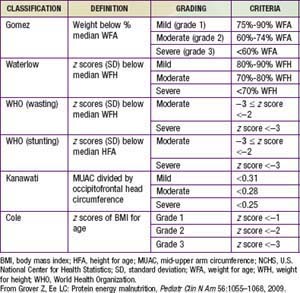
Height for age is useful for assessing the nutritional status of populations, because this measure of skeletal growth reflects the cumulative impact of events affecting nutritional status that result in stunting and is also referred to as chronic malnutrition. This measure contrasts with weight for height, or wasting, which is a measure of acute malnutrition. Weight for age is an additional commonly used measurement of nutritional status. Although it has less clinical significance because it combines stature with current health conditions, it has the advantage of being somewhat easier to measure: Current weighing scales allow a child to be weighed in a caregiver’s arms, but weight for height requires 2 different instruments for measurement. Height for age is particularly difficult to measure for the most vulnerable children <2 yr of age for whom recumbent length is the preferred indicator for height. In emergencies and in some field settings, mid-upper arm circumference (MUAC) is often used for screening in lieu of weight for height (see Table 43-3).
Another dimension of malnutrition is micronutrient deficiencies. The micronutrients of particular public-health significance are iodine, vitamin A, iron, folic acid, and zinc. Iodine deficiency and its sequelae (goiter, hypothyroidism, and developmental disabilities including severe mental retardation) are assessed by clinical inspection of enlarged thyroids (goiter) or by iodine concentrations in urine (µg/L). Even mild forms of iodine deficiency during pregnancy have been implicated in poor mental and physical development among children as well as fetal losses. The public-health benchmark for eliminating iodine deficiency in a population is <20% of the population with urinary iodine levels <50 µg/L (Chapter 51).
Vitamin A deficiency is caused by low intake of retinol or its precursor, beta-carotene. Absorption can be inhibited by a lack of fats in the diet or by parasite infestations. Clinical deficiency is estimated by combining night blindness and eye changes—principally Bitot spots and total xerophthalmia prevalence. Subclinical deficiency is assessed as prevalence of serum retinal concentrations <0.70 µmol/L (Chapter 45). The greatest public-health significance of vitamin A deficiency is its association with a higher mortality among young children. Prophylactic supplementation of vitamin A among deficient populations for children <5 yr of age can reduce child mortality by as much as 23%.
Consequences of Undernutrition
Key Interventions
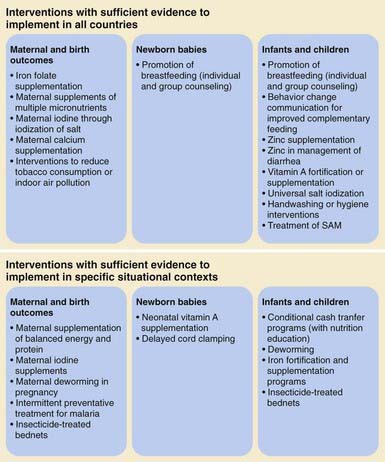
There is substantial consensus regarding which interventions work to address child undernutrition based on accumulated field evidence (Fig. 43-2). Many of these interventions lie within the responsibility of the health sector, albeit investments in other sectors may be necessary to sustain the benefits from the health sector interventions. Key interventions that have been proved to be cost effective in reducing infant and child mortality, improving underweight rates, and reversing micronutrient deficiencies include:
Severe Acute Malnutrition (Protein-Energy Malnutrition)
Clinical Manifestations of Severe Protein Calorie Malnutrition
Nonedematous malnutrition (marasmus) is characterized by failure to gain weight and irritability, followed by weight loss and listlessness until emaciation results. The skin loses turgor and becomes wrinkled and loose as subcutaneous fat disappears. Loss of fat from the sucking pads of the cheeks often occurs late in the course of the disease; thus, the infant’s face may retain a relatively normal appearance compared with the rest of the body, but this, too, eventually becomes shrunken and wizened. Infants are often constipated, but they can have starvation diarrhea, with frequent small stools containing mucus. The abdomen may be distended or flat, with the intestinal pattern readily visible. There is muscle atrophy and resultant hypotonia. As the condition progresses, the temperature usually becomes subnormal and the pulse slows (Table 43-4).
| SITE | SIGNS |
|---|---|
| Face | Moon face (kwashiorkor), simian facies (marasmus) |
| Eye | Dry eyes, pale conjunctiva, Bitot spots (vitamin A), periorbital edema |
| Mouth | Angular stomatitis, cheilitis, glossitis, spongy bleeding gums (vitamin C), parotid enlargement |
| Teeth | Enamel mottling, delayed eruption |
| Hair | Dull, sparse, brittle hair, hypopigmentation, flag sign (alternating bands of light and normal color), broomstick eyelashes, alopecia |
| Skin | Loose and wrinkled (marasmus), shiny and edematous (kwashiorkor), dry, follicular hyperkeratosis, patchy hyper- and hypopigmentation (crazy paving or flaky paint dermatoses), erosions, poor wound healing |
| Nails | Koilonychia, thin and soft nail plates, fissures or ridges |
| Musculature | Muscle wasting, particularly buttocks and thighs; Chvostek or Trousseau signs (hypocalcemia) |
| Skeletal | Deformities, usually as a result of calcium, vitamin D, or vitamin C deficiencies |
| Abdomen | Distended: hepatomegaly with fatty liver; ascites may be present |
| Cardiovascular | Bradycardia, hypotension, reduced cardiac output, small vessel vasculopathy |
| Neurologic | Global developmental delay, loss of knee and ankle reflexes, impaired memory |
| Hematologic | Pallor, petechiae, bleeding diathesis |
| Behavior | Lethargic, apathetic, irritable on handling |
From Grover Z, Ee LC: Protein energy malnutrition, Pediatr Clin N Am 56:1055–1068, 2009.
Edematous malnutrition (kwashiorkor) can occur initially as vague manifestations that include lethargy, apathy, and/or irritability. When kwashiorkor is advanced, there is lack of growth, lack of stamina, loss of muscle tissue, increased susceptibility to infections, vomiting, diarrhea, anorexia, flabby subcutaneous tissues, and edema. The edema usually develops early and can mask the failure to gain weight. It is often present in internal organs before it is recognized in the face and limbs. Liver enlargement can occur early or late in the course of disease. Dermatitis is common, with darkening of the skin in irritated areas, but in contrast to pellagra (Chapter 46) not in areas exposed to sunlight. Depigmentation can occur after desquamation in these areas, or it may be generalized (Figs. 43-3, 43-4, 43-5). The hair is sparse and thin, and in dark-haired children, it can become streaky red or gray. Eventually, there is stupor, coma, and death (see Table 43-4).
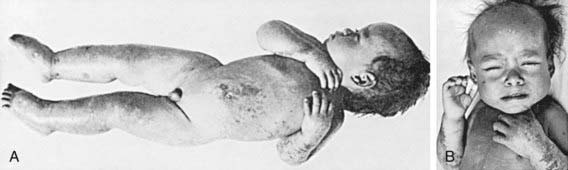
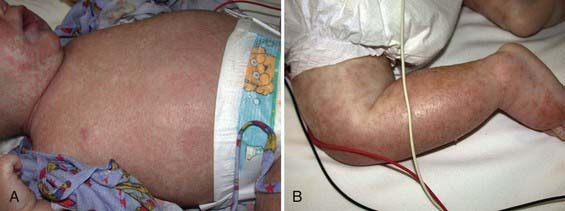

Figure 43-5 A 14 mo old girl with a “flaky paint” dermatitis.
(From Katz KA, Mahlberg MH, Honig PJ, et al: Rice nightmare: kwashiorkor in 2 Philadelphia-area infants fed Rice Dream beverage, J Am Acad Dermatol 52[5 Suppl 1]:S69–S72, 2005.)
Noma is a chronic necrotizing ulceration of the gingiva and the cheek (Fig. 43-6). It is associated with malnutrition and is often preceded by a debilitating illness (measles, malaria, tuberculosis, diarrhea, ulcerative gingivitis) in a nutritionally compromised host. Noma manifests with fever, malodorous breath, anemia, leukocytosis, and signs of malnutrition. Untreated, it produces sever disfiguration. Polymicrobial infection with Fusobacterium necrophorum and Prevotella intermedia may be inciting agents.

Treatment
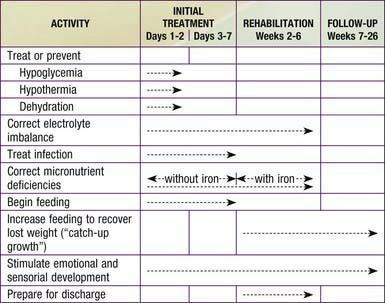
The usual approach to the treatment of severe acute malnutrition includes 3 phases (Table 43-5 and Fig. 43-7). The initial phase (1-7 days) is a stabilization phase. During this phase, dehydration, if present, is corrected and antibiotic therapy is initiated to control bacterial or parasitic infection. Because of the difficulty of estimating hydration, oral rehydration therapy is preferred (Chapters 55 and 332). If intravenous therapy is necessary, estimates of dehydration should be reconsidered frequently, particularly during the first 24 hr of therapy. Oral feedings are also started with specialized high-calorie formula (see Fig. 43-7 and Table 43-6), proposed by the World Health Organization, that can be made with simple ingredients. The initial phase of oral treatment is with the F75 diet (75 kcal or 315 kJ/100 mL). The rehabilitation diet is with the F100 diet (100 kcal or 420 kJ/100 mL). Feedings are initiated with higher frequency and smaller volumes; over time, the frequency is reduced from 12 to 8 to 6 feedings per 24 hr. The initial caloric intake is estimated at 80-100 kcal/kg/day. In developed countries, 24-27 calorie/oz infant formulas may be initiated with the same daily caloric goals. If diarrhea starts or fails to resolve and lactose intolerance is suspected, a non–lactose-containing formula should be substituted. If milk protein intolerance is suspected, a soy protein hydrolysate formula may be used.
Table 43-5 TIME FRAME FOR THE MANAGEMENT OF A CHILD WITH SEVERE MALNUTRITION*
| INGREDIENT | AMOUNT | |
|---|---|---|
| F75* | F100† | |
| Dried skim milk | 25 g | 80 g |
| Sugar | 70 g | 50 g |
| Cereal flour | 35 g | |
| Vegetable oil | 27 g | 60 g |
| Mineral mix‡ | 20 mL | 20 mL |
| Vitamin mix‡ | 140 mg | 140 mg |
| Water to make | 1,000 mL | 1,000 mL |
* To prepare the F75 diet, add the dried skim milk, sugar, cereal flour, and oil to some water and mix. Boil for 5-7 min. Allow to cool, then add the mineral mix and vitamin mix, and mix again. Make up the volume to 1,000 mL with water.
† To prepare the F100 diet, add the dried skim milk, sugar, and oil to some warm boiled water and mix. Add the mineral mix and vitamin mix, and mix again. Make up the volume to 1,000 mL with water.
‡ If only small amounts of feed are being prepared, it is not feasible to prepare the vitamin mix because of the small amounts involved. In this case, give a proprietary multivitamin supplement. Alternatively, a combined mineral and vitamin mix for malnourished children is available commercially and may be used in these diets. A comparable formula can be made from 35 g whole dried milk, 70 g sugar, 35 g cereal flour, 17 g oil, 20 mL mineral mix, 140 mg vitamin mix, and water to make 1,000 mL. Alternatively, use 300 mL fresh cow’s milk, 70 g sugar, 35 g cereal flour, 17 g oil, 20 mL mineral mix, 140 mg vitamin mix, and water to make 1,000 mL. Isotonic versions of F75 (280 mOsmol/L), which contain maltodextrins instead of cereal flour and some of the sugar and which include all the necessary micronutrients, are available commercially. If cereal flour is not available or there are no cooking facilities, a comparable formula can be made from 25 g dried skim milk, 100 g sugar, 27 g oil, 20 mL mineral mix, 140 mg vitamin mix, and water to make 1,000 mL. However, this formula has a high osmolarity (415 mOsmol/L) and might not be well tolerated by all children, especially those with diarrhea. A comparable formula can be made from 110 g whole dried milk, 50 g sugar, 30 g oil, 20 mL mineral mix, 140 mg vitamin mix, and water to make 1,000 mL. Alternatively, use 880 mL fresh cow’s milk, 75 g sugar, 20 g oil, 20 mL mineral mix, 140 mg vitamin mix, and water to make 1,000 mL.
From World Health Organization: Management of severe malnutrition: a manual for physicians and other senior health care workers, Geneva, 1999, World Health Organization.
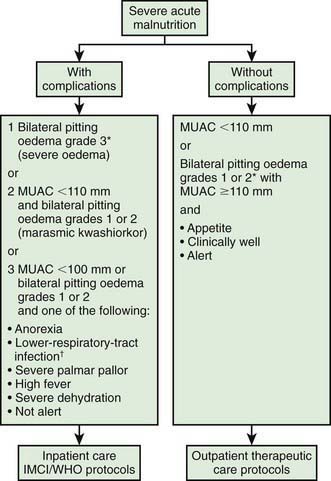
Another approach is the use of ready to use therapeutic foods (RUTFs) (Fig. 43-8). RUTFs reduce mortality in a cost-effective manner, in part because they are less susceptible to spoilage than powdered milk–based supplementary foods. F100 is water based and subject to bacterial contamination, whereas RUTF is an oil-based paste that has little water content and a similar nutrient profile but a higher calorie density and is equally palatable to F100. RUTF is a mixture of powdered milk, peanuts, sugar, vitamins, and minerals.
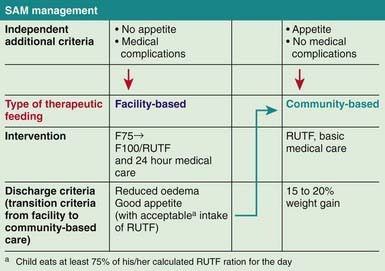
Figure 43-8 Severe acute malnutrition (SAM) management. RUTF, ready to use therapeutic foods.
(From World Health Organization and the United Nations Children’s Fund: WHO child growth standards and the identification of severe acute malnutrition in infants and children, 2009 (PDF). www.who.int/nutrition/publications/severemalnutrition/9789241598163/en/index.html. Accessed May 23, 2010.)
Laboratory evaluation (Table 43-7) and ongoing monitoring (Table 43-8), when available, help guide therapy and prevent complications. Fluid status must be monitored very carefully in anemic patients, who might require a packed red blood cell transfusion.
Table 43-7 LABORATORY FEATURES OF SEVERE MALNUTRITION
| BLOOD OR PLASMA VARIABLES | INFORMATION DERIVED |
|---|---|
| Hemoglobin, hematocrit, erythrocyte count, mean corpuscular volume | Degree of dehydration and anemia; type of anemia (iron/folate and vitamin B12 deficiency, hemolysis, malaria) |
| Glucose | Hypoglycemia |
| Electrolytes and alkalinity | |
| • Sodium | Hyponatremia, type of dehydration |
| • Potassium | Hypokalemia |
| • Chloride, pH, bicarbonate | Metabolic alkalosis or acidosis |
| Total protein, transferrin, (pre)albumin | Degree of protein deficiency |
| Creatinine | Renal function |
| C-reactive protein, lymphocyte count, serology, thick and thin blood films | Presence of bacterial or viral infection or malaria |
| Stool examination | Presence of parasites |
From Müller O, Krawinkel M: Malnutrition and health in developing countries, CMAJ 173(3):279–286, 2006. © 2005 Canadian Medical Association. Reprinted with permission of the publisher.
Table 43-8 ELEMENTS IN THE MANAGEMENT OF SEVERE PROTEIN-ENERGY MALNUTRITION
| PROBLEM | MANAGEMENT |
|---|---|
| Hypothermia | Warm patient up; maintain and monitor body temperature |
| Hypoglycemia | Monitor blood glucose; provide oral (or intravenous) glucose |
| Dehydration | Rehydrate carefully with oral solution containing less sodium and more potassium than standard mix |
| Micronutrients | Provide copper, zinc, iron, folate, multivitamins |
| Infections | Administer antibiotic and antimalarial therapy, even in the absence of typical symptoms |
| Electrolytes | Supply plenty of potassium and magnesium |
| Starter nutrition | Keep protein and volume load low |
| Tissue-building nutrition | Furnish a rich diet dense in energy, protein, and all essential nutrients that is easy to swallow and digest |
| Stimulation | Prevent permanent psychosocial effects of starvation with psychomotor stimulation |
| Prevention of relapse | Start early to identify causes of protein-energy malnutrition in each case; involve the family and the community in prevention |
From Müller O, Krawinkel M: Malnutrition and health in developing countries, CMAJ 173(3):279–286, 2006. © 2005 Canadian Medical Association. Reprinted with permission of the publisher.
The second rehabilitation phase (wk 2-6) may include continued antibiotic therapy with appropriate changes, if the initial combination was not effective, and introduction of the F100 or RUTF diet (Tables 43-6 and 43-9) with a goal of at least 100 kcal/kg/day. This phase usually lasts an additional 4 wk. At any time, if the infant is unable to take the feedings from a cup, syringe, or dropper, administration by a nasogastric tube rather than by the parenteral route is preferred. Bottles may be contaminated in certain locales, and their use is discouraged unless cleanliness is assured. Once ad libitum feedings are allowed, intakes of both energy and protein are often substantial. Iron therapy usually is not started until this phase of treatment; iron can interfere with the protein’s host defense mechanisms. There also is concern that free iron during the early phase of treatment might exacerbate oxidant damage, precipitating infections (malaria), clinical kwashiorkor, or marasmic kwashiorkor in a child with clinical marasmus. Some recommend treatment with antioxidants.
Table 43-9 COMPOSITION OF F75 AND F100 DIETS
| CONSTITUENT | AMOUNT PER 100 mL | |
|---|---|---|
| F75 | F100 | |
| Energy | 75 kcalth (315 kJ) | 100 kcalth (420 kJ) |
| Protein | 0.9 g | 2.9 g |
| Lactose | 1.3 g | 4.2 g |
| Potassium | 3.6 mmol | 5.9 mmol |
| Sodium | 0.6 mmol | 1.9 mmol |
| Magnesium | 0.43 mmol | 0.73 mmol |
| Zinc | 2.0 mg | 2.3 mg |
| Copper | 0.25 mg | 0.25 mg |
| Percentage of energy from: | ||
| Protein | 5% | 12% |
| Fat | 32% | 53% |
| Osmolarity | 333 mOsmol/L | 419 mOsmol/L |
From World Health Organization: Management of severe malnutrition: a manual for physicians and other senior health care workers, Geneva, 1999, World Health Organization.
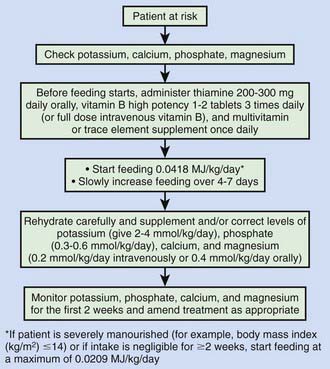
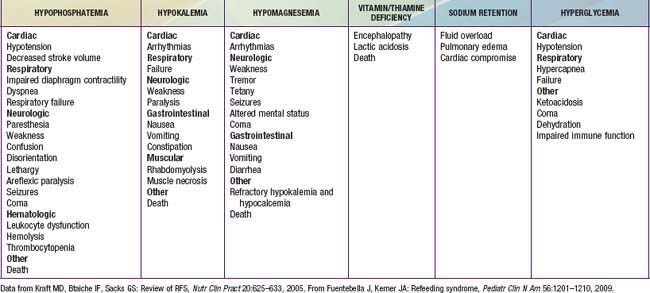
Refeeding syndrome can complicate the acute nutritional rehabilitation of children who are undernourished from any cause (Fig. 43-9, Table 43-10). The hallmark of refeeding syndrome is the development of severe hypophosphatemia after the cellular uptake of phosphate during the 1st week of starting to refeed. Serum phosphate levels of ≤0.5 mmol/L can produce weakness, rhabdomyolysis, neutrophil dysfunction, cardiorespiratory failure, arrhythmias, seizures, altered level of consciousness, or sudden death. Phosphate levels should be monitored during refeeding, and if they are low, phosphate should be administered during refeeding to treat severe hypophosphatemia (Chapter 52.6).
Ahmad S, Ellis J, Nesbitt A, Molyneux E. Pericardial effusions in children with severe protein energy malnutrition resolve with therapeutic feeding: a prospective cohort study. Arch Dis Child. 2008;93:1033-1036.
Behrman JR, Alderman H, Hoddinott J. Hunger and malnutrition. In: Lomborg B, editor. Global crises, global solutions. Cambridge: Cambridge University Press, 2004.
Berg A, Levinson J, Moorthy D: Reflections from the front lines. Swimming upstream with optimism. A survey of the international nutrition community. Paper presented at 35th Standing Committee on Nutrition Meeting, Hanoi, March 3, 2008.
Bhutta ZA. Addressing severe acute malnutrition where it matters. Lancet. 2009;374:94-96.
Bhutta ZA, Ahmed T, Black RE, et al. What works? Interventions for maternal and child undernutrition and survival. Lancet. 2008;371:417-440.
Black RE, Allen LH, Bhutta ZA, et al. Maternal and child undernutrition: global and regional exposures and health consequences. Lancet. 2008;371:243-260.
Brabin B. Infant vitamin A supplementation: consensus and controversy. Lancet. 2007;369:2054-2056.
Centers for Disease Control and Prevention. Nutritional and health status of children during a food crisis—Niger, September 17-October 14, 2005. MMWR. 2006;55:1172-1176.
Collins S. Treating severe acute malnutrition seriously. Arch Dis Child. 2007;92:453-461.
Collins S, Dent N, Binns P, et al. Management of severe acute malnutrition in children. Lancet. 2006;368:1992-2000.
Collins S, Sadler K, Dent N, et al. Key issues in the success of community-based management of severe malnutrition. Food Nutr Bull. 2006;27(suppl 3):S49-S82.
Dale NM, Grais RF, Minetti A, et al. Comparison of the new World Health Organization growth standards and the National Center for Health Statistics growth reference regarding mortality of malnourished children treated in a 2006 nutrition program in Niger. Arch Pediatr Adoles Med. 2009;163:126-130.
Fuentebella J, Kerner JA. Refeeding syndrome. Pediatr Clin N Am. 2009;56:1201-1210.
Gluckman PM, Hanson MA, Cooper C, Thornburg KL. Effect of in utero and early life conditions on adult health and disease. New Engl J Med. 2008;359:61-73.
Grover Z, Ee LC. Protein energy malnutrition. Pediatr Clin N Am. 2009;56:1055-1068.
Haddad L, Alderman H, Appleton S, et al. Reducing child malnutrition: how far does income growth take us? World Bank Econ Rev. 2003;17:107-131.
Hoddinott J, Behrman JR, Maluccio JA, et al. Effect of a nutrition intervention during early childhood on economic productivity in Guatemalan adults. Lancet. 2008;371:411-416.
Horton S, Shekar M, McDonald C, et al. Scaling up nutrition: what will it cost?. Washington, DC: World Bank; 2010.
Isanaka S, Nombela N, Dijibo A, et al. Effect of preventive supplementation with ready-to-use therapeutic food on the nutritional status, mortality, and morbidity of children aged 6 to 60 months in Niger. JAMA. 2009;301:277-285.
Karaolis N, Jackson D, Ashworth A, et al. WHO guideline for severe malnutrition: are they feasible in rural African hospitals? Arch Dis Child. 2007;92:198-204.
Lazzerini M. Effect of zinc supplementation on child mortality. Lancet. 2007;370:1194-1196.
Manary MJ, Sandige HL. Management of acute moderate and severe childhood malnutrition. BMJ. 2008;337:1227-1230.
Mehanna HM, Moledina J, Travis J. Refeeding syndrome: what it is, and how to prevent and treat it. BMJ. 2008;336:1495-1498.
Morris SS, Cogill B, Uauy R, et al. Effective international action against undernutrition: why has it proven so difficult and what can be done to accelerate progress? Lancet. 2008;371:608-620.
Ruel MT, Menon P, Habicht JP, et al. Age-based preventive targeting of food assistance and behaviour change and communication for reduction of childhood undernutrition in Haiti: a cluster randomized trial. Lancet. 2008;371:588-595.
Shrimpton R, Victora C, de Onis M, et al. Worldwide timing of growth faltering: implications for nutritional interventions. Pediatrics. 2001;107:75-81.
World Bank. Repositioning nutrition as central to development: a strategy for large-scale action. Washington, DC: World Bank; 2006.
World Health Organization: Regional consultation on nutrition and HIV/AIDS in South-East Asia: evidence, lessons and recommendations for action. Bangkok, Thailand. 8-11 October 2007.
World Health Organization and the United Nations Children’s Fund. WHO child growth standards and the identification of severe acute malnutrition in infants and children. www.who.int/nutrition/publications/severemalnutrition/9789241598163/en/index.html, 2009. (PDF) Accessed May 23, 2010
[/level-membership-for-pediatrics-category][not-level-membership-for-pediatrics-category]
Chapter 43 Nutrition, Food Security, and Health
Malnutrition as the Intersection of Food Security and Health Security
Undernutrition is usually an outcome of 3 factors: household level food security, access to health and sanitation services, and child caring practices. A mother with few economic resources who knows how to care for her children and is enabled to do so can often use available food and health services to produce well-nourished children. If food resources and health services are available in a community, but the mother does not access immunizations or does not know how or when to properly add complementary foods to her child’s diet, that child might become malnourished (Table 43-1).
Table 43-1 THREE MYTHS ABOUT NUTRITION
From World Bank: Repositioning nutrition as central to development, 2006 (PDF). http://web.worldbank.org/WBSITE/EXTERNAL/TOPICS/EXTHEALTHNUTRITIONANDPOPULATION/EXTNUTRITION/0,contentMDK:20787550~menuPK:282580~pagePK:64020865~piPK:149114~theSitePK:282575,00.html. Accessed May 23, 2010.
Undernutrition
The greatest risk of undernutrition occurs during pregnancy and in the first 2 years of life (Fig. 43-1); the effects of this early damage on health, brain development, intelligence, educability, and productivity are potentially irreversible (Table 43-2). Governments with limited resources are therefore best advised to focus publicly funded actions on this critical window of opportunity, between preconception and 24 mo of age. Folate deficiency also increases the risk of birth defects; this particular window of opportunity is before conception, as it is with iodine. Iron deficiency anemia is another dimension of undernutrition that has measurable risks that extend outside of the early years of life, with particular risks to the health of a mother as well as for the birth weight of her child. Anemia can also reduce physical and cognitive function and economic productivity of adults of both sexes.
Figure 43-1 The window of opportunity for improving nutrition is very small: prepregnancy until 18-24 mo of age.
(From The World Bank’s Human Development Network: Better nutrition = less poverty: repositioning nutrition as central to development: a strategy for large scale action, 2006 [PDF]. http://siteresources.worldbank.org/NUTRITION/Resources/281846-1114108837888/RepositioningNutritionLaunchJan30Final.pdf. Accessed May 23, 2010.)
Table 43-2 WHY MALNUTRITION PERSISTS IN MANY FOOD-SECURE HOUSEHOLDS
From World Bank: Repositioning nutrition as central to development, 2006 (PDF). http://web.worldbank.org/WBSITE/EXTERNAL/TOPICS/EXTHEALTHNUTRITIONANDPOPULATION/EXTNUTRITION/0,contentMDK:20787550~menuPK:282580~pagePK:64020865~piPK:149114~theSitePK:282575,00.html. Accessed May 23, 2010.
Measurement of Undernutrition
The term malnutrition encompasses both ends of the nutrition spectrum, from undernutrition (underweight, stunting, wasting, and micronutrient deficiencies) to overweight. Many poor nutritional outcomes begin in utero and are manifest as low birthweight (LBW). Prematurity and intrauterine growth restriction (IUGR) are the two main causes of LBW, with prematurity relatively more important in developed countries and IUGR relatively more important in developing countries (Chapter 90).
In preschool- and school-aged children, nutritional status is often assessed in terms of anthropometry. International references have been established that allow normalization of anthropometric measures in terms of z scores defined as the child’s height (weight) minus the median height (weight) for the age and sex of the child divided by the relevant standard deviation (Table 43-3). The World Health Organization (WHO) recently revised the child growth references based on data from healthy children in 5 countries. Comparisons of malnutrition rates across countries are meaningful, and these growth references are applicable to all children across the globe.
Height for age is useful for assessing the nutritional status of populations, because this measure of skeletal growth reflects the cumulative impact of events affecting nutritional status that result in stunting and is also referred to as chronic malnutrition. This measure contrasts with weight for height, or wasting, which is a measure of acute malnutrition. Weight for age is an additional commonly used measurement of nutritional status. Although it has less clinical significance because it combines stature with current health conditions, it has the advantage of being somewhat easier to measure: Current weighing scales allow a child to be weighed in a caregiver’s arms, but weight for height requires 2 different instruments for measurement. Height for age is particularly difficult to measure for the most vulnerable children <2 yr of age for whom recumbent length is the preferred indicator for height. In emergencies and in some field settings, mid-upper arm circumference (MUAC) is often used for screening in lieu of weight for height (see Table 43-3).
Another dimension of malnutrition is micronutrient deficiencies. The micronutrients of particular public-health significance are iodine, vitamin A, iron, folic acid, and zinc. Iodine deficiency and its sequelae (goiter, hypothyroidism, and developmental disabilities including severe mental retardation) are assessed by clinical inspection of enlarged thyroids (goiter) or by iodine concentrations in urine (µg/L). Even mild forms of iodine deficiency during pregnancy have been implicated in poor mental and physical development among children as well as fetal losses. The public-health benchmark for eliminating iodine deficiency in a population is <20% of the population with urinary iodine levels <50 µg/L (Chapter 51).
Vitamin A deficiency is caused by low intake of retinol or its precursor, beta-carotene. Absorption can be inhibited by a lack of fats in the diet or by parasite infestations. Clinical deficiency is estimated by combining night blindness and eye changes—principally Bitot spots and total xerophthalmia prevalence. Subclinical deficiency is assessed as prevalence of serum retinal concentrations <0.70 µmol/L (Chapter 45). The greatest public-health significance of vitamin A deficiency is its association with a higher mortality among young children. Prophylactic supplementation of vitamin A among deficient populations for children <5 yr of age can reduce child mortality by as much as 23%.
