Chapter 5 Nutrition
Introduction
Diet and disease are interrelated in many ways:
 Excess energy intake contributes to a number of diseases, including ischaemic heart disease and diabetes, particularly when high in animal (saturated) fat content.
 There is a relationship between food intake and cancer, as found in many epidemiological studies. An excess of energy-rich foods (i.e. fat and sugar containing), often with physical inactivity, plays a role in the development of certain cancers, while diets high in vegetables and fruits reduce the risk of most epithelial cancers. Numerous carcinogens, intentional additions (e.g. nitrates for preserving foods) or accidental contaminants (e.g. moulds producing aflatoxin and fungi) may also be involved in the development of cancer.
 The proportion of processed foods eaten may affect the development of disease. Some processed convenience foods have a high sugar and fat content and therefore predispose to dental caries and obesity, respectively. They also have a low fibre content, and dietary fibre can help in the prevention of a number of diseases (see p. 199).
 Long-term undernutrition is implicated in disease by some epidemiological studies, for example low growth rates in utero are associated with high death rates from cardiovascular disease in adult life.
Water and electrolyte balance
Water and electrolyte balance is dealt with fully in Chapter 13. About 1 L of water is required in the daily diet to balance insensible losses, but much more is usually drunk, the kidneys being able to excrete large quantities. The daily RNI for sodium is 70 mmol (1.6 g) but daily sodium intake varies in the range 90–440 mmol (2–10 g). These are needlessly high intakes of sodium which are thought by some to play a role in causing hypertension (see p. 778).
Dietary requirements
Energy
Food is necessary to provide the body with energy (Fig. 5.1). The SI unit of energy is the joule (J), and 1 kJ = 0.239 kcal. The conversion factor of 4.2 kJ, equivalent to 1.00 kcal, is used in clinical nutrition.
Energy requirements
Energy expenditure
Daily energy expenditure (Fig. 5.2) is the sum of:
Basal metabolic rate. The BMR can be calculated by measuring oxygen consumption and CO2 production, but it is more usually taken from standardized tables (Table 5.1) that only require knowledge of the subject’s age, weight and sex.
Table 5.1 Equations for the prediction of basal metabolic rate (in MJ/day)
| Age range (years) | Equation for predicting BMRa | 95% confidence limits |
|---|---|---|
|
Men |
|
|
|
10–17 |
0.0740 × (wt) + 2.754 |
±0.88 |
|
18–29 |
0.0630 × (wt) + 2.896 |
±1.28 |
|
30–59 |
0.0480 × (wt) + 3.653 |
±1.40 |
|
60–74 |
0.0499 × (wt) + 2.930 |
N/A |
|
75+ |
0.0350 × (wt) + 3.434 |
N/A |
|
Women |
|
|
|
10–17 |
0.0560 × (wt) + 2.898 |
±0.94 |
|
18–29 |
0.0620 × (wt) + 2.036 |
±1.00 |
|
30–59 |
0.0340 × (wt) + 3.538 |
±0.94 |
|
60–74 |
0.0386 × (wt) + 2.875 |
N/A |
|
75+ |
0.0410 × (wt) + 2.610 |
N/A |
Data from Department of Health, 1991. BMR, basal metabolic rate. aBodyweight (wt) in kg.
Physical activity. The physical activity ratio (PAR) is expressed as multiples of the BMR for both occupational and non-occupational activities of varying intensities (Table 5.2).
Table 5.2 Physical activity ratio (PAR) for various activities (expressed as multiples of BMR)
| PAR | |
|---|---|
|
Occupational activity |
|
|
Professional/housewife |
1.7 |
|
Domestic helper/sales person |
2.7 |
|
Labourer |
3.0 |
|
Non-occupational activity |
|
|
Reading/eating |
1.2 |
|
Household/cooking |
2.1 |
|
Gardening/golf |
3.7 |
|
Jogging/swimming/football |
6.9 |
In the UK, the estimated ‘average’ daily energy requirement is:
Energy stores
Although virtually all body fat and glycogen are available for oxidation, less than half the protein is available for oxidation. Figure 5.3 shows that fat accounts for the largest reserves of energy in both lean and obese subjects. The size of the stores determines survival during starvation.
Protein
Grams of protein required = Urinary nitrogen × 6.25 (most proteins contain about 16% of nitrogen).
Protein contains many amino acids:
 Indispensable (essential): there are nine amino acids that cannot be synthesized and must be provided in the diet: tryptophan, histidine, methionine, threonine, isoleucine, valine, phenylalanine, lysine, leucine.
 Dispensable (non-essential): amino acids that can be synthesized in the body (some may still be needed in the diet unless adequate amounts of their precursors are available).
Role of amino acids
 Glutamine is quantitatively the most significant in the circulation and in inter-organ exchange.
 Alanine is released from muscle; it is deaminated and converted into pyruvic acid before entering the citric acid cycle.
 Homocysteine is a sulphur-containing amino acid which is derived from methionine in the diet. A raised plasma concentration is an independent risk factor for vascular disease (see p. 728).
 Amino acids are utilized to synthesize products other than protein or urea. For example:
Fat
Dietary fat is chiefly in the form of triglycerides, which are esters of glycerol and free fatty acids. Fatty acids vary in chain length and in saturation (Table 5.3). The hydrogen molecules related to the double bonds can be in the cis or the trans position; most natural fatty acids in food are in the cis position (Box 5.1).
| Fatty acid | No. of carbon atoms : No. of double bonds | Position of double bondsa |
|---|---|---|
|
Saturated |
|
|
|
Lauric |
C12:0 |
|
|
Myristic |
C14:0 |
|
|
Palmitic |
C16:0 |
|
|
Stearic |
C18:0 |
|
|
Monounsaturated |
|
|
|
Oleic |
C18:1 |
(n-9) |
|
Elaidic |
C18:1 |
(n-9 trans) |
|
Polyunsaturated |
|
|
|
Linoleic |
C18:2 |
(n-6) |
|
α-Linolenic |
C18:3 |
(n-3) |
|
Arachidonic |
C20:4 |
(n-6) |
|
Eicosapentaenoic |
C20:5 |
(n-3) |
|
Docosahexaenoic |
C22:6 |
(n-3) |
a Positions of the double bonds (designated either n as here or ω) are shown counted from the methyl end of the molecule. All double bonds are in the cis position except that marked trans.
![]() Box 5.1
Box 5.1
Dietary sources of fatty acids
| Type of acid | Sources |
|---|---|
|
Saturated fatty acids |
Mainly animal fat |
|
n-6 fatty acids |
Vegetable oils and other plant foods |
|
n-3 fatty acids |
Vegetable foods, rapeseed oil, fish oils |
|
trans fatty acids |
Hydrogenated fat or oils, e.g. in margarine, cakes, biscuits |
Recommendations for fat intake
The current recommendations for fat intake for the UK are shown in Box 5.2.
![]() Box 5.2
Box 5.2
Recommended healthy dietary intake
| Dietary component | Approximate amounts given as % of total energy unless otherwise stated | General hints |
|---|---|---|
|
Total carbohydrate |
55 (55–75) |
Increase fruit, vegetables, beans, pasta, bread |
|
Free sugar |
10 (<10) |
Decrease sugary drinks |
|
Protein |
15 (10–15) |
Decrease red meat (see fat below) |
|
Total fat |
30 (15–30) |
Increase vegetable (including olive oil) and fish oil and decrease animal fat |
|
Saturated fatty acids |
10 (<10) |
|
|
Cis-mono unsaturated fatty acids |
20 |
Mainly oleic acid (n-6) |
|
Cis-polyunsaturated fatty acids |
6 |
Both n-6 and n-3 PUFA |
|
Approximate amounts |
|
|
|
Cholesterol |
<300 (<300) mg/day |
Decrease meat and eggs |
|
Salt |
<6 (<5) g/day |
Decrease prepared meats and do not add extra salt to food |
|
Total dietary fibre |
30 (>25) g/day |
Increase fruit and vegetables and wholegrain foods |
Values in parentheses are goals for the intake of populations, as given by the WHO (including populations who are already on low-fat diets). Some of the extreme ranges are not realistic short-term goals for developed countries, e.g. 75% of total energy from carbohydrate and 15% fat. When total energy intake is 2500 kcal (10 500 kJ) per day, 55% of intake comes from carbohydrate (344 g, i.e. 1376 kcal (5579 kJ)) and 30% from fat (83 g, i.e. 747 kcal (3137 kJ)).
Cholesterol
Cholesterol is found in all animal products. Eggs are particularly rich in cholesterol, which is virtually absent from plants. The average daily intake in the UK is 300–500 mg. Cholesterol is also synthesized (see p. 306) and only very high or low dietary intakes will significantly affect blood levels.
Health promotion
Box 5.2 suggests the composition of the ‘ideal healthy diet’. The values given are based on the principle of:
 reducing total fat in the diet, particularly saturated fat
 increasing consumption of fish which contain n-3 (or ω-3) polyunsaturated fatty acids
 increasing intake of whole-grain cereals, green and orange vegetables and fruits, leading to an increase in fibre and antioxidants.
Nutrient goals and dietary guidelines
 Nutrient goals refer to the national intakes of nutrients that are considered appropriate for optimal health in the population.
 Dietary guidelines refer to the dietary methods used to achieve these goals.
FURTHER READING
Beaglehole R, Horton R. Chronic diseases: global action must match global evidence. Lancet 2010; 376:1619–1621.
Elia M, Cummings, JH. Physiological aspects of energy metabolism and gastrointestinal effects of carbohydrates. Eur J Clin Nutr 2007; (Suppl 1):SO40–SO74.
Institute of Medicine. Dietary reference intakes for energy, carbohydrate, fiber, fat, fatty acids, protein, and amino acids. Washington, DC: The National Academies Press; 2005.
World Health Organization. Protein and amino acid requirements in human nutrition WHO Technical Report Series 935. Report of a Joint WHO/FAO/UNU Expert Consultation United Nations. Geneva: WHO; 2007.
WHO/FAO Expert Consultation. Diet, nutrition and the prevention of chronic diseases. Geneva: WHO; 2003.
Zampelas A. Eicosapentaenoic acid (EPA) from highly concentrated n-3 fatty acid ethyl esters is incorporated into advanced atherosclerotic plaques and higher plaque EPA is associated with decreased plaque inflammation and increased stability. Atherosclerosis 2010; 212:34–35.
Protein-energy malnutrition (PEM)
Developed countries
Starvation uncomplicated by disease is relatively uncommon in developed countries, although some degree of undernourishment is seen in very poor areas. Most nutritional problems occurring in the population at large are due to eating wrong combinations of foodstuffs, such as an excess of refined carbohydrate or a diet low in fresh vegetables. Undernourishment associated with disease is common in hospitals and nursing homes, and Table 5.4 gives a list of conditions in which malnutrition is often seen. Surgical complications, with sepsis, are a common cause. Many patients are admitted to hospital undernourished, and a variety of chronic conditions predispose to this state (Table 5.5).
Table 5.4 Common conditions associated with protein-energy malnutrition
| Sepsis | Dementia |
|---|---|
|
Trauma |
Malignancy |
|
Surgery, particularly of GI tract with complications |
Any very ill patient |
|
GI disease, particularly involving the small bowel |
Severe chronic inflammatory diseases |
|
|
Psychosocial: poverty, social isolation, anorexia nervosa, depression |
Table 5.5 Nutritional consequences of disease and the underlying risk factors (physical/psychosocial problems)
The majority of the weight loss, leading to malnutrition, is due to poor intake secondary to the anorexia associated with the underlying condition. Disease may also contribute by causing malabsorption and increased catabolism, which is mediated by complex changes in cytokines, hormones, side-effects of drugs, and immobility. The elderly are particularly at risk of malnutrition because they often suffer from diseases and psychosocial problems such as social isolation or bereavement (Table 5.5).
Pathophysiology of starvation (Fig. 5.4)
The metabolic response to prolonged starvation differs between lean and obese individuals. One of the major differences concerns the proportion of energy derived from protein oxidation, which determines the proportion of weight loss from lean tissues. This proportion may be up to three times smaller in obese subjects than lean subjects. It can be regarded as an adaptation which depends on the composition of the initial reserves (Fig. 5.3). This means that deterioration in body function is more rapid in lean subjects. Furthermore, survival time is much less in lean subjects (~2 months), compared to the obese (can be at least several months).
Regulation of metabolism
 Circulating substrate concentrations. The uptake and metabolism of ketone bodies, which serve as the major fuel for the brain during prolonged starvation, is primarily determined by the circulatory concentration which can increase up to 5 mmol/L or more. The liver is responsible for producing ketone bodies, the production of which is in turn controlled by the availability of fatty acids derived from adipose tissue. Substrates may also compete with each other for metabolism, for example glucose competes with non-esterified fatty acids for uptake and metabolism in muscle and heart (the glucose-fatty acid cycle) and this is independent of hormones.
 Blood flow. The delivery of substrates (and other signals) to tissues depends not only on their circulating concentration but also on the blood flow to tissues. In many tissues there is coupling between metabolic activity and blood flow, with arterioles regulating blood flow to the tissue according to demand, e.g. blood flow to muscle increases during exercise.
 Signals. Hormones and other signals, such as cytokines (see below), regulate intracellular metabolism.
Clinical features
Patients are sometimes seen with loss of weight or malnutrition as the primary symptom (failure to thrive in children). Mostly, however, malnourishment is only seen as an accompaniment of some other disease process, such as malignancy. Severe malnutrition is seen mainly with advanced organic disease or after surgical procedures followed by complications. Three key features which help in the detection of chronic protein-energy malnutrition (PEM) in adults are listed in Box 5.3.
![]() Box 5.3
Box 5.3
Key features in detection of chronic protein-energy malnutrition (PEM) in developed countries
In patients with oedema or dehydration the BMI may be somewhat misleading.
2. Weight loss in previous 3–6 months: >10%, high risk; 5–10%, possible risk; <5% low/no risk of developing PEM.
3. Acute disease effect: diseases that have resulted or are likely to result in no dietary intake for >5 days are associated with a high risk of malnutrition (e.g. prolonged unconsciousness, persistent swallowing problems after a stroke, or prolonged ileus after abdominal surgery).
Other factors that may suggest PEM include:
 History of decreased food intake/loss of appetite
 Clothes becoming loosely fitting (weight loss) and a general appearance indicating obvious wasting
 Physical and psychosocial disturbances likely to have contributed to the weight loss.
The factors listed in Box 5.3 act as a link between detection and management (Fig. 5.5, the ‘Malnutrition Universal Screening Tool’). If the underlying physical or psychosocial problems are not adequately addressed, treatment may not be successful.
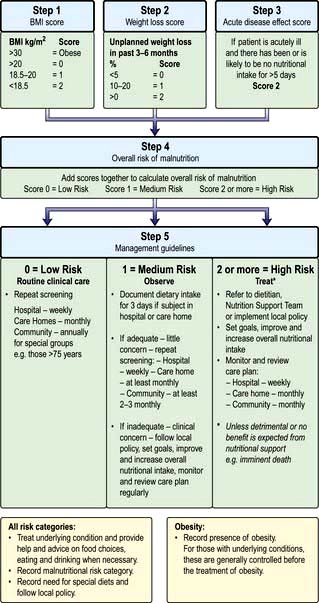
Figure 5.5 ‘Malnutrition Universal Screening Tool’ (‘MUST’)
(with permission from the British Association for Parenteral and Enteral Nutrition (BAPEN), at: http://www.bapen.org.uk).
PEM leads to a depression of the immunological defence mechanism, resulting in a decreased resistance to infection. It also detrimentally affects muscle strength and fatigue, reproductive function (e.g. in anorexia nervosa, which is common in adolescent girls; p. 1188), wound healing, and psychological function (depression, anxiety, hypochondriasis, loss of libido).
In children, growth failure is a key element in the diagnosis of PEM. New WHO standards for optimal growth in children 0–4 years have been adopted by developing and developed countries. They aim to reflect optimal rather than prevailing growth in both developed and developing countries, since they involved a healthy pregnancy and children born to non-smoking, relatively affluent mothers who breast-fed their children exclusively or predominantly for the first 6 months of life. The general principles of management of severe PEM in children are similar in developed and developing countries but resources are required to manage the problems once identified (see p. 205).
Treatment
When malnutrition is obvious and the underlying disease cannot be corrected at once, some form of nutritional support is necessary (see also pp. 221, 223). Nutrition should be given enterally if the gastrointestinal tract is functioning adequately. This can most easily be done by encouraging the patient to eat more often and by giving a high-calorie supplement. If this is not possible, a liquefied diet may be given intragastrically via a fine-bore tube or by a percutaneous endoscopic gastrostomy (PEG). If both of these measures fail, parenteral nutrition is given.
Developing countries
 Kwashiorkor occurs typically in a young child displaced from breast-feeding by a new baby. It is often precipitated by infections such as measles, malaria and diarrhoeal illnesses. The child is apathetic and lethargic with severe anorexia. There is generalized oedema with skin pigmentation and thickening (Fig. 5.6b). The hair is dry, sparse and may become reddish or yellow in colour. The abdomen is distended owing to hepatomegaly and/or ascites. The serum albumin is always low. The exact cause is unknown, but theories related to diet (low in protein, and high in carbohydrate) and free radical damage in the presence of inadequate antioxidant defences have been proposed.
 Marasmus is the childhood form of starvation, which is associated with obvious wasting. The child looks emaciated, there is obvious muscle wasting and loss of body fat. There is no oedema. The hair is thin and dry (Fig. 5.6a). The child is not so apathetic or anorexic as with kwashiorkor. Diarrhoea is frequently present and signs of infection must be looked for carefully.
A classification of severe malnutrition by the World Health Organization (WHO) (Table 5.6) makes no distinction between kwashiorkor and marasmus, because their approach to treatment is similar. The WHO classification of chronic undernutrition in children is based on standard deviation (SD) scores. Thus, children with an SD score between −2 and −3 (between 3 and 2 standard deviation scores below the median – corresponding to a value between 0.13 and 2.3 centile) can be regarded as being at moderate risk of undernutrition, and below an SD score of −3, of severe malnutrition. A low weight-for-height is a measure of thinness (wasting when pathological) and a low height-for-age is a measure of shortness (stunting when pathological). Those with oedema and clinical signs of severe malnutrition are classified as having oedematous malnutrition.
| Moderate malnutrition | Severe malnutritiona | |
|---|---|---|
|
Symmetrical oedema |
No |
Yes: oedematous malnutritionb |
|
Weight-for-height SD score |
−3 to −2 (70–79%)c |
|
|
Height-for-age SD score |
−3 to −2 (85–89%)c |
<−3 (<85%)c (severe stunting) |
a The diagnoses are not mutually exclusive.
b Older classifications use the terms kwashiorkor and marasmic-kwashiorkor instead.
c Percentage of the median National Centre for Health Statistics/WHO reference.
d Called marasmus (without oedema) in the Wellcome classification and grade II in the Gomez classification.
Investigations
These are not always practicable in certain settings in the developing world.
 Stools should be examined for parasitic infestations.
 Chest X-ray – tuberculosis is common and is easily missed if a chest X-ray is not performed.
Resuscitation and stabilization
The severely ill child will require:
 Correction of fluid and electrolyte abnormalities, but intravenous therapy should be avoided if possible because of the danger of fluid overload
 Treatment of shock with oxygen
 Treatment of hypoglycaemia (blood glucose <3 mmol/L), hypothermia (reduce heat loss, and provide additional heat if necessary) and infection (antibiotics) – these often co-exist.
Infection is common (Box 5.4). Diarrhoea is often due to bacterial or protozoal overgrowth; metronidazole is very effective and is often given routinely. Parasites are also common and, as facilities for stool examination are usually not available, mebendazole 100 mg twice daily should be given for 3 days. In high-risk areas, antimalarial therapy is given.
Large doses of vitamin A are also given because deficiency of this vitamin is common. After the initial resuscitation, further stabilization over the next few days is undertaken, as indicated in Table 5.7.
Table 5.7 Timeframe for the management of the child with severe malnutrition (the 10-step approach recommended by the WHO)
Prevention
Prevention of PEM depends not only on adequate nutrients being available but also on education of both governments and individuals in the importance of good nutrition and immunization (Box 5.5). Short-term programmes are useful for acute shortages of food, but long-term programmes involving improved agriculture are equally necessary. Bad feeding practices and infections are more prevalent than actual shortage of food in many areas of the world. However, good surveillance is necessary to avoid periods of famine.
FURTHER READING
Bhutta ZA. Addressing severe malnutrition where it matters. Lancet 2009; 374:94–96.
Collins S, Dent N, Binns P et al. Management of severe acute malnutrition in children. Lancet 2006; 368:1992–2000.
Collins S, Sadler K, Dent N et al. Key issues in the success of community-based management of severe malnutrition. Food Nutr Bull 2006; 27:S49–S82.
Elia M, Russell CA, Stratton RJ. Malnutrition in the UK: Policies to address the problem. Proc Nutr Soc 2010; 69:470–476.
Kerac M, Egan R, Mayer S et al. New WHO growth standards: roll-out needs more resources. Lancet 2009; 374:100–102.
Stratton RJ, Elia M. Encouraging appropriate, evidence-based use of oral nutritional supplements. Proc Nutr Soc 2010; 69:477–487.
Stratton RJ, Elia M. A review of reviews: a new look at the evidence for oral nutritional supplements in clinical practice. Clin Nutr Suppl 2007; 2:5–23.
Wright CM, Williams AF, Ellman D et al. Using the new UK-WHO growth charts. BMJ 2010; 340:647–650. (The charts and supporting materials can be downloaded from: www.growthcharts.rcpch.ac.uk)
Vitamins
Deficiencies due to inadequate intake associated with PEM (Table 5.8) are commonly seen in the developing countries. This is not, however, invariable. For example, vitamin A deficiency is not seen in Jamaica, but is common in PEM in Hyderabad, India. In the West, deficiency of vitamins is less common but prominent in the specific groups shown in Table 5.9. The widespread use of vitamins as ‘tonics’ is unnecessary and should be discouraged. Toxicity from excess fat-soluble vitamins is occasionally seen.
Table 5.8 Fat-soluble and water-soluble vitamins: UK reference nutrient intake (RNI) and lower reference nutrient intake (LRNI) for men aged 19–50 yearsa
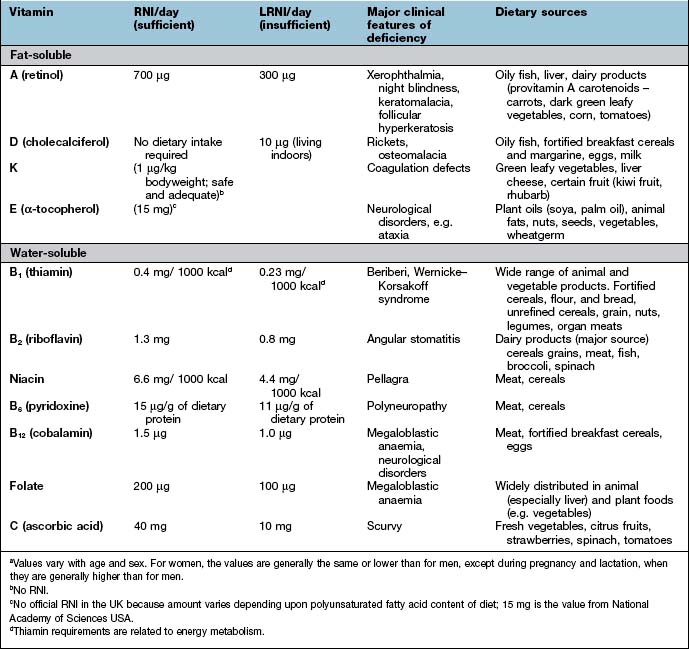
Table 5.9 Some causes of vitamin deficiency in developed countries
Fat-soluble vitamins
Vitamin A
Function
 Retinaldehyde in its cis form is found in the opsin proteins in the rods (rhodopsin) and cones (iodopsin) of the retina (p. 1055). Light causes retinaldehyde to change to its trans isomer, and this leads to changes in membrane potentials that are transmitted to the brain.
 Retinol and retinoic acid are involved in the control of cell proliferation and differentiation.
 Retinyl phosphate is a cofactor in the synthesis of most glycoproteins containing mannose.
Vitamin A deficiency
Xerophthalmia has been classified by the WHO (Table 5.10). Impaired adaptation followed by night blindness is the first effect. There is dryness and thickening of the conjunctiva and the cornea (xerophthalmia occurs as a result of keratinization). Bitot’s spots – white plaques of keratinized epithelial cells – are found on the conjunctiva of young children with vitamin A deficiency. These spots can, however, be seen without vitamin A deficiency, possibly caused by exposure. Corneal softening, ulceration and dissolution (keratomalacia) eventually occur, superimposed infection is a frequent accompaniment and both lead to blindness. In PEM, retinol-binding protein along with other proteins is reduced. This suggests vitamin A deficiency, although body stores are not necessarily reduced.
| Ocular signs | Classification |
|---|---|
|
Night blindness |
XN |
|
Conjunctival xerosis |
XIA |
|
Bitot’s spot |
X2 |
|
Corneal xerosis |
X2 |
|
Corneal ulceration/keratomalacia < |
X3A |
|
Corneal ulceration/keratomalacia > |
X3B |
|
Corneal scar |
XS |
|
Xerophthalmic fundus |
XF |
From WHO/UNICEF/IVACG 1988. X, xerophthalmia.
Prevention
Other effects of vitamin A
In a chronically malnourished population maternal repletions with vitamin A before, during and after pregnancy may improve lung function in the offspring at 9–13 years. It may also reduce maternal mortality. The effect of β-carotene in cardiovascular and other diseases is discussed below in the section entitled ‘Dietary antioxidants’ (p. 211). Retinoic acid and some synthetic retinoids are used in dermatology (p. 1213).
Possible adverse effects
 High intakes of vitamin A. Chronic ingestion of retinol can cause liver and bone damage, hair loss, double vision, vomiting, headaches and other abnormalities. Single doses of 300 mg in adults or 100 mg in children can be harmful.
 Retinol is teratogenic. The incidence of birth defects in infants is high with vitamin A intakes of >3 mg a day during pregnancy. In pregnancy, extra vitamin A or consumption of liver is not recommended in the UK. However, β-carotene is not toxic.
Vitamin D
Vitamin D is discussed in more detail in Chapter 11, where the most common manifestations of deficiency are discussed (bone and calcium disorders, Chapter 24; rickets and osteomalacia, Chapter 24). Vitamin D receptors are distributed widely in human tissues, but their function in many non-musculoskeletal tissues still remains poorly understood. Vitamin D status has been linked to a wide range of diseases, including:
 Cardiovascular (ischaemic heart disease, heart failure, hypertension)
 Respiratory (chest infections)
 Renal (progression of renal disease)
 Endocrinological (type 1 and type 2 diabetes)
 Neuropsychiatric disorders (depression, cognitive deficits)
 Cancer (e.g. prostate, breast, colon) and mortality from various causes.
Vitamin K
Function
Vitamin K is a cofactor necessary for the production not only of blood clotting factors (II, VII, IX and X, and other proteins involved in coagulation; Chapter 20), but also for proteins necessary in the formation of bone.
Vitamin K deficiency
Vitamin K deficiency results in inadequate synthesis of clotting factors (p. 423), which leads to an increase in the prothrombin time and haemorrhage. Deficiency occurs in the following circumstances:
The newborn
Water-soluble vitamins
Water-soluble vitamins are non-toxic and relatively cheap and can therefore be given in large amounts if a deficiency is possible. The daily requirements of water-soluble vitamins are given in Table 5.8.
Thiamin (vitamin B1)
Function
Thiamin is found in many foodstuffs, including cereals, grains, beans, nuts, as well as pork and duck. It is often added to food (e.g. in cereals) in developed countries. The dietary requirement (see Table 5.8) depends on energy intake, more being required if the diet is high in carbohydrates.
Thiamin deficiency
 as beriberi, where the only food consumed is polished rice
 in chronic alcohol-dependent patients who are consuming virtually no food at all
 in starved patients (e.g. with carcinoma of the stomach), and in severe prolonged hyperemesis gravidarum, anorexia nervosa and prolonged total starvation in healthy subjects (e.g. fasts for political reasons). It can also occur in patients given parenteral nutrition with little or no thiamine as large doses of glucose increase requirements of thiamin and can precipitate deficiency, e.g. during re-feeding.
Beriberi
 Dry beriberi usually presents insidiously with a symmetrical polyneuropathy. The initial symptoms are heaviness and stiffness of the legs, followed by weakness, numbness, and pins and needles. The ankle jerk reflexes are lost and eventually all the signs of polyneuropathy that may involve the trunk and arms are found (p. 1147). Cerebral involvement occurs, producing the picture of the Wernicke–Korsakoff syndrome (p. 1147). In endemic areas, mild symptoms and signs may be present for years without unduly affecting the patient.
 Wet beriberi causes oedema. Initially this is of the legs, but it can extend to involve the whole body, with ascites and pleural effusions. The peripheral oedema may mask the accompanying features of dry beriberi.
Treatment
Thiamin deficiency in people with alcohol dependence or acute illness
This syndrome, which consists of dementia, ataxia, varying ophthalmoplegia and nystagmus (see p. 1147), presents acutely and should be suspected in all heavy drinkers. If treated promptly it is reversible; if left it becomes irreversible. It is a major cause of dementia in the USA.
Riboflavin
 angular stomatitis or cheilosis (fissuring at the corners of the mouth)
 seborrhoeic dermatitis, particularly involving the face (around the nose) and the scrotum or vulva.
Riboflavin 5 mg daily can be tried for the above conditions, usually given as the vitamin B complex.
Niacin
Clinical features
 Dermatitis. In the areas of skin exposed to sunlight, initially there is redness followed by cracks with occasional ulceration. Chronic thickening, dryness and pigmentation develop. The lesions are always symmetrical and often affect the dorsal surfaces of the hands. The perianal skin and vulva are frequently involved. Casal’s necklace or collar is the term given to the skin lesion around the neck, which is confined to this area by the clothes worn.
 Diarrhoea. This is often a feature but constipation is occasionally seen. Other gastrointestinal manifestations include a painful, red, raw tongue, glossitis and angular stomatitis. Recurring mouth infections occur.
 Dementia. This occurs in chronic disease. In milder cases there are symptoms of depression, apathy and sometimes thought disorders. Tremor and an encephalopathy frequently occur. Hallucinations and acute psychosis are also seen with more severe cases.
Pellagra may also occur in the following circumstances:
 Isoniazid therapy can lead to a deficiency of vitamin B6, which is needed for the synthesis of nicotinamide from tryptophan. Vitamin B6 is now given concomitantly with isoniazid.
 In Hartnup’s disease, a rare inborn error, in which basic amino acids including tryptophan are not absorbed by the gut. There is also loss of this amino acid in the urine.
 In generalized malabsorption (rare).
 In alcohol-dependent patients who eat little.
 Very low protein diets given for renal disease or taken as a food fad.
 In the carcinoid syndrome and phaeochromocytomas, tryptophan metabolism is diverted away from the formation of nicotinamide to form amines.
Biotin and pantothenic acid
Pantothenic acid is widely distributed in all foods and deficiency in humans has not been described.
Vitamin C
Scurvy
In adults, the early symptoms of vitamin C deficiency may be nonspecific, with weakness and muscle pain. Other features are shown in Table 5.11. Parafollicular haemorrhages and corkscrew hairs occur. In infantile scurvy, there is irritability, painful legs, anaemia and characteristic subperiosteal haemorrhages, particularly into the ends of long bones.
Table 5.11 Clinical features of vitamin C deficiency (scurvy)
Vitamin B12 and folate
These are dealt with on page 381 and daily requirements are shown in Table 5.8.
Dietary antioxidants
Epidemiological studies
Dietary intake
 A high intake of fruits and vegetables has been linked to reduced risk of heart disease, cerebrovascular disease and total cardiovascular morbidity and mortality.
 A high intake of nuts (rich in vitamin E) and dietary components, e.g. red wine, onions, apples (rich in flavonoids), which are strong scavengers of free radicals, has also been linked to reduced risk of cardiovascular disease.
 The seasonal variation in cardiovascular disease, which is higher in winter, has been related to decreased intake of fresh fruit and vegetables in winter.
 The decline in cardiovascular disease in the USA since the 1950s has been associated with a simultaneous increase in the intake of fresh fruit and vegetables.
Status of antioxidant nutrients
Antioxidants, especially vitamin E, have been shown to prevent the initiation and progression of atherosclerotic disease in animals. They also reduce the oxidation of low-density lipoprotein (LDL) in the arterial wall in vitro. Oxidation of LDL is an initial event in the atherosclerotic process (p. 725). However, these epidemiological studies show an association rather than a causal link and RCTs comparing the antioxidant against a control group are necessary.
Randomized controlled trials (RCT) (see also p. 905). The results of such trials have been formally evaluated through a series of systematic reviews and meta-analyses.
 For primary or secondary prevention of cardiovascular disease, intervention with β-carotene, α-tocopherol (vitamin E) and ascorbic acid (vitamin C) has demonstrated no significant benefit.
 Vitamin E or β-carotene given in, e.g. stroke and fatal and non-fatal myocardial infarction, has also not yielded benefits.
 There is a report of increased risk of intracerebral and subarachnoid haemorrhage in healthy individuals receiving carotene and α-tocopherol.
 A meta-analysis has shown a small but significant overall increased risk of cardiovascular death and all-cause mortality in individuals treated with β-carotene (compared to the control group).
 An increased risk of developing lung cancer by administering large doses of β-carotene to subjects with a history of heavy smoking.
 Although administration of antioxidant nutrients has been proposed in a wide range of acute (e.g. critical illness, pancreatitis) and chronic diseases, the evidence base from RCTs is generally not strong.
 In some cases, improvement in indices of free radical damage had been demonstrated (e.g. in acute inflammatory conditions), but with little evidence of clinical benefit.
Homocysteine, cardiovascular disease and B vitamins
The circulating concentration of the amino acid homocysteine is an independent risk factor for cardiovascular disease (p. 728). A high concentration is related to ischaemic heart disease, stroke, thrombosis, pulmonary embolism, coronary artery stenosis, and heart failure. The strength of the association is similar to smoking or hyperlipidaemia.
 the direct damaging effects of homocysteine on endothelial cells of blood vessels
Homocysteine is not found in food, but results from metabolism within the body which depends on folic acid, vitamin B12 and pyridoxine (vitamin B6) (Fig. 5.7). Deficiency of one or more of these vitamins is common in the elderly, which would increase the concentration of homocysteine. If an elevated homocysteine concentration was causally linked to cardiovascular disease then it should be possible to lower the risk by administering one or more of these vitamins to lower the homocysteine concentration. However, several recent studies suggest that lowering homocysteine concentrations in this way does not reduce the risk of cardiovascular disease.
FURTHER READING
Clarke R, Halsey J, Lewington S et al. Effects of lowering homocysteine levels with B vitamins on cardiovascular disease, cancer, and cause-specific mortality: Meta-analysis of 8 randomized trials involving 37 485 individuals. Arch Intern Med 2010; 170:1622–1631.
Institute of Medicine. Dietary reference intakes for energy, carbohydrate, fiber, fat, fatty acids, protein, and amino acids. Washington DC: The National Academies Press; 2005.
Institute of Medicine. Dietary reference intakes for thiamin, riboflavin, niacin, vitamin B6, folate, vitamin B12, pantothenic acid, biotin, and choline. Washington DC: The National Academies Press; 2000.
Minerals
A number of minerals have been shown to be essential in animals, and an increasing number of deficiency syndromes are becoming recognized in humans. Long-term total parenteral nutrition allowed trace element deficiency to be studied in controlled conditions; now trace elements are always added to long-term parenteral nutrition regimens. It is highly probable that trace-element deficiency is also a frequent accompaniment of all PEM states, but this is difficult to study because of multiple deficiencies. Sodium, potassium, magnesium and chloride are discussed in Chapter 13. Reference nutrient intake (RNI) values are shown in Table 5.12.
Table 5.12 Daily reference nutrient intake (RNI) values for some elements
| Element | Daily RNI | Dietary sources |
|---|---|---|
|
Sodium |
1.6 g (70 mmol) |
Mostly in processed food (e.g. meat products, bread cereal) but added salt contributes |
|
Chloride |
2.5 g (70 mmol) |
As for sodium |
|
Potassium |
3.5 g (90 mmol) |
Vegetables, fruit, juices, meat and milk |
|
Calcium |
700 mg (17.5 mmol)a |
In many foodstuffs; two-thirds of intake comes from milk and milk products, and only 5% from vegetablesb |
|
Phosphate |
550 mg (17.5 mmol) |
All natural foods e.g. milk, meat, bread, cereals, |
|
Magnesium |
300 mg (12.3 mmol) for men |
Milk bread, cereal products, potatoes and other vegetables |
|
270 mg (10.9 mmol) for women |
||
|
Iron |
160 µmol (8.7 mg) for men |
Meat, bread, flour, cereal products, potatoes and vegetables |
|
260 µmol (14.8 mg) for women |
||
|
Copper |
1.2 mg (19 µmol) |
Shellfish, legumes, cereals and nuts |
|
Zinc |
9.5 mg (145 µmol) for men |
Widely available in food |
|
7 mg (110 µmol) for women |
||
|
Iodine |
140 µg (1.1 µmol) |
Milk, meat and seafoods |
|
Fluoride |
None |
Little fluoride in food except seafish and tea (tea provides 70% of daily intake) |
|
Selenium |
75 µg (0.9 µmol) for men |
Cereals, fish, meat, cheese, eggs, milk |
|
60 µg (0.8 µmol) for women |
a UK value; a substantially higher value is recommended in the USA.
b In the UK, most flour is fortified.
Iron
Iron deficiency (see also p. 379) is common worldwide, affecting both developing and developed countries. It is particularly prevalent in women of reproductive age. Dietary iron overload is seen in South African men who cook and brew in iron pots.
Zinc
Iodine
Iodine exists in foodstuffs as inorganic iodides which are efficiently absorbed. Iodine is a constituent of the thyroid hormones (p. 960).
Calcium
Calcium absorption (see also p. 513) from the gastrointestinal tract is vitamin D-dependent. Some 99% of body calcium is in the skeleton.
Phosphate
Phosphates (see also p. 519) are present in all natural foods, and dietary deficiency has not been described. Patients taking large amounts of aluminium hydroxide can, however, develop phosphate deficiency owing to binding in the gut lumen. It can also be seen in total parenteral nutrition. Symptoms include anorexia, weakness and osteoporosis.
Other trace elements
The possible significance of cadmium, chromium, cobalt, manganese, molybdenum, nickel and vanadium is shown in Table 5.13.
| Element | Deficiency |
|---|---|
|
Cadmium |
? |
|
Chromium |
Glucose intolerance |
|
Cobalt |
Anaemia (vitamin B12) |
|
Manganese |
Skin rash, ? osteoporosis,? mood |
|
Molybdenum |
? (case study involving parenteral nutrition) |
|
Nickel |
? Animals only |
|
Vanadium |
? |
FURTHER READING
Checkley W, West KP, Wise RA et al. Maternal vitamin supplementation and lung function in offspring. N Engl J Med 2010; 1784–1794.
Institute of Medicine. Dietary reference intakes for vitamin A, vitamin K, arsenic, chromium, copper, iodine, iron, manganese, molybdenum, silicon, vanadium, and zinc. Washington DC: Institute of Medicine; 2001.
Pearce SHS, Cheetam TD. Diagnosis and management of vitamin D deficiency. BMJ 2010; 340:141–147.
Pitta AG, Chung M, Trikalinos T et al. Systematic review: vitamin D and cardiometabolic outcomes. Ann Intern Med 2010; 152:307–314.
Nutrition and ageing
The ageing process
Molecular theories
 Gene regulation: ageing, for example, results from changes in expression of genes that regulate both development and ageing. An insulin-like signalling pathway has been linked to the lifespan of worms, flies and mice (activation of a transcription factor in response to reduced insulin-like signalling prolongs lifespan)
 Codon restriction: inadequate mRNA translation resulting from inadequate decoding of codons in mRNA
 Error catastrophe: errors in gene expression result in abnormal proteins
 Somatic mutation: cumulative molecular damage mainly to genetic material
 Dysdifferentiation: cumulative random molecular damage detrimentally affects gene expression.
Cellular theories
 Cellular senescence-telomere: an increase in senescent cells occurs from:
 Free radical: production of free radicals during oxidative metabolism, which damages fat, protein and DNA.
 Wear and tear: cumulative damage from normal injury/stress which is unable to repair itself.
 Apoptosis theory: programmed cell death due to genetic events.
Evolutionary theories
 Cumulative mutation: mutations that accumulate during a lifetime act in older age rather than during the active reproductive period (for which there is evolutionary selection), producing pathology and senescence. The theory was initially based on the observation that Huntington’s disease, a dominant lethal mutation which typically manifests itself between 35 and 55 years, allows affected individuals to reproduce.
 Disposable soma: the somatic body is maintained to ensure reproductive success, after which it is disposable. Factors that may enhance reproductive success may have detrimental effects on ageing – a possible example being androgen secretion, which may be beneficial to reproduction but potentially detrimental with development of prostatic cancer and cardiovascular disease in later life.
Nutritional components of theories of ageing
Several of the theories above have strong nutritional components. Disability and dependency in older humans are at least partly due to poor nutrition, and correction of deficiencies or nutrient imbalances can prevent the decline in function from falling below the disability threshold (Fig. 5.8). In this way, some loss of function may be prevented or reversed, especially if other measures, such as physical activity, which increases muscle mass and strength, are undertaken.
Early origins of health and disease in older adults
The extent to which these findings apply to humans is uncertain, and the mechanisms are poorly understood. Since relationships have been reported between cardiovascular disease in old age and growth in the first few years of life, as well as starvation during puberty, it is likely that cumulative environmental stresses, including nutritional stress, from the time of implantation of the fertilized egg, to fetal and postnatal growth and development, and into adult life, summate to produce an overall disease risk (Fig. 5.8).
Nutritional requirements in the elderly
These are qualitatively similar to the requirements of younger adults: the diet should contain approximately the same proportions of nutrients, and essential nutrients are still required. However, the RNIs stated earlier (p. 195) are intended for healthy people without disease; specific requirements in disease, which is common in older people, are less well-defined.
FURTHER READING
Artandi SE. Telomeres, telomerase, and human disease. N Engl J Med 2006; 355:1195–1197.
Cox LS, Faragher RG. From old organisms to new molecules: integrative biology and therapeutic targets in accelerated human ageing. Cell Mol Life Sci 2007; 64:2620–2641.
Flatt T, Schmidt PS. Integrating evolutionary and molecular genetics of aging. Biochim Biophys Acta 2009;1790:951–962.
Gluckman PD, Hanson MA, Cooper C. Effect of in utero and early life conditions on adult health and disease. N Engl J Med 2008; 359:61–73.
Rattan SI. Theories of biological aging: genes, proteins, and free radicals. Free Radic Res 2006; 40:1230–1238.
Salmon AB, Richardson A, Perez VI. Update on the oxidative stress theory of aging: does oxidative stress play a role in aging or healthy aging? Free Radic Biol Med 2010; 48:642–655.
Vina J, Borras C, Miquel J. Theories of ageing. IUBMB Life 2007; 59:249–254.
Obesity
Most patients suffer from simple obesity, but in certain conditions, obesity is an associated feature (Table 5.14). Even in the latter situation, the intake of calories must have exceeded energy expenditure over a prolonged period of time. Hormonal imbalance is often incriminated in women (e.g. postmenopause or when taking contraceptive pills), but most weight gain in such cases is usually small and due to water retention.
Table 5.14 Conditions in which obesity is an associated feature
Suggested mechanisms
Control of appetite
Following a meal, cholecystokinin (CCK), bombesin, glucagon-like peptide 1 (GLP-1), enterostatin, and somatostatin are released from the small intestine, and glucagon and insulin from the pancreas. All of these hormones have been implicated in the control of satiety. Centrally, the hypothalamus – particularly the lateral hypothalamic area, and paraventricular and arcuate nuclei – plays a key role in integrating signals involved in appetite and bodyweight regulation (Fig. 5.9). There are two main pathways in the arcuate nucleus (Fig. 5.9):
 The central appetite-stimulating (orexigenic) pathway in the ventromedial part of the arcuate nucleus, which expresses NPY (neuropeptide Y) and AgRP (agouti-pathway) related protein). Animal studies suggest that this pathway also decreases energy expenditure.
 The central appetite-suppressing (anorexigenic pathway or leptin-melanocortin pathway) in the dorsolateral part of the arcuate nucleus, which expresses POMC/CART (pro-opiomelanocortin/cocaine-and-amphetamine-regulated transcript). In this pathway, α-MSH (α-melanocyte-stimulating hormone), formed by cleavage of POMC by PC1 (prohormone convertase), exerts its appetite-suppressing effect via the Mc4R (melanocortin-4 receptors) in areas of the brain that regulate food intake and autonomic activity. Animal studies suggest that this pathway also increases energy expenditure.
 Peripheral appetite-suppressing signals: Leptin and insulin act centrally to activate the appetite-suppressing pathway (while also inhibiting the appetite-stimulating pathway). Since these hormones circulate in proportion to adipose tissue mass, they can be regarded as long-term signals, although they probably also modulate short-term signals (insulin also responds acutely to meal ingestion). Peptide YY (PYY) is produced by the L cells of the large bowel and distal small bowel in proportion to the energy ingested. The release of this rapidly responsive (short-acting) signal begins shortly after food intake, suggesting that the initial response involves neural pathways, before ingested nutrients reach the site of PYY production. PYY is thought to reduce appetite, at least partly through inhibition of the appetite-stimulating pathway (NPY/AgRP-expressing neurones). There are a large number of other peripheral appetite suppressing signals, including glucagon-like peptide 1 (GLP-1) and oxyntomodulin, which, like PYY, are produced by the gut in a nutrient dependent manner.
 Peripheral appetite-stimulating signals: Ghrelin is a 28-amino-acetylated peptide produced by the oxyntic cells of the fundus of the stomach. It is the first known gastrointestinal tract peptide that stimulates appetite by activating the central appetite-stimulating pathway. The circulatory concentration is high before a meal and is reduced rapidly by ingestion of a meal or glucose (cf. peptide YY, which increases after a meal). It may also act as a long-term signal, as its circulating concentration in weight-stable individuals is inversely related to BMI over a wide range (cf. insulin and leptin which are positively related to BMI, see below). It is also increased in several situations in which there is a negative energy balance, e.g. long-term exercise, very low-calorie diets, anorexia nervosa and both cancer and cardiac cachexia (an exception is vertical banded gastric bypass surgery, where its concentration is low rather than high). Recent studies suggest that another peptide, obestatin, produced by the same gene that encodes ghrelin, counteracts the increase in food intake induced by ghrelin.
 Another system, the endocannabinoid system, is involved in both central and peripheral regulation of food intake and control of energy balance. There are two receptors: endocannabinoid in the brain and CB2 in the periphery. CB1 receptors are located in the cerebral cortex, cerebellum and hippocampus.
Morbidity and mortality
Obese patients are at risk of early death, mainly from diabetes, coronary heart disease and cerebrovascular disease. The greater the obesity, the higher the morbidity and mortality rates. For example, men who are 10% overweight have a 13% increased risk of death, while the increase in mortality for those 20% overweight is 25%. The rise is less in women, and in men over 65, obesity is not an independent risk factor. Weight reduction reduces this mortality and therefore should be strongly encouraged. The benefits are probably greater in more obese subjects (Table 5.15).
Table 5.15 Potential benefits that may result from the loss of 10 kg in patients who are initially 100 kg and suffer from co-morbidities
|
Mortality |
20–25% fall in total mortality |
|
30–40% fall in diabetes-related deaths |
|
|
40–50% fall in obesity-related cancer deaths |
|
|
Blood pressure |
Fall of about 10 mmHg (systolic and diastolic) |
|
Diabetes |
Reduces risk of developing diabetes by >50% |
|
30–50% fall in fasting blood glucose |
|
|
15% fall in HbA1c |
|
|
Serum lipids |
10% fall in total cholesterol |
|
15% fall in LDL cholesterol |
|
|
30% fall in triglycerides |
|
|
8% increase in HDL cholesterol |
Clinical features
The degree of obesity can be assessed by comparison with tables of ideal weight for height, from the BMI (Box 5.6), and by measuring skinfold thickness. The latter should be measured over the middle of the triceps muscle; normal values are 20 mm in a man and 30 mm in a woman. A central distribution of body fat (a waist/hip circumference ratio of >1.0 in men and >0.9 in women) is associated with a higher risk of morbidity and mortality than is a more peripheral distribution of body fat (waist/hip ratio <0.85 in men and <0.75 in women). This is because fat located centrally, especially inside the abdomen, is more sensitive to lipolytic stimuli, with the result that the abnormalities in circulating lipids are more severe.
![]() Box 5.6
Box 5.6
Ranges of body mass index (BMI) used to classify degrees of overweight and associated risk of co-morbidities
| WHO classification | BMI (kg/m2) | Risk of co-morbidities |
|---|---|---|
|
Overweight |
25–30 |
Mildly increased |
|
Obese |
>30 |
|
|
Class I |
30–35 |
Moderate |
|
Class II |
35–40 |
Severe |
|
Class III |
>40 |
Very severe |
Table 5.16 shows the conditions and complications that are associated with obesity. The relationship between cardiovascular disease (hypertension or ischaemic heart disease), hyperlipidaemia, smoking, physical exercise and obesity is complex. Difficulties arise in interpreting mortality figures because of the number of factors involved. Many studies do not differentiate between the types of physical exercise taken or take into account the cuff-size artefact in the measurement of blood pressure (an artefact will occur if a large cuff is not used in patients with a large arm). Nevertheless, obesity almost certainly plays a part in all of these diseases and should be treated. An exception is that stopping smoking, even if accompanied by weight gain, is more beneficial than any of the other factors. Physical fitness is also helpful, and there is some evidence to suggest that a fit obese person may have similar or even lower cardiovascular risk than a leaner unfit person.
Table 5.16 Conditions and complications associated with obesity
Metabolic syndrome
There are two classification systems which are shown in Table 5.17. The differences are:
 A large waist is an absolute requirement for the International Diabetes Federation (IDF), but not in the ATP III NCEP.
 The IDF criteria use lower cut-off values for waist circumference (close to values of people with a BMI of 25 kg/m2) and lower fasting blood glucose concentrations.
Table 5.17 Classification systems for metabolic syndrome: ATP III of the National Cholesterol Education Programme (NCEP) and International Diabetes Federation (IDF)
| Risk factor | ATP III NCEP (any 3 of the 5 features) | International Diabetes Federation (large waist + any other 2 features) |
|---|---|---|
|
Waist circumference |
|
|
|
Men |
>102 cm (40 in) |
>94 cm (37 in) |
|
Women |
>88 cm (35 in) |
>80 cm (35 in) |
|
Triglycerides |
>1.7 mmol/L (150 mg/dL) |
1.7 mmol/L (150 mg/dL) |
|
HDL cholesterol |
|
|
|
Men |
<1.03 mmol/L (40 mg/dL) |
<1.03 mmol/L (40 mg/dL) |
|
Women |
<1.29 mmol/L (50 mg/dL) |
<1.29 mmol/L (50 mg/dL) |
|
Blood pressure |
>130/85 mmHg |
>130/85 mmHg |
|
Fasting glucose |
>5.6 mmol/L (100 mg/dL) |
>5.6 mmol/L (100 mg/dL) |
ATP III, Adult Treatment Panel 3.
The metabolic syndrome is a combination of risk factors (Table 5.17). Its overall role in the prediction of the risk of cardiovascular disease has been questioned as the sum of the combined risk factors in the syndrome does not offer more than the individual factors added together.
Treatment
Dietary control
Patients must understand the principles of energy intake and expenditure, and the best results are obtained in educated, well-motivated patients. Constant supervision by healthcare professionals, by close relatives or through membership of a slimming club helps to encourage compliance. It is essential to establish realistic aims. A 10% weight loss, which is regarded by some as a ‘success’ (see Table 5.15), is a realistic initial aim.
The diet should contain adequate amounts of protein, vitamins and trace elements (Box 5.7).
![]() Box 5.7
Box 5.7
Constituents of a diet for weight loss
 4200 kJ (1000 kcal) per day made up of >50 g protein, approximately 100 g of carbohydrate and 40 g of fat
 Carbohydrate should be in the form of complex carbohydrates such as vegetables and fruit rather than simple sugars
 Alcohol should be discouraged (contains 29 kJ/g (7 kcal/g)): it can be substituted for other foods in the diet, but it often reduces the willpower
 With a varied diet, vitamin and mineral intake will be adequate and supplements are not necessary.
 All low-calorie diets produce loss of bodyweight and fat, irrespective of dietary composition. Short-term weight loss is faster on low-carbohydrate diets, as a result of greater loss of body water, which is regained after the end of dietary therapy.
 Very low-fat diets are often low in vitamins E, B12, and zinc. Very low-carbohydrate diets may be nutritionally inadequate, and may lead to deficiencies.
 Low-fat diets decrease LDL triglycerides and increase HDL, whereas low-carbohydrate diets produce a greater decrease in HDL and triglyceride, with no change in LDL.
 There are some potential long-term concerns with low-carbohydrate diets (high in fat and protein), including increased risk of osteoporosis, renal stones and atheroma (due to high saturated fat, high trans fat and cholesterol and the lack of fruits, vegetables and whole grains) but long-term studies are lacking.
 Low-energy-density diets, often bulky and rich in fibre and complex carbohydrates, may be more satiating but they are often less palatable than high-energy-dense diets, which may affect long-term compliance.
 Liquids, e.g. soft drinks, appear to be less satiating than solid foods.
 A recent study has shown that Mediterranean and low-carbohydrate diets are as effective as a low-fat diet for weight loss.
Drug therapy
Centrally acting drugs
 Drugs acting on both serotoninergic and noradrenergic pathways, e.g. sibutramine (now withdrawn in Europe due to side-effects). Other drugs, such as lorcaserin, a selective 5-HT2C receptor agonist, are being evaluated.
 Cannabinoid-1 receptor blockers, e.g. rimonabant (now withdrawn due to depression/suicide risk), acting on the endocannabinoid system.
 Drugs acting on the noradrenergic pathways do suppress appetite but all have been withdrawn, at least in the UK, because of cardiovascular side-effects.
Peripherally acting drugs
 Orlistat is an inhibitor of pancreatic and gastric lipases. It reduces dietary fat absorption and aids weight loss. Weight regain occurs after the drug is stopped. It has been used continuously in a large-scale trial for up to 2 years. The patients complain of diarrhoea during treatment and to avoid this, take a low-fat diet resulting in weight loss.
 Glucagon-like peptide 1 (GLP-1) suppresses appetite and injections have been used to treat obesity (Fig. 5.9) and type 2 diabetes mellitus (p. 1011).
Surgical treatment
Surgery is used in some cases of morbid obesity (BMI >35 kg/m2) or patients with a BMI >30 kg/m2 and obesity related complications, after conventional medical treatments have failed. It can be used as a first-line option for individuals with a BMI >50 kg/m2. Fitness for surgery should be checked, especially in older people. A variety of gastrointestinal surgical procedures have been used. They fall into three main groups (Fig. 5.10):
Prevention
FURTHER READING
Eckel RH. Nonsurgical management of obesity in adults. N Engl J Med 2008; 358:1941–1950.
Eckel, RH, Alberti KG, Grund SM. The metabolic syndrome. Lancet 2010; 375:181–183.
Franks P, Hanson RL, Knowler WC et al. Childhood obesity, other cardiovascular risk factors, and premature death. N Engl J Med 2010; 362:485–493.
Han JC, Lawler DA, Kimm SY. Childhood obesity. Lancet 2010; 375:1737–1748.
Ingelfinger J. Bariatric surgery in adolescents. N Engl J Med 2011; 365:1365–1367.
Leff DR, Heath D. Surgery for obesity in adulthood. BMJ 2009: 339:b3402. doi: 10.1136/bmj.b3402.
National Institute for Health and Clinical Excellence. Obesity: the prevention, identification, assessment and management of overweight and obesity in adults and children. Clinical Guideline 43; 2006. Also at: www.nice.org.uk
Robinson MK. Surgical treatment of obesity – weighing the facts. N Engl J Med 2010; 361:520–521.
Shai I, Schwarz Fuchs D, Henkin Y et al. Weight loss with a low-carbohydrate, Mediterranean, or low-fat diet. N Engl J Med 2008; 359:229–241.
Tharakan G, Tan T, Bloom S. Emerging therapies in the treatment of ‘diabesity’: beyond GLP-1. Trends Pharmacol Sci 2011; 32:8–15.
Nutritional support in the hospital patient
Nutritional support is recognized as being necessary in many hospitalized patients. The pathophysiology and hallmarks of malnutrition have been described earlier (p. 200); here the forms of nutritional support that are available are discussed, along with special nutritional requirements in some diseases.
Principles
 all severely malnourished patients on admission to hospital
 moderately malnourished patients who, because of their physical illness, are not expected to eat for more than 3–5 days
 normally nourished patients expected not to eat for more than 5 days or to eat less than half their intake for more than 8–10 days.
Nutritional requirements for adults
 Water. Typical requirements are ~2–3 L/day. Increased requirements occur in patients with large-output fistulae, nasogastric aspirates and diarrhoea. Reduced requirements occur in patients with oedema, hepatic failure, renal failure (oliguric and not dialysed) and brain oedema.
 Energy. Typical requirements are ~7.5–10.0 MJ/day (1800–2400 kcal/day). Disease increases resting energy expenditure but decreases physical activity. Extra energy is given for repletion and reduced energy for obesity.
 Protein. Typically 10–15 g N/day (62–95 g protein/day) or 0.15–0.25 g N/kg per day (0.94–1.56 g protein/kg per day). Extra protein may be needed in severely catabolic conditions, such as extensive burns.
 Major minerals. Typical requirements for sodium and potassium are 60–100 mmol/day. Increased requirements occur in patients with gastrointestinal effluents. The excretion of these minerals in various effluents can provide an indication of the additional requirements (see Table 13.10). Low requirements may be necessary in those with fluid overload (or patients with hypernatraemia and hyperkalaemia). The requirements of calcium and magnesium are higher for enteral than for parenteral nutrition because only a proportion of these minerals is absorbed by the gut.
 Trace elements. For trace elements such as iodide, fluoride and selenium that are well absorbed, the requirements for enteral and parenteral nutrition are similar. For other trace elements, such as iron, zinc, manganese and chromium, the requirements for parenteral nutrition are substantially lower than for enteral nutrition (Fig. 5.11).
 Vitamins. Many vitamins are given in greater quantities in patients receiving parenteral nutrition than in those receiving enteral nutrition (Fig. 5.12). This is because patients on parenteral nutrition may have increased requirements, partly because of severe disease, partly because they may already have depleted pools of vitamins, and partly because some vitamins degrade during storage. Vitamin K is usually absent from parenteral nutrition regimens and therefore it may need to be administered separately.
Enteral nutrition (EN)
Feeds can be given by various routes:
 By mouth (food can be supplemented with solid or liquid supplements with multiple benefits).
 By fine-bore nasogastric tube (see Practical Box 5.1)
 Percutaneous endoscopic gastrostomy (PEG) is useful for patients who need enteral nutrition for a prolonged period (e.g. >30 days), such as those with swallowing problems following a head injury or in elderly people after a stroke. A catheter is placed percutaneously into the stomach under endoscopic control (Fig. 5.13).
 With needle catheter jejunostomy, a fine catheter is inserted into the jejunum at laparotomy and brought out through the abdominal wall.
![]() Practical Box 5.1
Practical Box 5.1
Enteral feeding via nasogastric tube
The procedure should be explained to the patient and consent taken.
Parenteral nutrition
Peripheral parenteral nutrition
 A peripheral cannula can be inserted into a mid-arm vein (20 cm) and can be left for up to 5 days.
 A longer (60 cm) peripherally inserted central catheter (PICC) inserted into an antecubital fossa vein has its distal end lying in a central vein; here there is less risk of thrombophlebitis and hyperosmolar solutions can be given. With careful management, PICCs can be used for up to about a month.
Parenteral nutrition via a central venous catheter (PN) (see Practical Box 5.2)
![]() Practical Box 5.2
Practical Box 5.2
Central catheter placement for parenteral nutrition
Give an explanation and obtain consent from the patient.
 The patient is placed supine with 5° of head-down tilt to avoid air embolism.
 The skin below the midpoint of the right clavicle is infiltrated with 1–2% lidocaine and a 1 cm skin incision is made.
 A 20-gauge needle on a syringe is inserted beneath the clavicle and first rib and angled towards the tip of a finger held in the suprasternal notch.
 When blood is aspirated freely, the needle is used as a guide to insert the cannula through the skin incision and into the subclavian vein.
 The catheter is advanced so that its tip lies in the distal part of the superior vena cava.
 A skin tunnel is created under local anaesthetic using an introducer inserted through a point about 10 cm below and medial to the incision and passed upwards to the incision.
 The proximal end of the catheter (with hub removed) is passed backwards through the introducer to emerge 10 cm below the clavicle, where it is sutured to the chest wall.
Nitrogen source
Most patients receive at least 11–15 g N/day, in the form of synthetic L-amino acids.
Electrolytes, vitamins and trace elements
Initially, the electrolyte status should be monitored on a daily basis and electrolyte solutions given as appropriate. Fat- and water-soluble vitamins and minerals including trace elements should be given routinely (see Figs 5.12, 5.13).
Administration and monitoring
Peripheral parenteral nutrition. Administered via 3-L bags over 24 hours, with the constituents being premixed under sterile conditions by the pharmacy. Table 5.19 shows the composition which provides 9 g of nitrogen and 1700 calories in 24 h.
|
Peripheral: all mixed in 3-L bags and infused over 24 hours |
||
|
Nitrogen |
L-amino acids 9 g/L |
1 L |
|
Energy |
Glucose 20% |
1 L |
|
Lipid 20% |
0.5 L |
|
|
+ Trace elements, electrolytes, and water-soluble and fat-soluble vitamins, heparin 1000 UL and hydrocortisone 100 mg; insulin is added if required. Nitrogen 9 g, non-protein calories 7206 kJ (1700 kcal) |
||
|
Central: all mixed in 3-L bags and infused over 24 hours |
||
|
Nitrogen |
L-amino acids 14 g/L |
1 L |
|
Energy |
Glucose 50% |
0.5 L |
|
Glucose 20% |
0.5 L |
|
|
+ Lipid 10% as either Intralipid or Lipofundin |
0.5 L |
|
|
Fractionated soya oil 100 g/L, Soya oil 50 g, medium-chain triglycerides 50 g/L |
||
|
+ Electrolytes, water-soluble vitamins, fat-soluble vitamins, trace elements, heparin and insulin may be added if required. Nitrogen 14 g, non-protein calories 9305 kJ (2250 kcal) |
||
Central venous PN regimen. Most hospitals now use premixed 3-L bags. A standard parenteral nutrition regimen which provides 14 g of nitrogen and 2250 calories over 24 hours is also given in Table 5.19. Monitoring includes:
 Blood tests. Daily plasma electrolytes and glucose (at least initially). Twice weekly FBC, liver biochemistry and function, calcium, phosphate, and magnesium, zinc and triglycerides weekly.
 Nutritional status. Weekly weight and skinfold thickness if appropriate callipers are available. Daily weight changes reflect changes in fluid balance.
 Nitrogen balance (p. 197) assessment, but this requires complete collections of urine.
Complications
 Mechanical: insertional trauma and catheter-related (see above)
 Metabolic, e.g. hyperglycaemia (insulin therapy is usually necessary), fluid and electrolyte disturbances, hypercalcaemia, nutrient deficiencies (if inadequately provided)
 Organ or tissue dysfunction, e.g. abnormal liver dysfunction, respiratory distress and metabolic bone disease
 Others, e.g. rare allergic reactions to lipid, and psychological disturbances.
Nutritional support in the home patient
 Supplements are generally of more value in patients with a BMI <20 kg/m2 and children with growth failure (weight for height <85% of ideal) than in those with better anthropometric indices. They are likely to be of little or no value in patients with little weight loss and a BMI >20 kg/m2. The supplemental energy intake in such subjects largely replaces oral food intake.
 Supplements may be of value in weight-losing patients (e.g. >10% weight loss compared to pre-illness) with a BMI >20 kg/m2, and in children with deteriorating growth performance without chronic protein-energy undernutrition.
 The functional benefits vary according to the patient group. In patients with chronic obstructive airways disease the observed functional benefits were increased respiratory muscle strength, increase in handgrip strength, and an increase in walking distance/duration of exercise. In the elderly the benefits were reduced number of falls, or increase in activities of daily living, and reduced pressure sore surface area. In patients with HIV/AIDS there were changes in immunological function and improved cognition. Patients with liver disease experienced a lower incidence of severe infections and had a lower frequency of hospitalization.
 Acceptability and compliance are likely to be better when a choice of supplements (of type, flavour, consistency) and schedule is decided in conjunction with the patient and/or carer. Changes in these may be necessary when there is a change in patterns of daily activities, disease status, and ‘taste fatigue’ with prolonged use of the same supplement.
 Nutritional counselling and monitoring are recommended before and after the start of supplements (see below).
Home parenteral nutrition
FURTHER READING
Kurien M, McAlindon ME, Westaby D et al. Percutaneous endoscopic gastrostomy (PEG) feeding. BMJ 2010; 340:1136.
Mehanna HM, Moledina J, Travis J. Re-feeding syndrome. BMJ 2008; 336:1495–1498.
National Institute for Health and Clinical Excellence. Nutrition support in adults. Clinical Guideline 32; 2006. Also at: www.nice.org.uk
Singer P, Berger MM, Van den Berghe G et al. ESPEN guidelines on parenteral nutrition: intensive care. Clin Nutr 2009; 28:387–400.
Smith T, Elia M. Artificial nutrition support in hospital: indications and complications. Clin Med 2006; 6:457–460.
Stewart JA, Nason DG, Smith N et al. A mixed bag. An Enquiry into the care of hospital patients receiving parenteral nutrition. A report by the National Confidential Enquiry into Patient Outcome and Death (NCEPOD). London: NCEPOD; 2010.
Stratton RJ, Green CJ, Elia M. Disease-related malnutrition. An evidence-based approach to treatment. Oxford: CABI Publishing (CAB International); 2003.
Zaloga GP. Parenteral nutrition in adult inpatients with functioning gastrointestinal tracts: assessment of outcomes. Lancet 2006; 367:1101–1111.
Food allergy and food intolerance
Food allergy
 Acute hypersensitivity. An example is urticaria, vomiting or diarrhoea after eating nuts, strawberries or shellfish. These IgE-mediated reactions do not usually produce clinical problems as the patients have already learned to avoid the suspected food. Inadvertent ingestion of the incriminating food can sometimes occur, leading to angioneurotic oedema (p. 1211).
 Eczema and asthma. These tend to affect young children and are often due to egg and are IgE mediated.
 Rhinitis and asthma. These have been produced by foods such as milk and chocolate, mainly in atopic subjects.
 Chronic urticaria. This has been treated successfully by an exclusion diet.
 Food-sensitive enteropathy. This may manifest itself as coeliac disease (gluten (wheat) sensitive enteropathy) and cow’s milk enteropathy (in infants), and is T-cell mediated.
Food intolerance
 Migraine. This sometimes follows the intake of foods such as chocolate, cheese and alcohol, which are rich in certain amines, such as tyramine. Patients on monoamine oxidase inhibitors, which are involved in the metabolism of these amines, are particularly vulnerable.
 Irritable bowel syndrome. In some patients, this seems to be related to ingestion of certain food items, such as wheat, but the mechanisms are not clearly defined.
 Chinese restaurant syndrome. Monosodium glutamate, a flavour enhancer used in cooking Chinese food, may produce dizziness, faintness, nausea, sweating and chest pains.
 Lactose intolerance. Patients develop abdominal bloating and diarrhoea following ingestion of lactose, which is present in milk (p. 264). This is probably the commonest form of food intolerance worldwide, and may be genetic in origin.
 Phenylketonuria. This can also be classified as a form of food intolerance, and is due to lack of phenylalanine hydroxylase, which is necessary for the metabolism of phenylalanine present in dietary protein.
A number of other inborn errors of metabolism can also be regarded as forms of food intolerance.
There is little or no evidence to suggest that diseases such as arthritis, behaviour and affective disorders and Crohn’s disease are due to ingestion of a particular food. Multiple vague symptoms such as tiredness or malaise are also not due to food allergy. Most of the patients in this group are suffering from a psychiatric disorder (p. 1185).
Management
 A careful history may help to delineate the causative agent, particularly when the effects are immediate.
 Skin-prick testing with allergen and measurement in the serum of antigen or antibodies have not correlated with symptoms and are usually misleading. ‘Fringe’ techniques such as hair analysis, although widely advertised, are of no value.
 Diagnostic exclusion diets are sometimes used, but they are time-consuming. They can occasionally be of value in identifying a particular food causing problems.
 Dietary challenge consists of the food and the test being given sublingually or by inhalation in an attempt to reproduce the symptoms. Again, this may be helpful in a few cases.
 Most people who have acute reactions to food realize it and stop the food, and do not require medical attention. In the remainder of patients, a small minority seem to be helped by modifying their diet, but there is no good scientific evidence to support these exclusion diets.
FURTHER READING
Hare ND, Fasano MB. Clinical manifestations of food allergy: differentiating true allergy from food intolerance. Postgrad Med 2008; 120:E01–E05.
Lack. G. Clincal practice. Food allergy. N Engl J Med 2008; 359:1252–1260.
Montalto M, Santoro L, D’Onofrio F et al. Adverse reactions to food: allergies and intolerances. Dig Dis 2008; 26:96–103.
Prescott SL, Bouygue GR, Videky D et al. Avoidance or exposure to foods in prevention and treatment of food allergy? Curr Opin Allergy Clin Immunol 2010; 10:258–266.
Alcohol
Although alcohol is not a nutrient, it is consumed in large quantities all over the world. In many countries, alcohol consumption is becoming a major medical and social problem (see p. 1163). It increases morbidity and mortality in a variety of ways, including effects on heart disease, stroke, cancers, liver and neurological/psychiatric problems, and it is associated with nutritional deficiencies and abnormal metabolism of drugs.
Ethanol (ethyl alcohol) is oxidized, in the steps shown in Box 5.8, to acetaldehyde. Acetaldehyde is then converted to acetate, 90% in the liver mitochondria. Acetate is released into the blood and oxidized by peripheral tissues to carbon dioxide and water.
![]() Box 5.8
Box 5.8
The main pathways of ethanol oxidization
Effects of excess alcohol consumption
Each unit of alcohol (defined as one half pint of normal beer, one single measure of spirit or one small glass of wine) contains 8 g of ethanol (Fig. 5.14). All the long-term effects of excess alcohol consumption are due to excess ethanol, irrespective of the type of alcoholic beverage, i.e. beer and spirits are no different in their long-term effects. Short-term effects, such as hangovers, depend on additional substances, particularly other alcohols such as isoamyl alcohol, which are known as congeners. Brandy and bourbon contain the highest percentage of congeners.
Thiamin deficiency contributes to both neurological (confusion, Wernicke–Korsakoff syndrome; see p. 1091) and some of the non-neurological manifestations (cardiomyopathy). Susceptibility to damage of different organs is variable and the figures given in Box 5.9 are given only as a guide to sensible drinking. Heavy persistent drinkers for many years are at greater risk than heavy sporadic drinkers.
![]() Box 5.9
Box 5.9
Guide to sensible drinking of alcohol
Remember
 Health can be damaged without being ‘drunk’. Regular heavy intake is more harmful than occasional binges
 Do not drink to ‘drown your sorrows’
 In the UK, the drink-before-driving limit of alcohol in the blood is 800 mg/L (80 mg%)
 One unit of alcohol is eliminated per hour, therefore spread drinking time
 Food decreases absorption and therefore results in a lower blood alcohol level
 4–5 units are sufficient to put the blood alcohol level over the legal driving limit in a 70 kg man (less in a lighter person).
Alcohol consumption in pregnancy
A summary of the physical effects of alcohol is given in Table 5.20. Details of these diseases are discussed in the relevant chapters. The effects of alcohol withdrawal are discussed on page 1183.
|
|
FURTHER READING
Braglehole R, Bonita R. Alcohol and global health priority. Lancet 2009; 373:2173–2174.
Casswell S, Thamarangsi T. Alchohol and global health 3. Reducing harm from alcohol: call to action. Lancet 2009; 373:2247–2257.
Guo R, Ren J. Alcohol and acetaldehyde in public health: from marvel to menace. International Journal of Environmental Research and Public Health 2010; 7:1285–1301.
Schuckit A. Alcohol use disorders. Lancet 2009; 373:492–501.
Ahima RS. Nutrition, obesity and metabolism. Gastroenterology (Special Issue). 2007;132:2085–2275.
Gibney MJ, Elia M, Ljungqvist O, et al. Clinical Nutrition. Oxford: Blackwell Science; 2006.
National Institute for Health and Clinical Excellence. Nutrition support in adults. Clinical Guideline. 2006;32. www.nice.org.uk
National Institute for Health and Clinical Excellence. Obesity: the prevention, identification, assessment and management of overweight and obesity in adults and children. Clinical Guideline 2006;43.www.nice.org.uk
UK information on food composition and dietary surveys.
http://www.who.int/nutgrowthdb/
WHO recommendations and intervention programmes for nutrient-related diseases.
http://www.ama-assn.org/ama/pub/category/10931.html
American Medical Association: Assessment and management of adult obesity
http://www.nhlbi.nih.gov/health/public/heart/obesity/lose_wt/profmats.htm
National Heart, Lung and Blood Institute: Aim for a healthy weight
Health Development Agency: Management of obesity and overweight
American Journal of Clinical Nutrition
International Journal of Obesity
http://www.nutritionsociety.org/publications/nutrition-society-journals/british-journal-of-nutrition
http://www.nutritioncare.org/wcontent.aspx?id=172

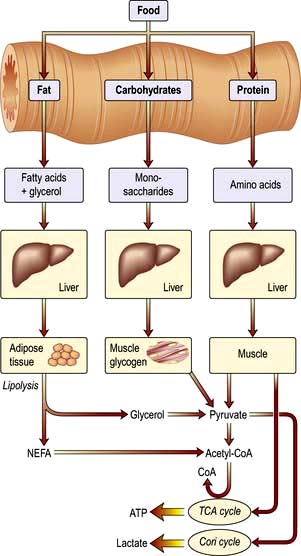


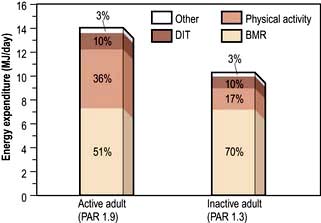


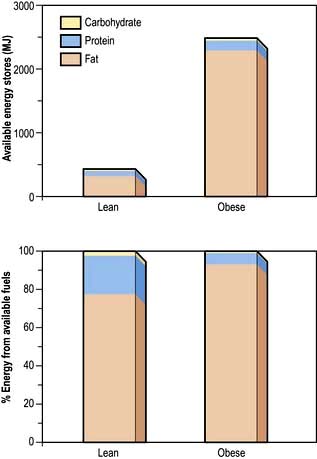


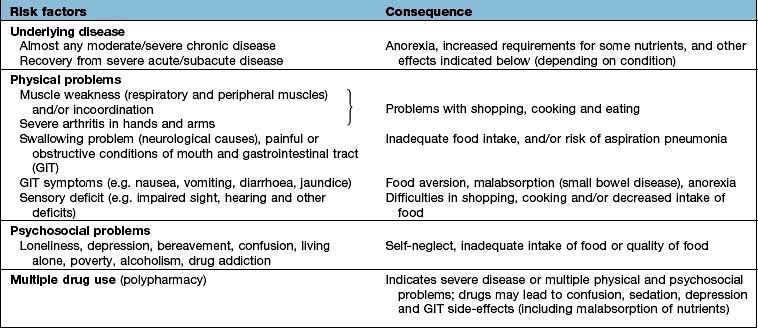
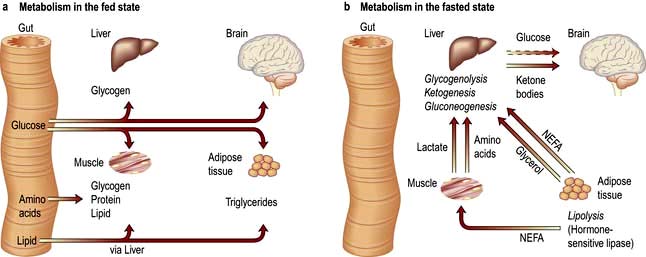
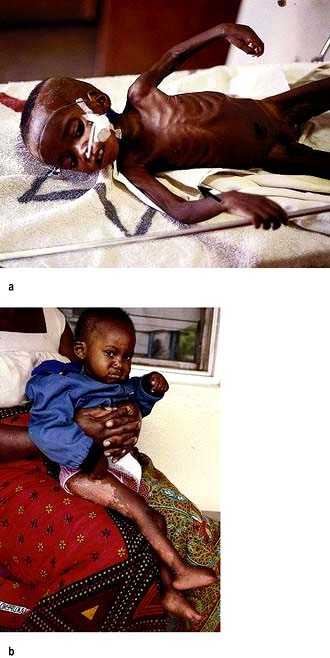


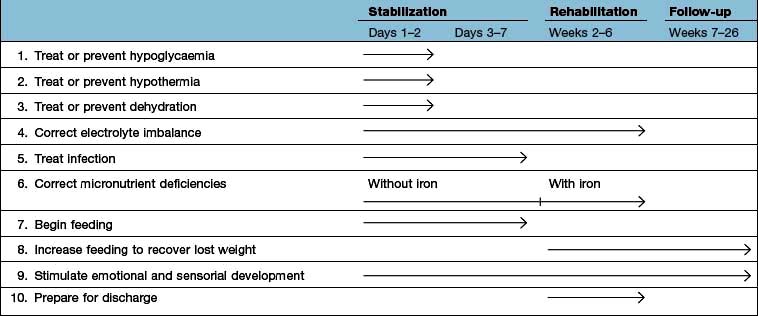


 corneal surface
 corneal surface


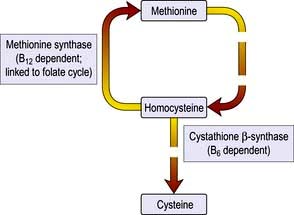

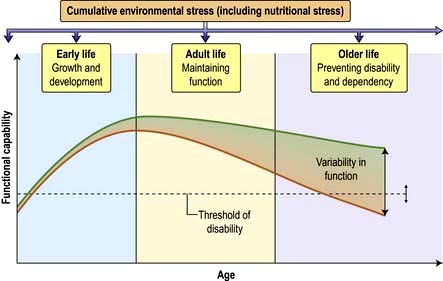
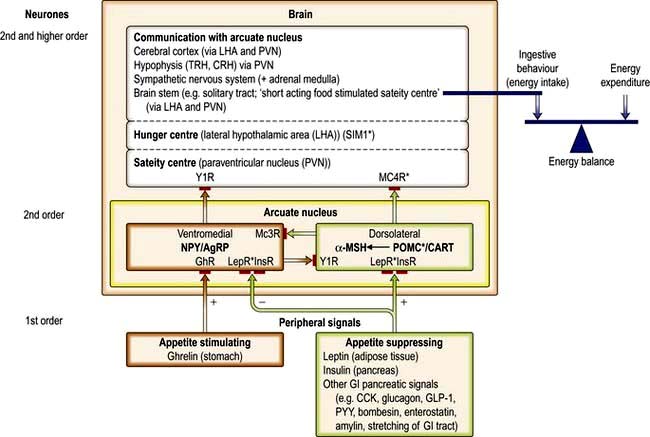


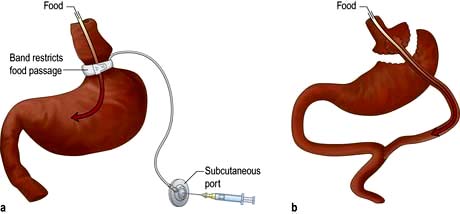
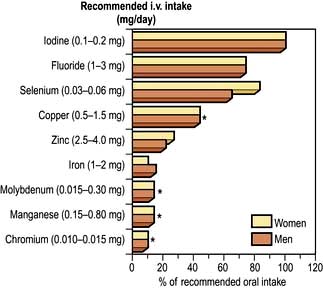
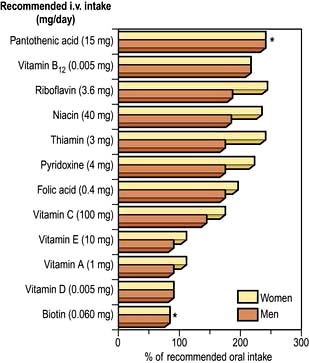


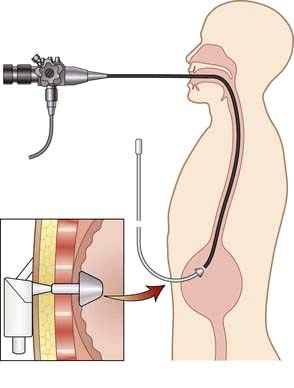


 [1]
[1]
 [2]
[2]

