[level-membership-for-cardiovascular-category]8
Now Test Yourself
You should now be able to recognize the common ECG patterns, and this final chapter contains ten 12-lead records for you to interpret. But do not forget two important things: first, an ECG comes from an individual patient and must be interpreted with the patient in mind, and second, there is little point in recording and interpreting an ECG unless you are prepared to take some action based on your findings. This is a theme developed in the companion to this book, 150 ECG Problems.
When reporting an ECG, remember:
2. A report has two parts – a description and an interpretation.
3. Look at all the leads, and describe the ECG in the same order every time: rate and rhythm
4. The range of normality, and especially which leads can show an inverted T wave in a normal ECG.
REMINDERS
WHAT TO LOOK FOR
• right axis deviation – QRS complex predominantly downward in lead I
• left axis deviation – QRS complex predominantly downward in leads II and III.
REMINDERS
CONDUCTION PROBLEMS
First degree block
Second degree block
• Wenckebach (Mobitz type 1): progressive PR lengthening then a nonconducted P wave, and then repetition of the cycle.
• Mobitz type 2: occasional nonconducted beats.
• 2:1 (or 3:1) block: two (or three) P waves per QRS complex, with a normal P wave rate.
Third degree (complete) block
• No relationship between P waves and QRS complexes.
• Usually, wide QRS complexes.
Right bundle branch block
• QRS complex duration greater than 120 ms.
• Usually, dominant R1 wave in lead V1.
• Inverted T waves in lead V1, and sometimes in leads V2-V3.
Left anterior hemiblock
• Marked left axis deviation – deep S waves in leads II and III, usually with a slightly wide QRS complex.
Left bundle branch block
• QRS complex duration greater than 120 ms.
• ‘M’ pattern in lead V6, and sometimes in leads V4-V5.
• Inverted T waves in leads I, VL, V5-V6 and, sometimes, V4.
Bifascicular block
REMINDERS
CAUSES OF AXIS DEVIATION
Right axis deviation
• Normal variant – tall thin people.
• Right ventricular hypertrophy.
• Lateral myocardial infarction (peri-infarction block).
• Dextrocardia or right/left arm lead switch.
Left axis deviation
REMINDERS
POSSIBLE IMPLICATIONS OF ECG PATTERNS
P:QRS apparently not 1:1
If you cannot see one P wave per QRS complex, consider the following:
• If the P wave is actually present but not easily visible, look particularly at leads II and Vv
• If the QRS complexes are irregular, the rhythm is probably atrial fibrillation, and what seem to be P waves actually are not.
• If the QRS complex rate is rapid and there are no P waves, a wide QRS complex indicates ventricular tachycardia, and a narrow QRS complex indicates atrioventricular nodal (junctional or AV nodal) re-entry tachycardia.
• If the QRS complex rate is low, it is probably an escape rhythm.
P:QRS more than 1:1
If you can see more P waves than QRS complexes, consider the following:
• If the P wave rate is 300/min, the rhythm is atrial flutter.
• If the P wave rate is 150-200/min and there are two P waves per QRS complex, the rhythm is atrial tachycardia with block.
• If the P wave rate is normal (i.e. 60-100/min) and there is 2:1 conduction, the rhythm is sinus with second degree block.
• If the PR interval appears to be different with each beat, complete (third degree) heart block is probably present.
Wide QRS complexes (greater than 120 ms)
Wide QRS complexes are characteristic of:
Q waves
• Small (septal) Q waves are normal in leads I, VL and V6.
• A Q wave in lead III but not in VF is a normal variant.
• Q waves probably indicate infarction if present in more than one lead, are longer than 40 ms in duration and are deeper than 2 mm.
• Q waves in lead III but not in VF, plus right axis deviation, may indicate pulmonary embolism.
• The leads showing Q waves indicate the site of an infarction.
ST segment depression
T wave inversion
ECGs WITH CLINICAL SCENARIOS
The following ECGs. (1–10) are in no particular sequence, and similar ECGs have been described earlier in this book. With each there is a short clinical scenario, and their descriptions and interpretations commence on p. 185.
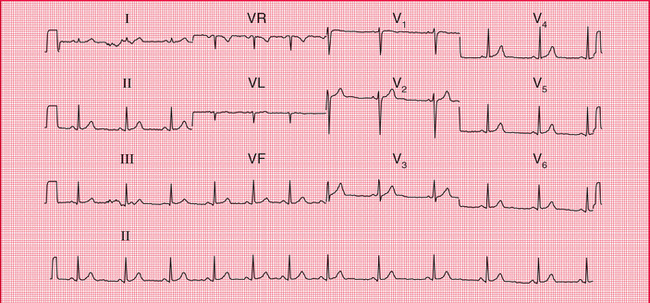
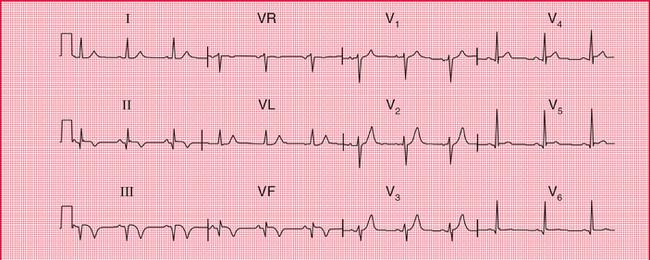
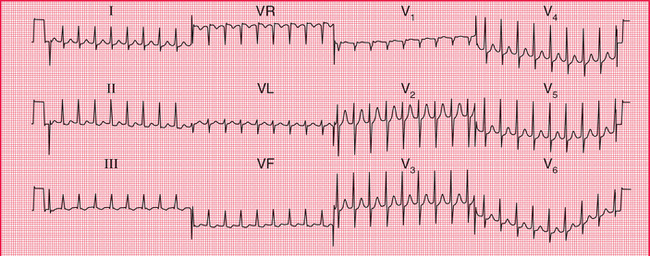
ECG 1 ECG from a 20-year-old female student with nonspecific chest pain; no abnormalities on examination
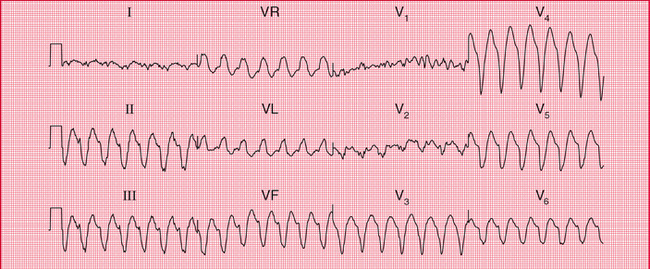
ECG 4 ECG from a man in a CCU with a myocardial infarction, who suddenly became breathless with more chest pain
ECG DESCRIPTIONS AND INTERPRETATIONS
ECG 1
• Sinus rhythm; the rhythm strip (lead II) shows sinus arrhythmia
• The heart rate change (most obvious in leads VF and V3) is due to sinus arrhythmia
• QRS complex duration 80 ms, normal height
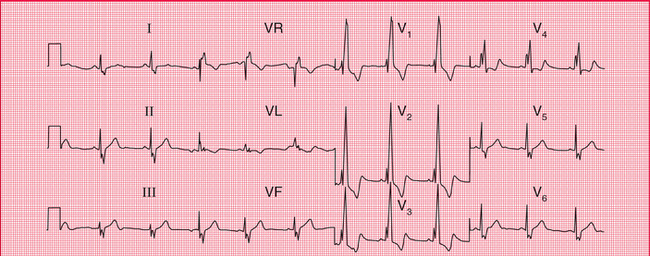
ECG 2
Interpretation of the ECG
There is no problem with conduction between the atria and the ventricles because the PR interval is normal and constant. The prolonged QRS complex duration shows that there is conduction delay within the ventricles. The RSR1 pattern in lead V^ and the deep and wide S wave in lead V6 (see the extracts from the traces, below) are characteristic of right bundle branch block (RBBB).
 For more on congenital heart disease, pp. 320–326
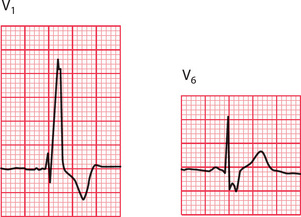
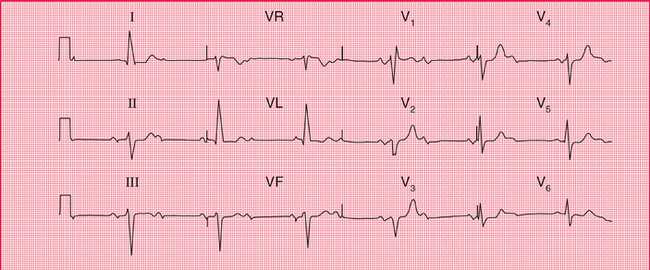
ECG 3
• Alternate conducted and nonconducted beats
• Normal PR interval in the conducted beats
• Left axis deviation (deep S waves in leads II and III)
• Wide QRS complex (duration 160 ms)
• Note: the sharp spikes are due to lead changes, not to a pacemeaker.
Clinical management
This patient clearly has severe disease of her conduction system. Both bundle branches are affected, and the second degree block probably results from disease in the His bundle. The attacks of dizziness may be due to further slowing of the heart rate with the same rhythm, or may be due to intermittent complete heart block (Stokes-Adams attacks). This could be investigated with a 24-h ambulatory ECG recording, but this is not really necessary as she needs an immediate permanent pacemaker.
 For more on pacemakers, see pp. 187–206
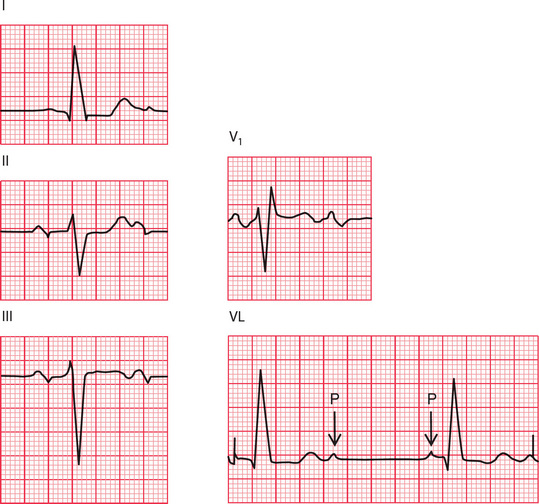
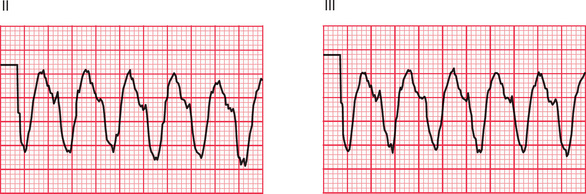
ECG 4
 For more on differentiation of broad complex tachycardias, see p. 126
ECG 5
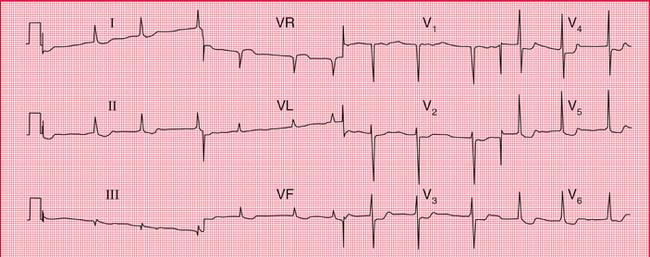
Interpretation of the ECG
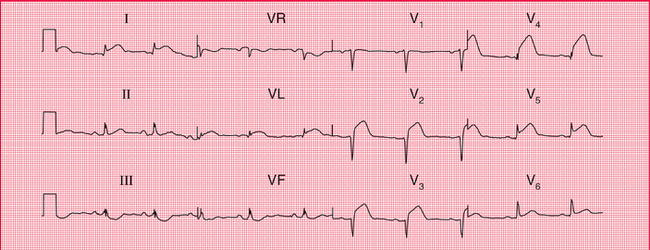
The Q waves in leads III and VF, together with the inverted T waves in those leads (see the extract from the trace, below), indicate an inferior myocardial infarction. Since the ST segment is virtually isoelectric (i.e. at the baseline, and not elevated) the infarction is ‘old’. The ECG can show this pattern at any time after the 24 h following the infarction, so timing the event is not possible from the ECG.
 For more on myocardial infarction, see p. 212
ECG 6
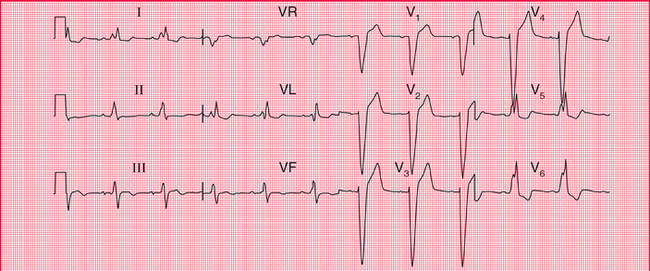
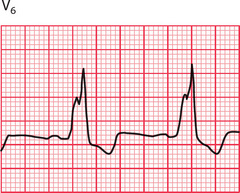
Interpretation of the ECG
The rhythm and PR interval are normal but the wide QRS complexes show that there is a conduction delay within the ventricles. The ‘M’ pattern, best seen in the lateral leads (see the extract from lead V6, above) shows that this is left bundle branch block (LBBB). In LBBB the T waves are usually inverted in the lateral leads, and have no further significance. In the presence of LBBB the ECG cannot be interpreted any further, so it is not possible to comment on the presence or absence of ischaemia.
 For more on the ECG in patients with dizziness, see Ch. 2
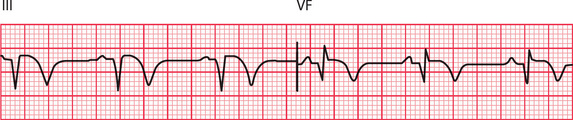
 For more on electrolyte abnormalities, see p. 331
ECG 7
Clinical management
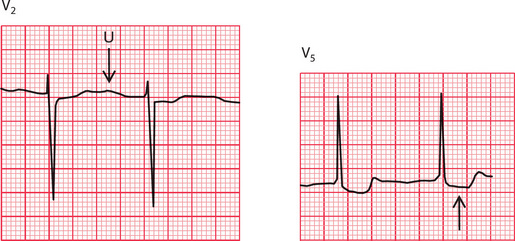
If this patient who is taking digoxin feels sick, she is probably suffering from digoxin toxicity, and hypokalaemia may be the main cause of this. Hypokalaemia is likely to occur if a patient with heart failure is given a loop diuretic without either a potassium-retaining diuretic or potassium supplements. The serum potassium level must be checked urgently, and appropriate action taken.
ECG 8
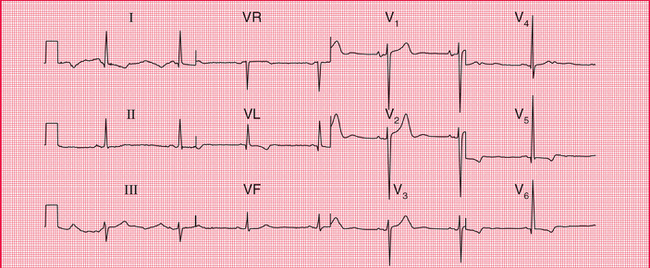
• Tall R wave in lead V5 and deep S wave in lead V2
• Small (septal) Q wave in leads I, VL and V5-V6
 For more on normal variants of the ECG, see Ch. 1
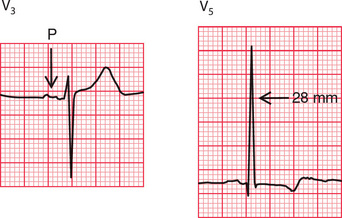
Interpretation of the ECG
The bifid P waves, best seen in lead V3, indicate left atrial hypertrophy (see the extracts from the trace, p. 192). The combined height of the R wave in lead V5 plus the depth of the S wave in lead V2 is 58 mm, so there are ‘voltage criteria’ for left ventricular hypertrophy. The inverted T waves in the lateral leads confirm severe left ventricular hypertrophy. The Q waves are small and narrow, and are therefore septal in origin and do not indicate an old infarction.
If you needed help with this one, re-read pp. 90–91.
 For more on diagnosis of left ventricular hypertrophy, see pp. 295–303
ECG 9
• Narrow QRS complexes (duration less than 120 ms)
• ST segments with a little depression in leads II, III and VF
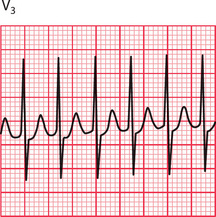
Clinical management
This rhythm can often be terminated by carotid sinus pressure, or by the Valsalva manoeuvre. Failing that, it will usually respond to intravenous adenosine. DC cardioversion should be considered for any patient with tachycardia that is compromising the circulation. The best way of preventing the attacks depends on their frequency and severity. An electrophysiological study, with a view to possible ablation of an abnormal conducting pathway, should be considered.
ECG 10
• Small R waves in leads V1-V2
• Very small R wave in lead V3
 For more on electrophysiology and ablation, see pp. 155–162
 For more on myocardial infarction, see pp. 214–246
 If you find testing yourself helpful, try 150 ECG Problems
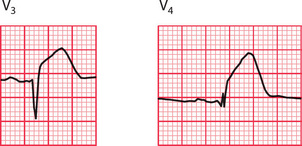
[/level-membership-for-cardiovascular-category][not-level-membership-for-cardiovascular-category]8
Now Test Yourself
You should now be able to recognize the common ECG patterns, and this final chapter contains ten 12-lead records for you to interpret. But do not forget two important things: first, an ECG comes from an individual patient and must be interpreted with the patient in mind, and second, there is little point in recording and interpreting an ECG unless you are prepared to take some action based on your findings. This is a theme developed in the companion to this book, 150 ECG Problems.
When reporting an ECG, remember:
2. A report has two parts – a description and an interpretation.
3. Look at all the leads, and describe the ECG in the same order every time: rate and rhythm
4. The range of normality, and especially which leads can show an inverted T wave in a normal ECG.
REMINDERS
WHAT TO LOOK FOR
• right axis deviation – QRS complex predominantly downward in lead I
• left axis deviation – QRS complex predominantly downward in leads II and III.
REMINDERS
CONDUCTION PROBLEMS
First degree block
Second degree block
• Wenckebach (Mobitz type 1): progressive PR lengthening then a nonconducted P wave, and then repetition of the cycle.
• Mobitz type 2: occasional nonconducted beats.
• 2:1 (or 3:1) block: two (or three) P waves per QRS complex, with a normal P wave rate.
Third degree (complete) block
• No relationship between P waves and QRS complexes.
• Usually, wide QRS complexes.
Right bundle branch block
• QRS complex duration greater than 120 ms.
• Usually, dominant R1 wave in lead V1.
• Inverted T waves in lead V1, and sometimes in leads V2-V3.
Left anterior hemiblock
• Marked left axis deviation – deep S waves in leads II and III, usually with a slightly wide QRS complex.
Left bundle branch block
• QRS complex duration greater than 120 ms.
• ‘M’ pattern in lead V6, and sometimes in leads V4-V5.
• Inverted T waves in leads I, VL, V5-V6 and, sometimes, V4.
Bifascicular block
REMINDERS
CAUSES OF AXIS DEVIATION
Right axis deviation
• Normal variant – tall thin people.
• Right ventricular hypertrophy.
• Lateral myocardial infarction (peri-infarction block).
• Dextrocardia or right/left arm lead switch.
Left axis deviation
REMINDERS
POSSIBLE IMPLICATIONS OF ECG PATTERNS
P:QRS apparently not 1:1
If you cannot see one P wave per QRS complex, consider the following:
• If the P wave is actually present but not easily visible, look particularly at leads II and Vv
• If the QRS complexes are irregular, the rhythm is probably atrial fibrillation, and what seem to be P waves actually are not.
• If the QRS complex rate is rapid and there are no P waves, a wide QRS complex indicates ventricular tachycardia, and a narrow QRS complex indicates atrioventricular nodal (junctional or AV nodal) re-entry tachycardia.
• If the QRS complex rate is low, it is probably an escape rhythm.
P:QRS more than 1:1
If you can see more P waves than QRS complexes, consider the following:
• If the P wave rate is 300/min, the rhythm is atrial flutter.
• If the P wave rate is 150-200/min and there are two P waves per QRS complex, the rhythm is atrial tachycardia with block.
• If the P wave rate is normal (i.e. 60-100/min) and there is 2:1 conduction, the rhythm is sinus with second degree block.
• If the PR interval appears to be different with each beat, complete (third degree) heart block is probably present.
Wide QRS complexes (greater than 120 ms)
Wide QRS complexes are characteristic of:
Q waves
• Small (septal) Q waves are normal in leads I, VL and V6.
• A Q wave in lead III but not in VF is a normal variant.
• Q waves probably indicate infarction if present in more than one lead, are longer than 40 ms in duration and are deeper than 2 mm.
• Q waves in lead III but not in VF, plus right axis deviation, may indicate pulmonary embolism.
• The leads showing Q waves indicate the site of an infarction.
ST segment depression
T wave inversion
• Normal in leads III, VR and V-,; and in V2-V3 in black people.
[/not-level-membership-for-cardiovascular-category]
