[level-membership-for-cardiovascular-category]
Chapter 5 Normal Mitral Valve Anatomy and Measurements
The complexity of the mitral valve is such that two-dimensional (2D) imaging does not adequately describe its anatomy and function. Indeed, the mitral valve apparatus is a dynamic three-dimensional (3D) structure composed of the saddle-shaped annulus; two asymmetric leaflets; multiple chordae tendineae of various lengths, thicknesses, and points of attachment; the left ventricular wall and the attached papillary muscles; and parts of the left atrium (Figure 5-1). During normal function, this array of parts constantly shifts in a complex but defined pattern. Normal alignment of all aspects of this biologic machine is required to avoid dysfunction. Therefore, full understanding of the mitral valve anatomy is not ascertained without 3D imaging. Real-time 3D echocardiography (RT3DE) gives echocardiographers a rapid and easily accessible method of identifying the entire mitral valve apparatus in most patients. As a prominent structure in the posterior left heart, the mitral valve often can be displayed in 3D using either a transthoracic approach or a transesophageal approach. Furthermore, detailed volumetric and positional analysis of the various mitral valve components often is possible (Table 5-1). RT3DE, however, is a novel modality, and its use in mastering the analysis of the intricate mitral valve requires a substantial time commitment. This chapter highlights the use of RT3DE in imaging the normal mitral valve, demonstrating usual transthoracic and transesophageal views for each of its components. It also provides an overview of typical 3D quantitative analyses of the size and position of the mitral valve structures.
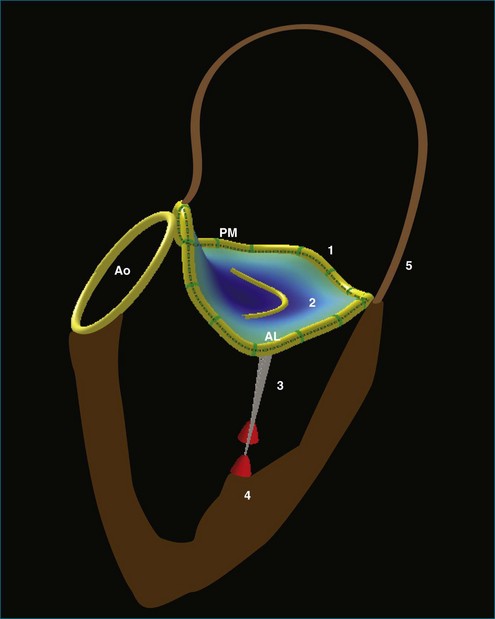
Table 5-1 Key Normal Measurements Obtained by Real-Time Three-Dimensional Echocardiography for Each Mitral Valve Structure
| Key Measurements | Normal Values | Reference |
|---|---|---|
| Mitral Valve Annulus | ||
| Anteroposterior dimension | 30.8 ± 4.4 mm | Sonne et al7 |
| 24 ± 1 mm | Kwan et al41 | |
| Commissural dimension | 35.1 ± 4.9 mm | Sonne et al7 |
| 28 ± 1 mm | Kwan et al41 | |
| Circumference | 10.5 ± 1.4 mm | Sonne et al7 |
| 10.0 ± 0.8 mm | Watanabe et al40 | |
| Height | 4.3 ± 2.1 mm | Sonne et al7 |
| 3.0 ± 1.0 mm | Flachskampf et al12 | |
| 4.5 ± 1.1 mm | Watanabe et al40 | |
| Area/BSA (end diastole) | 4.6 ± 1.3 cm2/m2 | Qin et al10 |
| 5.9 ± 1.2 cm2/m2 | Flachskampf et al12 | |
| Area/BSA (mid systole) | 5.1 ± 0.8 cm2/m2 | Sonne et al7 |
| Area/BSA (end systole) | 3.8 ± 1.1 cm2/m2 | Qin et al10 |
| Area change | 23.8% ± 5.1% | Flachskampf et al12 |
| 15% ± 16% | Qin et al10 | |
| Linear systolic motion | 16 ± 3 mm | Qin et al10 |
| 10 ± 3 mm | Flachskampf et al12 | |
| Mitral Valve Leaflets | ||
| Volume | 4.5 ± 0.7 cm3 | Limbu et al28 |
| Maximum tenting height | 5.3 ± 2.4 mm | Sonne et al7 |
| 3.1 ± 1.2 mm | Watanabe et al40 | |
| 5 ± 0.2 mm | Kalyanasundaram et al5 | |
| Mean tenting height | 1.9 ± 1.5 mm | Sonne et al7 |
| 0.7 ± 0.5 mm | Watanabe et al40 | |
| Tenting volume | 1.5 ± 0.9 cm3 | Sonne et al7 |
| 0.45 ± 0.29 cm3 | Watanabe et al40 | |
| Papillary Muscles (Indexed to BSA) | ||
| AL papillary to annular distance | 21.0 ± 5.8 mm/m2 | Sonne et al7 |
| PM papillary to annular distance | 22.3 ± 5.6 mm/m2 | Sonne et al7 |
| Interpapillary muscle angle | 17.6 ± 9.1 degrees/m2 | Sonne et al7 |
| Interpapillary distance | 10.5 ± 3.3 mm/m2 | Sonne et al7 |
| Left Ventricle | ||
| End-systolic volume | 43.7 ± 10.7 mL | Chukwu et al56 |
| 59 ± 18 mL | Corsi et al69 | |
| 43 ± 18 mL | Zeidan et al70 | |
| 47 ± 6 mL | Nosir et al71 | |
| End-diastolic volume | 115 ± 22.6 mL | Chukwu et al56 |
| 143 ± 30 mL | Corsi et al69 | |
| 108 ± 32 mL | Zeidan et al70 | |
| 113 ± 16 mL | Nosir et al71 | |
| Left Atrium | ||
| End-diastolic volume | 48.9 ± 25.1 cm3 | Azar et al68 |
| End-systolic volume | 62.3 ± 17.2 cm3 | Azar et al68 |
In some cases, values vary due to technique and studied population.
AL, anterolateral; BSA, body surface area; PM, posteromedial.
Mitral Valve Annulus
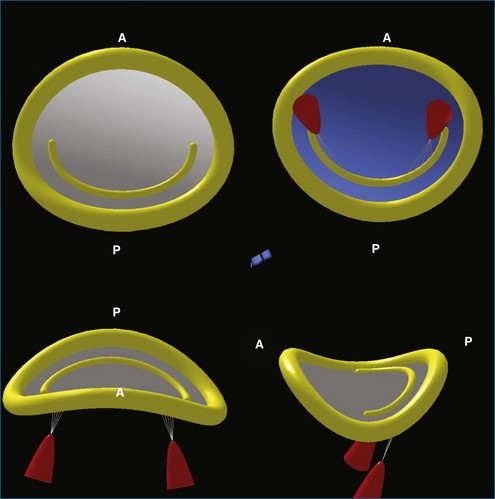
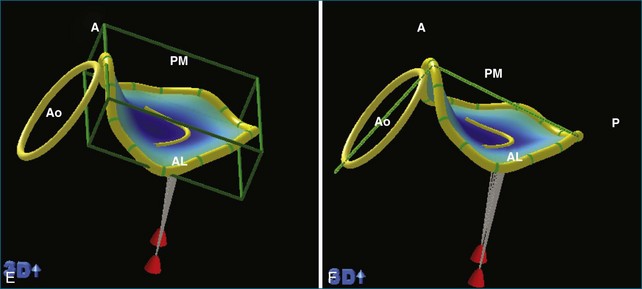
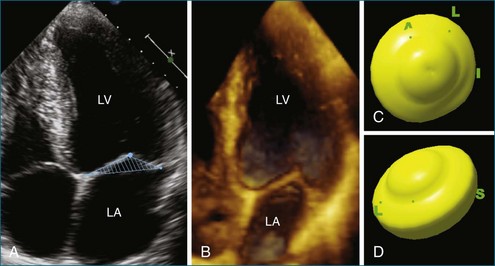
3DE has increased the understanding of the anatomy of the mitral valve annulus more than that of any other structure in the heart. 3D reconstructions identified the mitral valve annulus as a hyperbolic paraboloid or a saddle-shaped structure with curved planes parallel to the anteroposterior axis opening upward and orthogonal curved planes that open downward (Figure 5-2).1 This complex shape is not appreciated on 2D imaging, which tends to simplify the annulus as a planar ring. In fact, the anterior and posterior portions of the mitral valve annulus are about 5 mm higher than the medial and lateral commissural points.1 This height, along with the commissural diameter (the distance between the two low points) and the anteroposterior diameter (the distance between the two high points), can be easily measured with 3D imaging. The nonplanar shape of the mitral valve annulus is very important in reducing leaflet stress, which is increased when the annulus flattens.2 As such, the hyperbolic paraboloid annular shape with a height/commissural width ratio of 15% to 20% is preserved in many mammalian species, including humans.2–4
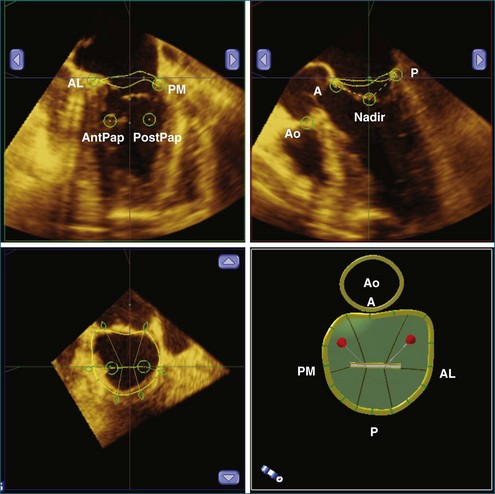
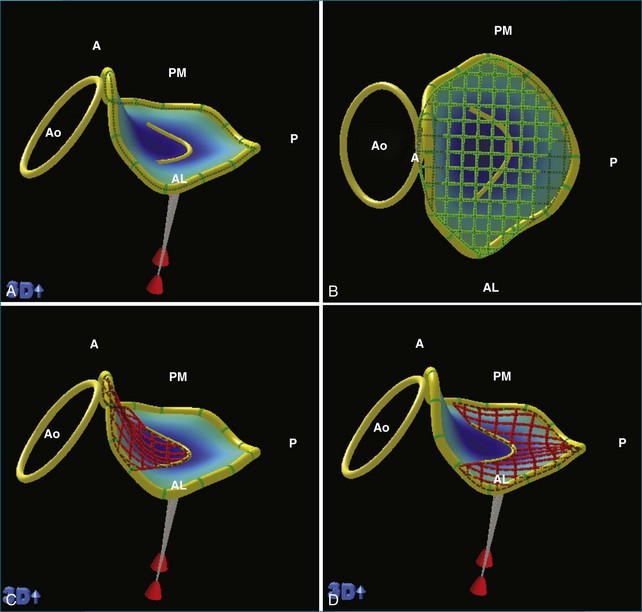
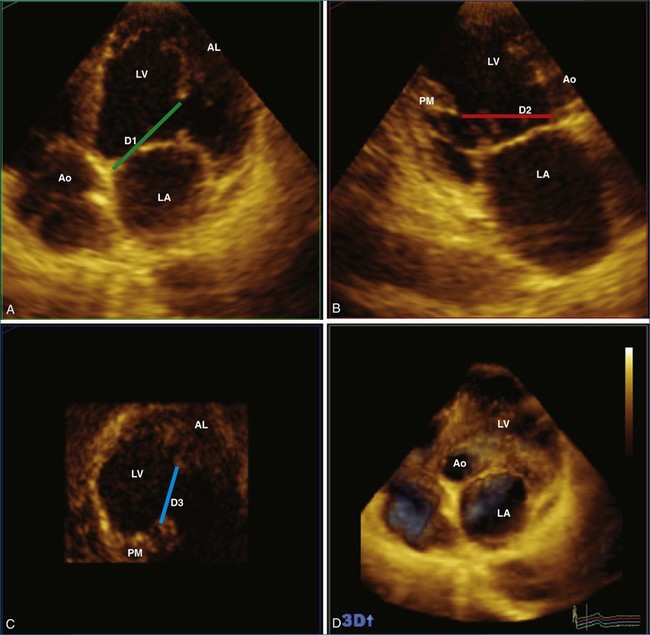
RT3DE is fundamental to clarifying annular geometry. In fact, obtaining accurate annular dimensions is best done with 3D datasets because 2DE underestimates these values by 6% to 14%.5 The mitral valve annulus is best seen using the large-sector (3D full volume) and wide-sector focused (3D zoom) formats. In particular, computer remodeling from large-sector datasets can quickly measure and display these changes without requiring the time-consuming reconstructions from multiple 2D images. 3D volume data can be obtained from either transthoracic or transesophageal exams. These models are obtained offline by tracing the mitral valve annulus contours in relation to other structures (such as the papillary muscles and aortic valve) in several 3D views (Figure 5-3). From these computer renditions, several annular dimensions, including circumference, anteroposterior (high-point) dimension, commissural (low-point) dimension, height, and annular area, can be measured (Figure 5-4).6
Recognizing the mitral valve annulus as a nonplanar structure is very important to understanding mitral valve function. For example, the complex shape of the mitral valve annulus has led to the overdiagnosis of mitral valve prolapse with 2DE. In certain 2D views, particularly the apical four-chamber view, which shows the mitral valve annulus in mediolateral directions, the leaflets appear to be on the atrial side of the mitral valve annulus, when, in fact, they are still inferior to the high anterior and posterior points. In 2DE imaging without fully realizing the nonplanarity of the mitral valve annulus, this normal anatomy can be mischaracterized as mitral valve prolapse.1
RT3DE has also shown that annular area significantly depends on body size and height.7 The normal diastolic mitral valve area (which is a projection onto the least squares plane) is 5 to 6.5 cm2 (indexed to body service area).8 The mitral valve annulus, however, is a dynamic structure whose complex motion throughout the cardiac cycle has not been fully ascertained.9–11 On the basis of early studies in 3DE from 2D renditions, it was believed that the mitral valve area decreases during systole by up to 24%, which is thought to occur as the anterior and lateral high points move closer together, increasing the height and eccentricity of the annulus.8,12 In addition to a decrease in annular area, there is a significant apical displacement of the annulus during systole, with an average annular motion of 16 ± 3 mm in normal hearts.10
Recent investigations using RT3DE with volumetric reconstructions have further characterized this motion in both normal ventricles and those with cardiomyopathy. In disease states, the shape and dynamic function of the mitral valve can change dramatically. For example, in dilated cardiomyopathy, especially with functional mitral regurgitation, the annulus flattens, dilates, and becomes more circular.8 These annuli also demonstrate less dynamic variability. During systole, they may have less change in height and diameter, leading to a smaller change in the projected valve area.12,13 Most significantly, those with cardiomyopathy have less apical excursion during systole. In fact, the degree of annular displacement correlates well with ejection fraction; a linear motion less than 12 mm accurately identifies those with an ejection fraction less than 50%.10
Mitral Valve Leaflets
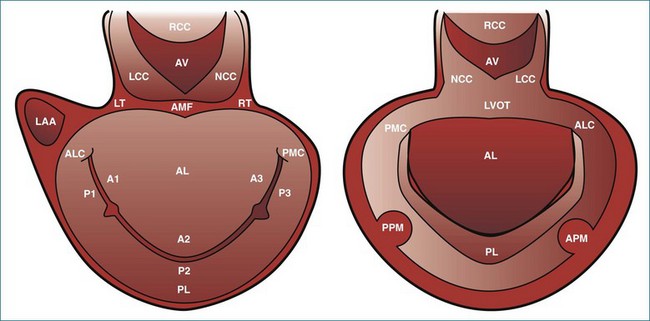
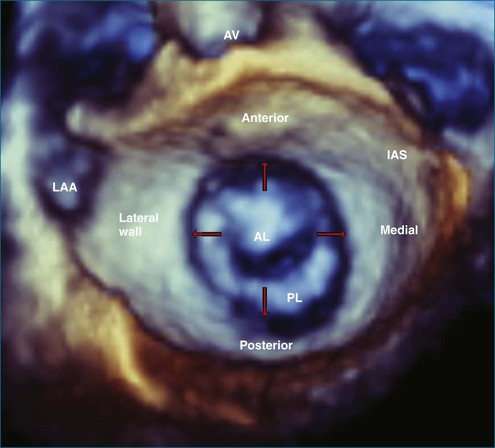
Like the annulus, the attached mitral valve leaflets are 3D dynamic structures. The anterior leaflet covers two thirds of the orifice and is attached to the part of anterior annulus adjacent to the aortic valve near the right fibrous trigone, aortic-mitral fibrosa, and left fibrous trigone (Figure 5-5). The posterior leaflet, although smaller, covering only one third of the mitral orifice, is semicircular in shape and borders most of the annulus from one commissure to the other.6 Figure 5-5 shows the mitral valve leaflets and related cardiac structures as seen from the left atrium (the surgeon’s view) and the left ventricle. Each leaflet is composed of three scallops. Scallops A1 and P1 are the most lateral, located near the left atrial appendage; the middle scallops, A2 and P2, are the most posterior; and A3 and P3 are the most medial.
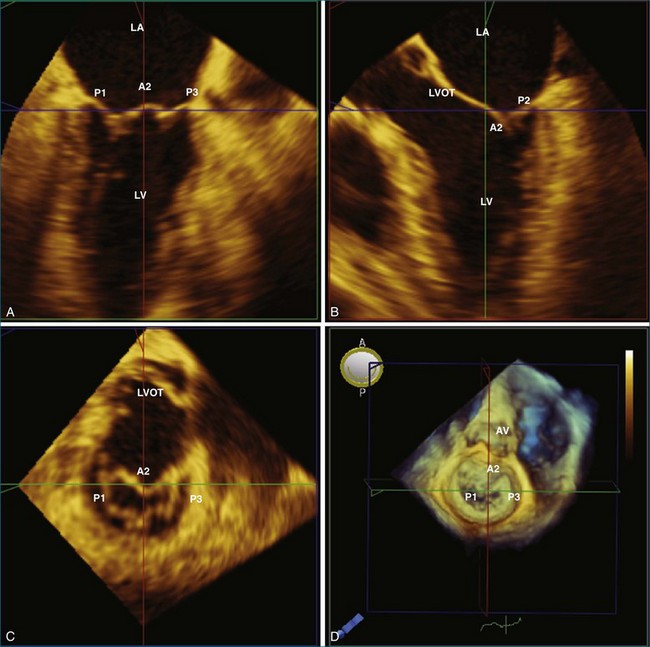
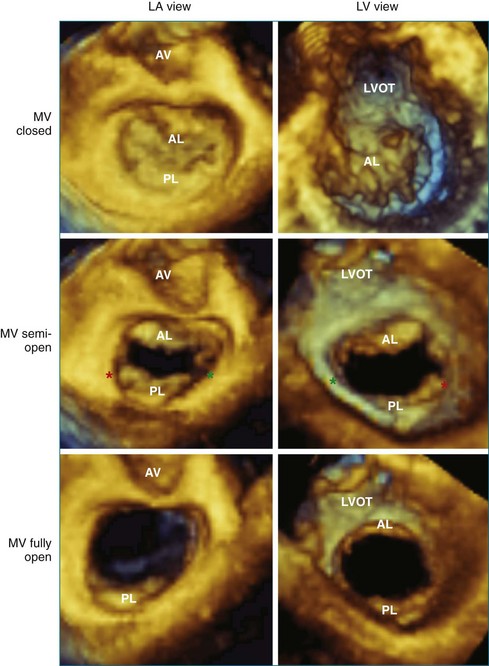
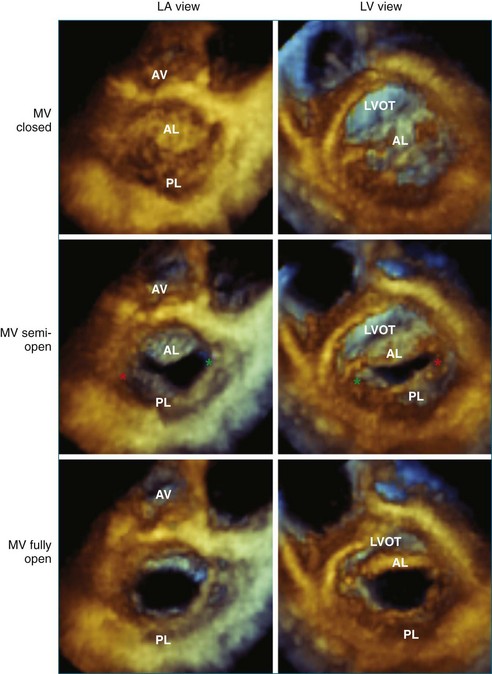
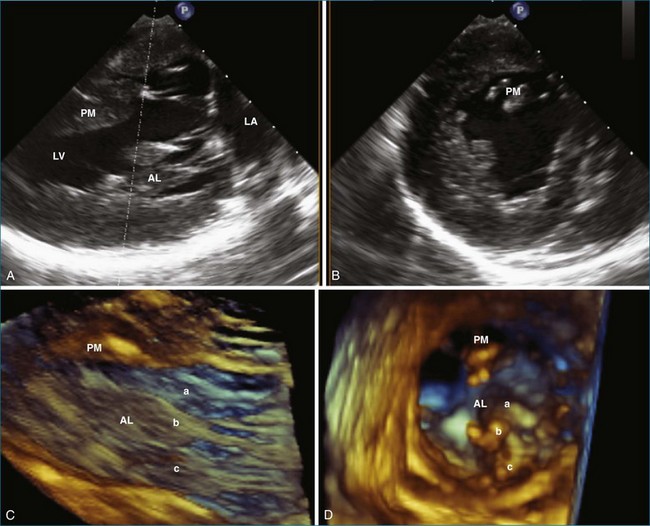
With 3DE, all six scallops of the mitral valve leaflets can be clearly visualized from either the left atrium or the left ventricle. These views can be obtained offline from cropping 3D full-volume (large-sector) datasets, which can be obtained by either a transthoracic or a transesophageal approach (Figure 5-6 and Video 5-1). During transesophageal exams, the 3D zoom (wide-sector focused) format also is helpful, especially to obtain real-time information on leaflet function during surgery or catheter procedures. In this case, the images are obtained by identifying the entire mitral valve on orthogonal biplane 2D images. The resulting 3D zoom display is rotated with the aortic valve in the 12 o’clock position to obtain the surgeon’s view from the left atrium. In this view, normal systolic bulging of the central part of the anterior leaflet can be visualized. When this image is flipped 180 degrees, the leaflet scallops are displayed as viewed from the left ventricle (Figure 5-7). In transthoracic exams, similarly detailed 3D images also can be obtained. Figure 5-8 demonstrates how clearly the mitral valve leaflets can be displayed from a 3D full-volume dataset acquired during a transthoracic exam. In this case, the image is rotated and the vertical axis is cropped from the atrial side to obtain the surgeon’s view. By flipping the image 180 degrees and cropping from the ventricular side, the valve leaflets can be seen as viewed from the apex in relation to the commissures and papillary muscles.
The commissures of the mitral valve are easily identified by RT3DE. The anterolateral commissure is located next to the left atrial appendage and the left fibrous trigone and represents the point of fusion between A1 and P1. The posteromedial commissure is located next to the right fibrous trigone and represents the point of fusion between A3 and P3. A short-axis view of the mitral valve using the narrow-sector format can clearly display both commissures from the atrium and the ventricle by either the transesophageal or the transthoracic approach (see Figures 5-7 and 5-8). In the transesophageal exam, the mid-esophageal view allows ideal visualization of both commissures. The anatomy of the commissures is of particular importance in patients with mitral valve stenosis before balloon valvuloplasty. In fact, commissural splitting is believed to be the primary mechanism of increasing valve area during balloon valvuloplasty. Thus, the degree of noncalcified commissural fusion, as assessed by RT3DE, correlates with successful valvuloplasty and may be a better predictor of procedural success compared with traditional 2D scoring algorithms.14–16 Heavily calcified commissures are unlikely to split during the procedure and should be identified before referral for valvuloplasty.17,18
In the evaluation of mitral stenosis, RT3DE can improve assessments of leaflet opening. In 2D, calculating valve area by planimetry is unreliable because it is difficult to determine if the traced plane intersects the valve at its smallest dimensions.18 This limitation, however, is overcome with 3DE imaging because the entire valve can be imaged and the short-axis plane can be cropped at the smallest area.17,19,20 As demonstrated in several studies, this method may be superior to estimating true mitral valve area when compared with 2D measurements by pressure half-time, proximal isovelocity surface area, and planimetry.17,20–26 Some have suggested that 3D planimetry may be more accurate than even invasive measurements of mitral valve area.21,22,27
With RT3DE, it is also possible to ascertain mitral valve leaflet volume. As rheumatic disease progresses, the leaflets thicken. The degree of thickening correlates with complications such as atrial fibrillation and death.28 Leaflet volume also can be assessed with RT3DE, which may have as much prognostic value as mitral valve area.25
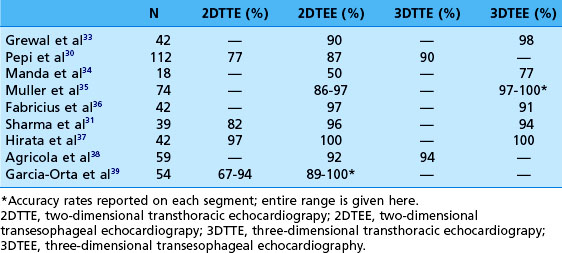
RT3DE allows full assessment of the mitral valve leaflet motion in the majority of cases. Even during transthoracic exams, all three scallops of the anterior and posterior leaflets are completely visualized in up to 84% and 77% of cases, respectively.29–32 This technology is of particular use in identifying the exact location of leaflet pathology. On transesophageal echocardiography (TEE), it is possible to see each individual scallop with 2D imaging alone, but this process is cumbersome because the entire leaflets cannot be seen in the same view. To reconstruct all six scallops, an excellent working memory of mitral valve anatomy is required, and it is necessary to rotate through the various views to identify and locate pathology. With 3D imaging, however, all six scallops, along with their relationships to other structures, can be visualized at once (Figure 5-9). For example, a fibroelastoma is shown in Figure 5-10. In the 2D transesophageal views, this tumor is easily seen on the posterior leaflet, but the 3D zoom view demonstrates its exact location on P1 very close to the anterolateral commissure. In addition, mitral valve prolapse can be easily identified in 3D with the wide-sector focused view. As seen from the left atrium, the prolapsed segment is a bright bulge. From the ventricle, it is a spoon-shaped depression. Although 2DE may diagnose the presence of flail or prolapse in general, 3DE often is needed to identify the specific scallops involved.32 In fact, myxomatous mitral valve disease highlights the usefulness of 3D techniques. Several studies have compared the accuracy of the various echo modalities in identifying the location of mitral valve prolapse (Table 5-2).30,31,33–39 3DE also can help visualize and quantify the location and size of the orifice regurgitant area that leads to mitral regurgitation. Color Doppler can be added to full-volume acquisitions. This increased level of visualization shows the regurgitation as a column or plane. Especially in eccentric mitral regurgitation, 3D allows visualization beyond a 2D “jet,” thus better characterizing its severity. In planning mitral valve surgery, the increased level of detail proved by RT3DE is helpful to the surgeon and may increase repair rates.33
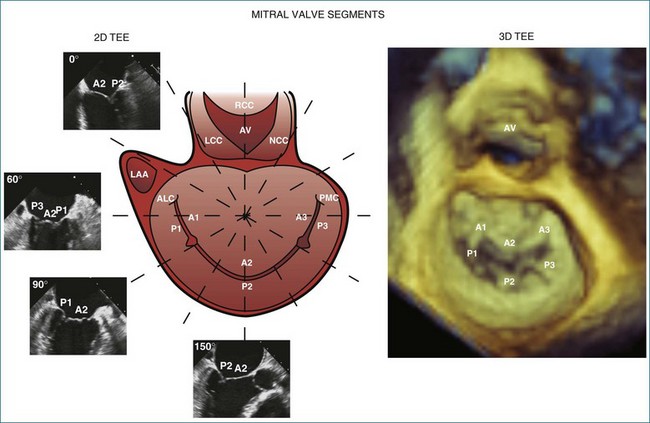
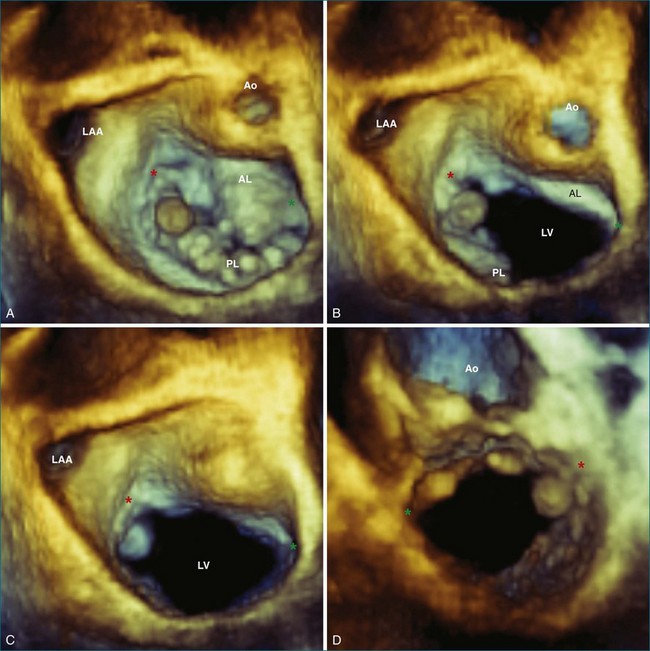
Table 5-2 Comparison of the Accuracy of Each Echo Modality in Identifying the Correct Location of Mitral Valve Prolapse (Validated by Surgical Inspection)
In addition to prolapse, RT3DE has been helpful in quantifying leaflet tethering associated with functional mitral regurgitation. Normally, the mitral valve leaflets are nearly level with the annulus (with a mean tenting height of 1.9 ± 1.5 mm).7 Figure 5-11 demonstrates mitral valve tenting in a normal mitral valve. In ischemic mitral regurgitation, the mitral valve leaflets may be pulled toward the ventricle by increased tension of the chordae. In extreme cases, with bileaflet restriction, the valve can form a funnel shape, allowing free central regurgitation. Several laboratories have developed methods of quantifying leaflet tethering using datasets from RT3DE.13,40–42 With these models, information on the mechanism of ischemic mitral regurgitation is ascertained. For example, Kwan and colleagues41 showed that an inferior infarct caused asymmetric tethering on the medial side of the valve.
Chordae Tendineae
Approximately 140 individual leaflet chordae originate from the six heads of the papillary muscles and end at the mitral valve leaflets.43 On average, each papillary muscle gives rise to 12 first-order chordae (two for each of the six heads). These divide to form an average of two second-order chordae, of which many further divide into two or three third-order chordea.44 The majority of these chordae are marginal and insert into the rough zone of the leaflets’ free edge. The purpose of these is to maintain leaflet coaptation and aid in mitral valve closure; rupture of primary chordae gives rise to mitral regurgitation.4 Approximately 20 basal chordae insert into the ventricular free surface on the posterior leaflet and a few millimeters inward on the anterior leaflet at the junction of the smooth and rough zones. Among the basal chordae are several particularly thick fibrous “strut chordae,” which insert in the central portion of the leaflets.6,45,46 The purpose of these chordae is to support the left ventricular wall and maintain the aortic-mitral annular angle.4 Each papillary muscle supplies chordae to both leaflets, but the anterolateral papillary muscle supports the structures on the left (the anterolateral commissure, A1 and P1 scallops, and the left half of A2 and P2 scallops). Likewise, the posteromedial papillary muscle supports the rightward structures (the posteromedial commissure, A3 and P3 scallops, and the right half of A2 and P2 scallops).45,47
The chordae are best seen in the wide-angle focused segments oriented from the ventricular side, where both the leaflet and papillary muscle attachments are visualized. In transesophageal exams, the transgastric long-axis view gives the best look at the subchordal apparatus (Figure 5-12).
In the past, information about the chordae has come from autopsy studies. As 3D investigations and techniques progress, more information will be obtained about how the chordae function in the setting of disease states that may cause rupture, thickening, and shortening of these structures. RT3DE has already proven to be better than 2DE in identifying chordal rupture in infectious endocarditis, aiding effective repair during surgery.48,49
Papillary Muscles and Left Ventricular Wall
The importance of the papillary muscles and the associated left ventricular free wall to mitral valve function was first recognized in the 1960s. Autopsy data showed that ischemic mitral regurgitation often was associated with fibrosis and necrosis of the papillary muscles.43,44 In general, the papillary muscles are attached to the left ventricular wall with a broad base larger than the area of the muscle itself. The papillary muscles are attached to the middle third of the left ventricular wall and oriented along the axis of the left ventricle and perpendicular to the mitral valve leaflets.4 The width of the papillary muscles is nearly the same as the left ventricular wall. Each papillary muscle is composed of about six muscular heads that give rise to one or two primary chordae.43 The anterolateral papillary muscle is connected to the mid-portion of the lateral free wall and usually is larger than the posteromedial one, which is attached to the mid-septum. Figure 5-13 compares 2D biplane and 3D wide-sector views of the papillary muscles.
During systole, the papillary muscle shortens to maintain a fixed chordal distance from the tips to the leaflets, preventing prolapse of the leaflets into the atrium.50 Their thickening also occupies space beneath the mitral valve (in the area of left ventricular inflow), directing blood toward the left ventricular outflow and the aortic valve.4
Using RT3DE, much more information about the location of the papillary muscles in the live heart has been ascertained. With computer reconstructions, the distance of the papillary muscle tips to the mitral valve annulus and their angle of orientation can easily be measured. The point of reference to make this measurement on the mitral valve annulus is the relatively stationary aortic-mitral fibrosa (at the junction of the anterior annulus and the aortic valve, as shown in Figure 5-5). The interpapillary angle is the angle of intersection of the two lines that connect each papillary muscle to this point on the mitral valve annulus. The interpapillary distance also is measured (Figure 5-14).
Annular to anterolateral papillary distance, annular to posteromedial papillary distance, and interpapillary distance depend on left ventricular remodeling and dilation, which increase in dilated cardiomyopathy. As such, 3D measurements of end-diastolic volume are also very important in this analysis, and normal left ventricular and papillary measurements depend on body size (see Table 5-1).7 As discussed in more detail in other chapters, numerous studies have demonstrated the usefulness of RT3DE over 2D biplane measurements for assessing left ventricular volumes because 2DE tends to underestimate true volumes.51–56 Normal values of left ventricular volumes and papillary muscle distances are provided in Table 5-1.
These measurements are very important in functional mitral regurgitation, in which chordal tethering of the leaflets occurs after left ventricular remodeling. In fact, the distance from the papillary muscle to the annulus is one of the best predictors of mitral regurgitation severity in models of dilated cardiomyopathy.50,57,58 These models also have highlighted the necessity for maintaining a constant papillary to annular distance throughout the cardiac cycle.50 Therefore, taking this measurement in real time during mitral valve surgery may be useful because increasingly complicated surgeries involve papillary muscle repositioning and chordal cutting.57,59–61
In ischemic mitral regurgitation, regional left ventricular wall motion abnormalities are directly associated with the degree of mitral regurgitation.62 This is especially true in a posterior infarct, where posterolateral hypokinesis results in asymmetrical tethering of the posterior leaflet.41 In these cases, it is still unclear how much of a role left ventricular focal wall motion abnormalities play.58 RT3DE with segmental volumetric analysis quantifies wall motion abnormalities and may determine the mechanism of mitral valve dysfunction in ischemic disease.
Left Atrium
The left atrium influences mitral valve anatomy because the mitral valve leaflets can be characterized as a continuation of the left atrial walls and serve as the floor of the left atrium.6,63 In particular, the lateral and posterior walls of the left atrium extend to form the posterior leaflet, whereas the anterior atrial wall extends to form the anterior leaflet.6
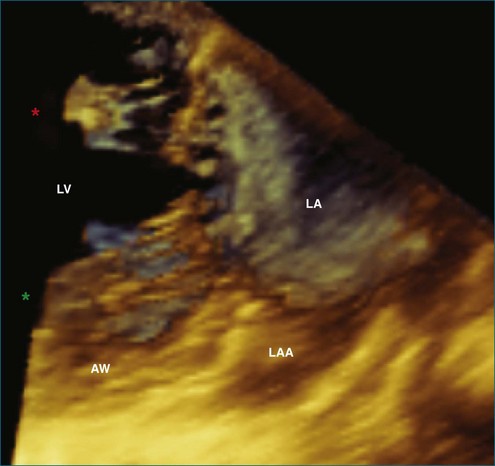
This interconnection between the atrial wall and the mitral valve can be appreciated on 3DE. The atrium can be best be visualized with full-volume datasets. In transesophageal exams, the mid-esophageal views also allow real-time imaging of the atrium with the 3D wide-sector format (Figure 5-15). In this view, the left atrial appendage (on the lateral wall of the atrium), the aortic valve (on the anterior wall), and fossa ovalis (on the medial wall) serve as important landmarks. During transesophageal studies, the five-chamber deep gastric view also is helpful to view the entire left atrium, with a better view of the superior portions to assess volumes.
The importance of left atrial anatomy in mitral valve function may become clear in disease states, particularly in functional mitral regurgitation, in which increased atrial flow leads to impressive atrial dilation and decreased compliance. Like ventricular deformation, atrial enlargement also may, in turn, lead to further mitral valve dysfunction, creating a vicious cycle of remodeling and regurgitation.63 Indeed, left atrial volume is associated with severity and outcomes in patients with a variety of disease states, including mitral regurgitation.64 Whether this is a marker or a cause of the disease process is still unclear. 3DE may help elucidate the role of the left atrium. 3DE already has helped by allowing more accurate measures of left atrial volume.65–68
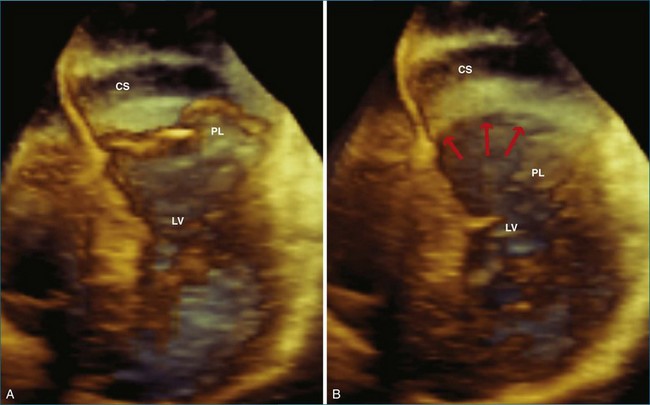
Although not formally part of the left atrium, the relationship of the coronary sinus to the mitral valve annulus has become important as new technologies, such as transcatheter mitral valve repair, use this structure. The usual position of the coronary sinus in the atrioventricular groove, just posterior to the mitral valve annulus, provides an ideal location for synch devices, which can be inserted into the coronary sinus. These devices hug the posterior annulus, decreasing the annular circumference and reducing functional mitral regurgitation. An example of the location of the coronary sinus with respect the mitral valve annulus is shown in Figure 5-16. In this case, RT3DE shows that the coronary sinus is located superior to the annulus, likely rendering it unusable as a conduit for transcatheter mitral valve repair.
1 Levine RA, Handschumacher MD, Sanfilippo AJ, et al. Three-dimensional echocardiographic reconstruction of the mitral valve, with implications for the diagnosis of mitral valve prolapse. Circulation. 1989;80(3):589–598.
2 Salgo IS, Gorman JH, Gorman RC, et al. Effect of annular shape on leaflet curvature in reducing mitral leaflet stress. Circulation. 2002;106(6):711–717.
3 Solis J, Sitges M, Levine RA, Hung J. Three-dimensional echocardiography. New possibilities in mitral valve assessment. Revista Española de Cardiología (English Edition). 2009;62(2):188–198.
4 Silbiger JJ, Bazaz R. Contemporary insights into the functional anatomy of the mitral valve. Am Heart J. 2009;158(6):887–895.
5 Kalyanasundaram A, Qureshi A, Nassef LA, Shirani J. Functional anatomy of normal mitral valve-left ventricular complex by real-time, three-dimensional echocardiography. J Heart Valve Dis. 2010;19(1):28–34.
6 Salcedo EE, Quaife RA, Seres T, Carroll JD. A framework for systematic characterization of the mitral valve by real-time three-dimensional transesophageal echocardiography. J Am Soc Echocardiogr. 2009;22(10):1087–1099.
7 Sonne C, Sugeng L, Watanabe N, et al. Age and body surface area dependency of mitral valve and papillary apparatus parameters: Assessment by real-time three-dimensional echocardiography. Eur J Echocardiogr. 2009;10(2):287–294.
8 Kaplan SR, Bashein G, Sheehan FH, et al. Three-dimensional echocardiographic assessment of annular shape changes in the normal and regurgitant mitral valve. Am Heart J. 2000;139(3):378–387.
9 Kwan J, Qin JX, Popović ZB, et al. Geometric changes of mitral annulus assessed by real-time 3-dimensional echocardiography: Becoming enlarged and less nonplanar in the anteroposterior direction during systole in proportion to global left ventricular systolic function. J Am Soc Echocardiogr. 2004;17(11):1179–1184.
10 Qin JX, Shiota T, Tsujino H, et al. Mitral annular motion as a surrogate for left ventricular ejection fraction: Real-time three-dimensional echocardiography and magnetic resonance imaging studies. Eur J Echocardiogr. 2004;5(6):407–415.
11 Kwan J, Jeon M-J, Kim D-H, et al. Does the mitral annulus shrink or enlarge during systole? A real-time 3D echocardiography study. J Korean Med Sci. 2009;24(2):203–208.
12 Flachskampf FA, Chandra S, Gaddipatti A, et al. Analysis of shape and motion of the mitral annulus in subjects with and without cardiomyopathy by echocardiographic 3-dimensional reconstruction. J Am Soc Echocardiogr. 2000;13(4):277–287.
13 Watanabe N, Ogasawara Y, Yamaura Y, et al. Geometric deformity of the mitral annulus in patients with ischemic mitral regurgitation: A real-time three-dimensional echocardiographic study. J Heart Valve Dis. 2005;14(4):447–452.
14 Sutaria N, Shaw TRD, Prendergast B, Northridge D. Transoesophageal echocardiographic assessment of mitral valve commissural morphology predicts outcome after balloon mitral valvotomy. Heart. 2006;92(1):52–57.
15 Langerveld J, Valocik G, Plokker HWT, et al. Additional value of three-dimensional transesophageal echocardiography for patients with mitral valve stenosis undergoing balloon valvuloplasty. J Am Soc Echocardiogr. 2003;16(8):841–849.
16 Gill EA, Kim MS, Carroll JD. 3D TEE for evaluation of commissural opening before and during percutaneous mitral commissurotomy. JACC Cardiovasc Imag. 2009;2(8):1034–1035.
17 Chen Q, Nosir YF, Vletter WB, et al. Accurate assessment of mitral valve area in patients with mitral stenosis by three-dimensional echocardiography. J Am Soc Echocardiogr. 1997;10(2):133–140.
18 Martin RP, Rakowski H, Kleiman JH, et al. Reliability and reproducibility of two dimensional echocardiographic measurement of the stenotic mitral valve orifice area. Am J Cardiol. 1979;43(3):560–568.
19 Binder TM, Rosenhek R, Porenta G, et al. Improved assessment of mitral valve stenosis by volumetric real-time three-dimensional echocardiography. J Am Coll Cardiol. 2000;36(4):1355–1361.
20 Sugeng L, Weinert L, Lammertin G, et al. Accuracy of mitral valve area measurements using transthoracic rapid freehand 3-dimensional scanning: Comparison with noninvasive and invasive methods. J Am Soc Echocardiogr. 2003;16(12):1292–1300.
21 de Agustin JA, Nanda NC, Gill EA, et al. The use of three-dimensional echocardiography for the evaluation of and treatment of mitral stenosis. Cardiol Clin. 2007;25(2):311–318.
22 Pérez de Isla L, Casanova C, Almería C, et al. Which method should be the reference method to evaluate the severity of rheumatic mitral stenosis? Gorlin’s method versus 3D-echo. Eur J Echocardiogr. 2007;8(6):470–473.
23 Binder TM, Rosenhek R, Porenta G, et al. Improved assessment of mitral valve stenosis by volumetric real-time three-dimensional echocardiography. J Am Coll Cardiol. 2000;36(4):1355–1361.
24 Zamorano J, Cordeiro P, Sugeng L, et al. Real-time three-dimensional echocardiography for rheumatic mitral valve stenosis evaluation: An accurate and novel approach. J Am Coll Cardiol. 2004;43(11):2091–2096.
25 Valocik G, Kamp O, Mannaerts HFJ, Visser CA. New quantitative three-dimensional echocardiographic indices of mitral valve stenosis: New 3D indices of mitral stenosis. Int J Cardiovasc Imag. 2007;23(6):707–716.
26 Xie M-X, Wang X-F, Cheng TO, et al. Comparison of accuracy of mitral valve area in mitral stenosis by real-time, three-dimensional echocardiography versus two-dimensional echocardiography versus Doppler pressure half-time. Am J Cardiol. 2005;95(12):1496–1499.
27 Zamorano J, de Agustín JA. Three-dimensional echocardiography for assessment of mitral valve stenosis. Curr Opin Cardiol. 2009;24(5):415–419.
28 Limbu YR, Chen H, Shen X, et al. Assessment of mitral valve volume by quantitative three-dimensional echocardiography in patients with rheumatic mitral valve stenosis. Clin Cardiol. 1998;21(6):415–418.
29 Godoy IE, Bednarz J, Sugeng L, et al. Three-dimensional echocardiography in adult patients: Comparison between transthoracic and transesophageal reconstructions. J Am Soc Echocardiogr. 1999;12(12):1045–1052.
30 Pepi M, Tamborini G, Maltagliati A, et al. Head-to-head comparison of two- and three-dimensional transthoracic and transesophageal echocardiography in the localization of mitral valve prolapse. J Am Coll Cardiol. 2006;48(12):2524–2530.
31 Sharma R, Mann J, Drummond L, et al. The evaluation of real-time 3-dimensional transthoracic echocardiography for the preoperative functional assessment of patients with mitral valve prolapse: A comparison with 2-dimensional transesophageal echocardiography. J Am Soc Echocardiogr. 2007;20(8):934–940.
32 Sugeng L, Coon P, Weinert L, et al. Use of real-time 3-dimensional transthoracic echocardiography in the evaluation of mitral valve disease. J Am Soc Echocardiogr. 2006;19(4):413–421.
33 Grewal J, Mankad S, Freeman W, et al. Real-time three-dimensional transesophageal echocardiography in the intraoperative assessment of mitral valve disease. J Am Soc Echocardiogr. 2009;22(1):34–41.
34 Manda J, Kesanolla SK, Hsuing MC, et al. Comparison of real time two-dimensional with live/real time three-dimensional transesophageal echocardiography in the evaluation of mitral valve prolapse and chordae rupture. Echocardiography. 2008;25(10):1131–1137.
35 Müller S, Müller L, Laufer G, et al. Comparison of three-dimensional imaging to transesophageal echocardiography for preoperative evaluation in mitral valve prolapse. Am J Cardiol. 2006;98(2):243–248.
36 Fabricius AM, Walther T, Falk V, Mohr FW. Three-dimensional echocardiography for planning of mitral valve surgery: Current applicability? Ann Thorac Surg. 2004;78(2):575–578.
37 Hirata K, Pulerwitz T, Sciacca R, et al. Clinical utility of new real time three-dimensional transthoracic echocardiography in assessment of mitral valve prolapse. Echocardiography. 2008;25(5):482–488.
38 Agricola E, Oppizzi M, Pisani M, et al. Accuracy of real-time 3D echocardiography in the evaluation of functional anatomy of mitral regurgitation. Int J Cardiol. 2008;127(3):342–349.
39 García-Orta R, Moreno E, Vidal M, et al. Three-dimensional versus two-dimensional transesophageal echocardiography in mitral valve repair. J Am Soc Echocardiogr. 2007;20(1):4–12.
40 Watanabe N, Ogasawara Y, Yamaura Y, et al. Quantitation of mitral valve tenting in ischemic mitral regurgitation by transthoracic real-time three-dimensional echocardiography. J Am Coll Cardiol. 2005;45(5):763–769.
41 Kwan J, Shiota T, Agler DA, et al. Geometric differences of the mitral apparatus between ischemic and dilated cardiomyopathy with significant mitral regurgitation: Real-time three-dimensional echocardiography study. Circulation. 2003;107(8):1135–1140.
42 Otsuji Y, Handschumacher MD, Schwammenthal E, et al. Insights from three-dimensional echocardiography into the mechanism of functional mitral regurgitation: Direct in vivo demonstration of altered leaflet tethering geometry. Circulation. 1997;96(6):1999–2008.
43 Roberts WC, Cohen LS. Left ventricular papillary muscles. Description of the normal and a survey of conditions causing them to be abnormal. Circulation. 1972;46(1):138–154.
44 Silverman ME, Hurst JW. The mitral complex. Interaction of the anatomy, physiology, and pathology of the mitral annulus, mitral valve leaflets, chordae tendineae, and papillary muscles. Am Heart J. 1968;76(3):399–418.
45 Degandt AA, Weber PA, Saber HA, Duran CMG. Mitral valve basal chordae: Comparative anatomy and terminology. Ann Thorac Surg. 2007;84(4):1250–1255.
46 Da Col U, Ramoni E, Di Lazzaro D. Posterior mitral leaflet: New anatomical insight and review of nomenclature (mitral valve anatomy). J Cardiovasc Med (Hagerstown). 2010;11(11):820–826.
47 Kumar N, Kumar M, Duran CM. A revised terminology for recording surgical findings of the mitral valve. J Heart Valve Dis. 1995;4(1):70–75.
48 Hansalia S, Biswas M, Dutta R, et al. The value of live/real time three-dimensional transesophageal echocardiography in the assessment of valvular vegetations. Echocardiography. 2009;26(10):1264–1273.
49 Ma N, Li Z-an, Meng X, Yang Y. Live three-dimensional transesophageal echocardiography in mitral valve surgery. Chin Med J. 2008;121(20):2037–2041.
50 Komeda M, Glasson JR, Bolger AF, et al. Papillary muscle-left ventricular wall “complex. J Thorac Cardiovasc Surg. 1997;113(2):292–301.
51 Jenkins C, Moir S, Chan J, et al. Left ventricular volume measurement with echocardiography: A comparison of left ventricular opacification, three-dimensional echocardiography, or both with magnetic resonance imaging. Eur Heart J. 2009;30(1):98–106.
52 Bicudo LS, Tsutsui JM, Shiozaki A, et al. Value of real time three-dimensional echocardiography in patients with hypertrophic cardiomyopathy: Comparison with two-dimensional echocardiography and magnetic resonance imaging. Echocardiography. 2008;25(7):717–726.
53 Jenkins C, Bricknell K, Chan J, et al. Comparison of two- and three-dimensional echocardiography with sequential magnetic resonance imaging for evaluating left ventricular volume and ejection fraction over time in patients with healed myocardial infarction. Am J Cardiol. 2007;99(3):300–306.
54 Gutiérrez-Chico JL, Zamorano JL, Pérez de Isla L, et al. Comparison of left ventricular volumes and ejection fractions measured by three-dimensional echocardiography versus by two-dimensional echocardiography and cardiac magnetic resonance in patients with various cardiomyopathies. Am J Cardiol. 2005;95(6):809–813.
55 Chuang ML, Hibberd MG, Salton CJ, et al. Importance of imaging method over imaging modality in noninvasive determination of left ventricular volumes and ejection fraction: Assessment by two- and three-dimensional echocardiography and magnetic resonance imaging. J Am Coll Cardiol. 2000;35(2):477–484.
56 Chukwu EO, Barasch E, Mihalatos DG, et al. Relative importance of errors in left ventricular quantitation by two-dimensional echocardiography: Insights from three-dimensional echocardiography and cardiac magnetic resonance imaging. J Am Soc Echocardiogr. 2008;21(9):990–997.
57 Hung J, Chaput M, Guerrero JL, et al. Persistent reduction of ischemic mitral regurgitation by papillary muscle repositioning: Structural stabilization of the papillary muscle-ventricular wall complex. Circulation. 2007;116(11 Suppl):I259–I263.
58 Otsuji Y, Handschumacher MD, Liel-Cohen N, et al. Mechanism of ischemic mitral regurgitation with segmental left ventricular dysfunction: Three-dimensional echocardiographic studies in models of acute and chronic progressive regurgitation. J Am Coll Cardiol. 2001;37(2):641–648.
59 Messas E, Guerrero JL, Handschumacher MD, et al. Chordal cutting: A new therapeutic approach for ischemic mitral regurgitation. Circulation. 2001;104(16):1958–1963.
60 Hung J, Guerrero JL, Handschumacher MD, et al. Reverse ventricular remodeling reduces ischemic mitral regurgitation: Echo-guided device application in the beating heart. Circulation. 2002;106(20):2594–2600.
61 Liel-Cohen N, Guerrero JL, Otsuji Y, et al. Design of a new surgical approach for ventricular remodeling to relieve ischemic mitral regurgitation: Insights from 3-dimensional echocardiography. Circulation. 2000;101(23):2756–2763.
62 Pecini R, Hammer-Hansen S, Dalsgaard M, et al. Determinants of exercise-induced increase of mitral regurgitation in patients with acute coronary syndromes. Echocardiography. 2010;27(5):567–574.
63 Schmitto JD, Lee LS, Mokashi SA, et al. Functional mitral regurgitation. Cardiol Rev. 2010;18(6):285–291.
64 Le Tourneau T, Messika-Zeitoun D, Russo A, et al. Impact of left atrial volume on clinical outcome in organic mitral regurgitation. J Am Coll Cardiol. 2010;56(7):570–578.
65 Russo C, Hahn RT, Jin Z, et al. Comparison of echocardiographic single-plane versus biplane method in the assessment of left atrial volume and validation by real time three-dimensional echocardiography. J Am Soc Echocardiogr. 2010;23(9):954–960.
66 de Groot NMS, Schalij MJ. Imaging modalities for measurements of left atrial volume in patients with atrial fibrillation: What do we choose? Europace. 2010;12(6):766–767.
67 Badano LP, Pezzutto N, Marinigh R, et al. How many patients would be misclassified using M-mode and two-dimensional estimates of left atrial size instead of left atrial volume? A three-dimensional echocardiographic study. J Cardiovasc Med (Hagerstown). 2008;9(5):476–484.
68 Azar F, Pérez de Isla L, Moreno M, et al. Three-dimensional echocardiographic assessment of left atrial size and function and the normal range of asynchrony in healthy individuals. Rev Esp Cardiol. 2009;62(7):816–819.
69 Corsi C, Lang RM, Veronesi F, et al. Volumetric quantification of global and regional left ventricular function from real-time three-dimensional echocardiographic images. Circulation. 2005;112(8):1161–1170.
70 Zeidan Z, Erbel R, Barkhausen J, et al. Analysis of global systolic and diastolic left ventricular performance using volume-time curves by real-time three-dimensional echocardiography. J Am Soc Echocardiogr. 2003;16(1):29–37.
71 Nosir YF, Lequin MH, Kasprzak JD, et al. Measurements and day-to-day variabilities of left ventricular volumes and ejection fraction by three-dimensional echocardiography and comparison with magnetic resonance imaging. Am J Cardiol. 1998;82(2):209–214.
[/level-membership-for-cardiovascular-category][not-level-membership-for-cardiovascular-category]
Chapter 5 Normal Mitral Valve Anatomy and Measurements
The complexity of the mitral valve is such that two-dimensional (2D) imaging does not adequately describe its anatomy and function. Indeed, the mitral valve apparatus is a dynamic three-dimensional (3D) structure composed of the saddle-shaped annulus; two asymmetric leaflets; multiple chordae tendineae of various lengths, thicknesses, and points of attachment; the left ventricular wall and the attached papillary muscles; and parts of the left atrium (Figure 5-1). During normal function, this array of parts constantly shifts in a complex but defined pattern. Normal alignment of all aspects of this biologic machine is required to avoid dysfunction. Therefore, full understanding of the mitral valve anatomy is not ascertained without 3D imaging. Real-time 3D echocardiography (RT3DE) gives echocardiographers a rapid and easily accessible method of identifying the entire mitral valve apparatus in most patients. As a prominent structure in the posterior left heart, the mitral valve often can be displayed in 3D using either a transthoracic approach or a transesophageal approach. Furthermore, detailed volumetric and positional analysis of the various mitral valve components often is possible (Table 5-1). RT3DE, however, is a novel modality, and its use in mastering the analysis of the intricate mitral valve requires a substantial time commitment. This chapter highlights the use of RT3DE in imaging the normal mitral valve, demonstrating usual transthoracic and transesophageal views for each of its components. It also provides an overview of typical 3D quantitative analyses of the size and position of the mitral valve structures.
Table 5-1 Key Normal Measurements Obtained by Real-Time Three-Dimensional Echocardiography for Each Mitral Valve Structure
| Key Measurements | Normal Values | Reference |
|---|---|---|
| Mitral Valve Annulus | ||
| Anteroposterior dimension | 30.8 ± 4.4 mm | Sonne et al7 |
| 24 ± 1 mm | Kwan et al41 | |
| Commissural dimension | 35.1 ± 4.9 mm | Sonne et al7 |
| 28 ± 1 mm | Kwan et al41 | |
| Circumference | 10.5 ± 1.4 mm | Sonne et al7 |
| 10.0 ± 0.8 mm | Watanabe et al40 | |
| Height | 4.3 ± 2.1 mm | Sonne et al7 |
| 3.0 ± 1.0 mm | Flachskampf et al12 | |
| 4.5 ± 1.1 mm | Watanabe et al40 | |
| Area/BSA (end diastole) | 4.6 ± 1.3 cm2/m2 | Qin et al10 |
| 5.9 ± 1.2 cm2/m2 | Flachskampf et al12 | |
| Area/BSA (mid systole) | 5.1 ± 0.8 cm2/m2 | Sonne et al7 |
| Area/BSA (end systole) | 3.8 ± 1.1 cm2/m2 | Qin et al10 |
| Area change | 23.8% ± 5.1% | Flachskampf et al12 |
| 15% ± 16% | Qin et al10 | |
| Linear systolic motion | 16 ± 3 mm | Qin et al10 |
| 10 ± 3 mm | Flachskampf et al12 | |
| Mitral Valve Leaflets | ||
| Volume | 4.5 ± 0.7 cm3 | Limbu et al28 |
| Maximum tenting height | 5.3 ± 2.4 mm | Sonne et al7 |
| 3.1 ± 1.2 mm | Watanabe et al40 | |
| 5 ± 0.2 mm | Kalyanasundaram et al5 | |
| Mean tenting height | 1.9 ± 1.5 mm | Sonne et al7 |
| 0.7 ± 0.5 mm | Watanabe et al40 | |
| Tenting volume | 1.5 ± 0.9 cm3 | Sonne et al7 |
| 0.45 ± 0.29 cm3 | Watanabe et al40 | |
| Papillary Muscles (Indexed to BSA) | ||
| AL papillary to annular distance | 21.0 ± 5.8 mm/m2 | Sonne et al7 |
| PM papillary to annular distance | 22.3 ± 5.6 mm/m2 | Sonne et al7 |
| Interpapillary muscle angle | 17.6 ± 9.1 degrees/m2 | Sonne et al7 |
| Interpapillary distance | 10.5 ± 3.3 mm/m2 | Sonne et al7 |
| Left Ventricle | ||
| End-systolic volume | 43.7 ± 10.7 mL | Chukwu et al56 |
| 59 ± 18 mL | Corsi et al69 | |
| 43 ± 18 mL | Zeidan et al70 | |
| 47 ± 6 mL | Nosir et al71 | |
| End-diastolic volume | 115 ± 22.6 mL | Chukwu et al56 |
| 143 ± 30 mL | Corsi et al69 | |
| 108 ± 32 mL | Zeidan et al70 | |
| 113 ± 16 mL | Nosir et al71 | |
| Left Atrium | ||
| End-diastolic volume | 48.9 ± 25.1 cm3 | Azar et al68 |
| End-systolic volume | 62.3 ± 17.2 cm3 | Azar et al68 |
In some cases, values vary due to technique and studied population.
AL, anterolateral; BSA, body surface area; PM, posteromedial.
Mitral Valve Annulus
3DE has increased the understanding of the anatomy of the mitral valve annulus more than that of any other structure in the heart. 3D reconstructions identified the mitral valve annulus as a hyperbolic paraboloid or a saddle-shaped structure with curved planes parallel to the anteroposterior axis opening upward and orthogonal curved planes that open downward (Figure 5-2).1 This complex shape is not appreciated on 2D imaging, which tends to simplify the annulus as a planar ring. In fact, the anterior and posterior portions of the mitral valve annulus are about 5 mm higher than the medial and lateral commissural points.1 This height, along with the commissural diameter (the distance between the two low points) and the anteroposterior diameter (the distance between the two high points), can be easily measured with 3D imaging. The nonplanar shape of the mitral valve annulus is very important in reducing leaflet stress, which is increased when the annulus flattens.2 As such, the hyperbolic paraboloid annular shape with a height/commissural width ratio of 15% to 20% is preserved in many mammalian species, including humans.2–4
RT3DE is fundamental to clarifying annular geometry. In fact, obtaining accurate annular dimensions is best done with 3D datasets because 2DE underestimates these values by 6% to 14%.5 The mitral valve annulus is best seen using the large-sector (3D full volume) and wide-sector focused (3D zoom) formats. In particular, computer remodeling from large-sector datasets can quickly measure and display these changes without requiring the time-consuming reconstructions from multiple 2D images. 3D volume data can be obtained from either transthoracic or transesophageal exams. These models are obtained offline by tracing the mitral valve annulus contours in relation to other structures (such as the papillary muscles and aortic valve) in several 3D views (Figure 5-3). From these computer renditions, several annular dimensions, including circumference, anteroposterior (high-point) dimension, commissural (low-point) dimension, height, and annular area, can be measured (Figure 5-4).6
Recognizing the mitral valve annulus as a nonplanar structure is very important to understanding mitral valve function. For example, the complex shape of the mitral valve annulus has led to the overdiagnosis of mitral valve prolapse with 2DE. In certain 2D views, particularly the apical four-chamber view, which shows the mitral valve annulus in mediolateral directions, the leaflets appear to be on the atrial side of the mitral valve annulus, when, in fact, they are still inferior to the high anterior and posterior points. In 2DE imaging without fully realizing the nonplanarity of the mitral valve annulus, this normal anatomy can be mischaracterized as mitral valve prolapse.1
RT3DE has also shown that annular area significantly depends on body size and height.7 The normal diastolic mitral valve area (which is a projection onto the least squares plane) is 5 to 6.5 cm2 (indexed to body service area).8 The mitral valve annulus, however, is a dynamic structure whose complex motion throughout the cardiac cycle has not been fully ascertained.9–11 On the basis of early studies in 3DE from 2D renditions, it was believed that the mitral valve area decreases during systole by up to 24%, which is thought to occur as the anterior and lateral high points move closer together, increasing the height and eccentricity of the annulus.8,12 In addition to a decrease in annular area, there is a significant apical displacement of the annulus during systole, with an average annular motion of 16 ± 3 mm in normal hearts.10
Recent investigations using RT3DE with volumetric reconstructions have further characterized this motion in both normal ventricles and those with cardiomyopathy. In disease states, the shape and dynamic function of the mitral valve can change dramatically. For example, in dilated cardiomyopathy, especially with functional mitral regurgitation, the annulus flattens, dilates, and becomes more circular.8 These annuli also demonstrate less dynamic variability. During systole, they may have less change in height and diameter, leading to a smaller change in the projected valve area.12,13 Most significantly, those with cardiomyopathy have less apical excursion during systole. In fact, the degree of annular displacement correlates well with ejection fraction; a linear motion less than 12 mm accurately identifies those with an ejection fraction less than 50%.10
Mitral Valve Leaflets
Like the annulus, the attached mitral valve leaflets are 3D dynamic structures. The anterior leaflet covers two thirds of the orifice and is attached to the part of anterior annulus adjacent to the aortic valve near the right fibrous trigone, aortic-mitral fibrosa, and left fibrous trigone (Figure 5-5). The posterior leaflet, although smaller, covering only one third of the mitral orifice, is semicircular in shape and borders most of the annulus from one commissure to the other.6 Figure 5-5 shows the mitral valve leaflets and related cardiac structures as seen from the left atrium (the surgeon’s view) and the left ventricle. Each leaflet is composed of three scallops. Scallops A1 and P1 are the most lateral, located near the left atrial appendage; the middle scallops, A2 and P2, are the most posterior; and A3 and P3 are the most medial.
With 3DE, all six scallops of the mitral valve leaflets can be clearly visualized from either the left atrium or the left ventricle. These views can be obtained offline from cropping 3D full-volume (large-sector) datasets, which can be obtained by either a transthoracic or a transesophageal approach (Figure 5-6 and Video 5-1). During transesophageal exams, the 3D zoom (wide-sector focused) format also is helpful, especially to obtain real-time information on leaflet function during surgery or catheter procedures. In this case, the images are obtained by identifying the entire mitral valve on orthogonal biplane 2D images. The resulting 3D zoom display is rotated with the aortic valve in the 12 o’clock position to obtain the surgeon’s view from the left atrium. In this view, normal systolic bulging of the central part of the anterior leaflet can be visualized. When this image is flipped 180 degrees, the leaflet scallops are displayed as viewed from the left ventricle (Figure 5-7). In transthoracic exams, similarly detailed 3D images also can be obtained. Figure 5-8 demonstrates how clearly the mitral valve leaflets can be displayed from a 3D full-volume dataset acquired during a transthoracic exam. In this case, the image is rotated and the vertical axis is cropped from the atrial side to obtain the surgeon’s view. By flipping the image 180 degrees and cropping from the ventricular side, the valve leaflets can be seen as viewed from the apex in relation to the commissures and papillary muscles.
