40 Neuroimaging
 Methods
Plain Radiographs
Plain radiographs can be acquired rapidly and inexpensively but are of limited value in studying patients with suspected central nervous system (CNS) pathology. In the initial evaluation of patients with traumatic injuries, plain radiography of the head and neck may be useful when a surgical or unstable injury such as a depressed skull fracture, vertebral fracture, or subluxation is identified. Because plain radiographic studies are unable to identify intracranial injuries or exclude spinal injuries, CT is required whenever aspects of the clinical presentation suggest the presence of significant injury. Retrospective studies suggest that when patients have such minor trauma or symptoms that cervical spine plain radiography is ordered, instead of CT, the images are of little clinical benefit.1
Computed Tomography
Computed tomography (CT) is the most widely used imaging modality for evaluating critically ill patients. CT is widely available, rapid, and accurate and has virtually no contraindications in the acute setting. The utility of CT is increased by multiple modifications, including the use of contrast, windowing techniques, and image-reconstruction techniques. Iodinated contrast agents given intravenously (IV) visualize lesions that disrupt the blood-brain barrier as well as normal and abnormal vascular structures. Varying the grayscale “window level” improves the evaluation of osseous and soft-tissue structures. Concerns about the long-term risks of malignancy from CT radiation exposure need to be considered in young patients and those likely to require repeated neuroimaging studies.2
Xenon CT tracks the diffusion of inhaled xenon gas to measure cerebral perfusion. Rapid CT scanning has also led to the development of CT perfusion studies that track IV contrast, providing estimates of cerebral blood volume (CBV), cerebral blood flow (CBF), and mean transit time. Although bolus tracking techniques are less quantitative than nuclear medicine studies such as xenon CT, positron emission tomography, and single-photon emission computed tomography (SPECT), they are more widely available. Perfusion studies are increasingly used to evaluate vascular injuries3 and may have applications in the study of other diseases.
Magnetic Resonance Imaging
Magnetic resonance imaging (MRI) uses an intense magnetic field and radiofrequency pulses to produce images without the use of ionizing radiation. There are numerous MRI “sequences” for which imaging parameters are varied to highlight different tissue characteristics, identifying both anatomic and physiologic variations from normal. The availability of increasingly powerful MRI magnets and more refined methods for signal collection and processing have reduced imaging times and increased image clarity, sensitivity, and specificity.4 Gadolinium-based, noniodinated IV contrast agents are used to assess vascular integrity. Arterial spin labeling and contrast bolus tracking methods can be used to create MR angiography (MRA) and MR perfusion-weighted images (PWI).
Functional MRI (fMRI) can detect changes in blood flow and map the performance of cognitive tasks to areas of increased or decreased brain activity, but its use outside of research is limited to the presurgical workup of patients with tumors or focal epilepsy. Diffusion-weighted imaging (DWI) evaluates the directional movement of water molecules to assess tissues for increased diffusion, as occurs with decreased cell density (encephalomalacia) or increased extracellular water content (vasogenic edema), or decreased or restricted diffusion, as occurs with increased water content within injured cells (cytotoxic edema) or between layers of injured myelin. DWI is very useful for early identification of acute ischemic stroke, for the differentiation of necrotic tumor from pyogenic abscess, and in evaluation of the cellularity and grade of tumors.5–7 PWI studies are used to look for an ischemic penumbra around an area of infarction that might remain viable and respond to reperfusion or neuroprotection. Patients with an area of poor perfusion much larger than their area of diffusion restriction (DWI/PWI mismatch) are more likely to respond favorably to interventional thrombectomy,8 but there is still little agreement as to how to measure core and penumbral tissues.9
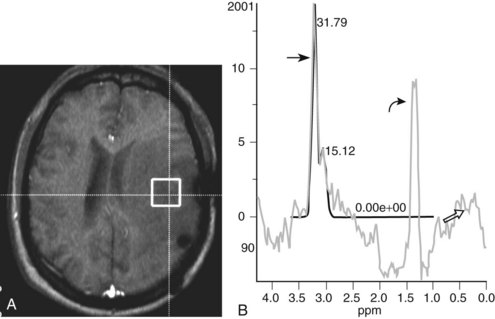
Magnetic resonance spectroscopy (MRS) can noninvasively measure brain metabolites in a small volume (voxel) of tissue. Carbon and phosphorous spectroscopy have shown promising applications in research, but proton spectroscopy is more commonly used. Current applications include assessing the severity of traumatic and ischemic injuries, characterizing tumors and differentiating them from infections, demyelination, and postradiation injury, and evaluating patients with metabolic disorders.10,11 Diffusion tensor imaging (DTI), which measures the diffusion of water molecules along a higher number of planes than conventional DWI in order to assess the directionality of fiber tracts, is an emerging technology for visualizing the relationship between mass lesions and large, projecting fiber tracts, such as the visual and corticospinal tracts, and for monitoring the severity and evolution of axonal injuries.12
The disadvantages of performing MRI on critical care patients include the need for preprocedural preparation and screening. Patients must be screened carefully for the presence of implanted devices and ferromagnetic metal fragments or prostheses that may preclude their exposure to the powerful magnetic field used in MRI.13 The website www.MRIsafety.com is a useful resource for checking the MRI compatibility of particular medical devices. Respirators and physiologic monitors must also be MRI compatible. Only oxygen and nitrogen tanks composed of aluminum can enter the magnet suite. All these precautions and modifications can significantly delay imaging. There are protocols to rapidly evaluate patients with suspected acute stroke, but most routine MRI studies take approximately 45 minutes to perform, and studies of the entire neuroaxis with and without contrast can require more than 90 minutes. Critically ill patients are often unable to tolerate MRI until they are more hemodynamically stable.
Nuclear Medicine Studies
Nuclear medicine techniques provide somewhat quantitative physiologic imaging of the brain. PET measures the distribution of radioisotope-containing compounds (e.g., 8F-fluorodeoxyglucose [FDG]) that are given IV and can study cerebral perfusion as well as cerebral energy metabolism. SPECT can study the distribution of isotopes incorporated into other biologically active compounds, allowing measurement of other aspects of tissue metabolism.14 PET studies provide higher-resolution images that can more easily be co-registered with MRI, but PET can only be done in hospitals with their own cyclotrons, as the isotopes used have shorter half-lives than those used for SPECT. The most common application of PET is in the diagnosis, staging, and monitoring of tumors, although other applications are undergoing evaluation.15,16 SPECT using technetium-99m hexamethylpropyleneamine oxime (99mTc-HMPAO) is often used to assess overall CBF as a confirmatory test in the determination of brain death.17
Angiography
Percutaneous transfemoral catheterization is used to evaluate cerebral and spinal vascular anatomy. It is an invasive procedure but has a fairly low rate of complications in experienced centers, with most complications being minor and transient, such as groin hematoma, asymptomatic femoral artery or carotid artery dissections, and minor allergic reactions.18 Permanent neurologic complications such as cerebral infarction due to thromboembolism are rare with diagnostic procedures but occur more often in older patients, with prolonged study times, and when angiography is used for interventional procedures such as intraarterial thrombolysis or thrombectomy, balloon angioplasty for patients with subarachnoid hemorrhage–associated vasospasm, and occlusion of aneurysms and arteriovenous malformations.19
 Brain
Brain
Patterns of Disease
Edema
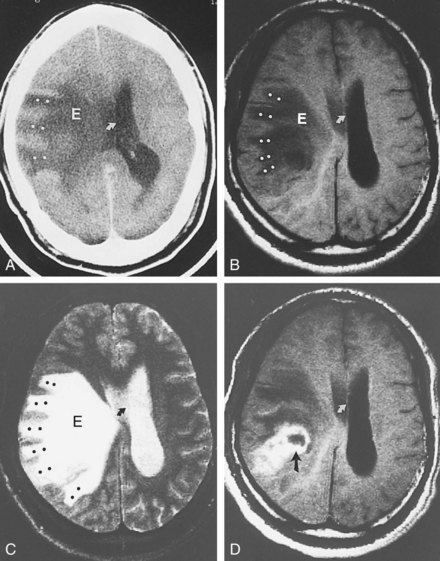
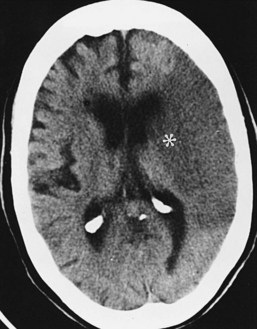
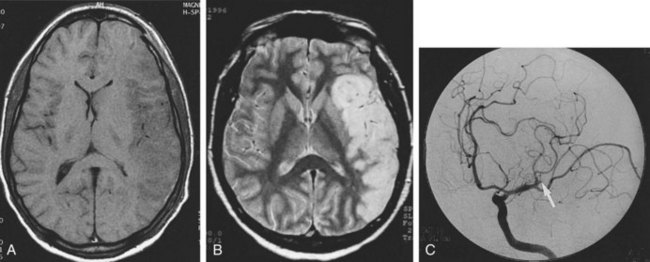
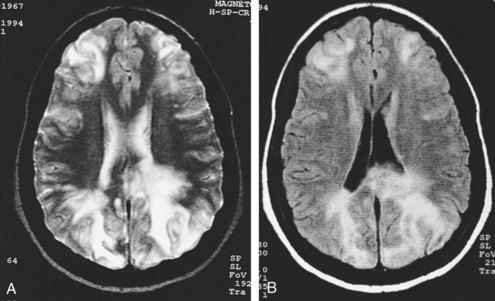
Except for location, the CT and MRI appearance of all types of edema is similar. Increased water content appears dark on CT because of hypodensity. It also appears dark on T1-weighted imaging (T1WI) but bright on T2-weighted imaging (T2WI) sequences, including fluid-attenuated inversion recovery (FLAIR) studies in which CSF in the ventricles, cisterns, and arachnoid spaces is made to appear dark. Vasogenic edema within the white matter extends along fiber tracts, creating “fingers” that extend toward the cortical gray matter (Figure 40-1). This pattern has a nonvascular distribution and is associated with mass effect. Cytotoxic edema can involve gray and white matter, follows a vascular distribution when associated with ischemic injury, and produces less mass effect for its size (Figure 40-2). DWI can distinguish between the increased diffusivity of vasogenic edema and the resticted diffusivity of cytotoxic edema. Interstitial edema may be limited to a narrow rim that abuts the ventricular wall and fades gradually into the surrounding white matter and is best seen on MRI, particularly with FLAIR sequences.20 Engorgement caused by increased arterial or venous CBV, often localized when associated with an arteriovenous dural fistula, can mimic edema on routine imaging studies but is apparent on cerebral perfusion studies.21
Hemorrhage
The imaging appearance of hemorrhage depends on the stage of clot formation and lysis, location, and the degree to which it is mixed with other fluids. On CT, hemorrhage may be isodense to brain parenchyma and difficult to visualize in the hyperacute stage, but it typically becomes hyperdense within several hours (Figure 40-3, A) before again becoming isodense over days to weeks and then hypodense over several weeks (Table 40-1). Acute hematomas may continue to appear isodense in the acute stage in anemic patients with a hemoglobin (Hb) below 8 to 10 g/dL or in patients with a coagulopathy who fail to produce clot retraction.22,23 The final CT appearance of resolved hemorrhage may show no residual abnormality or demonstrate a focus of low attenuation or calcification.
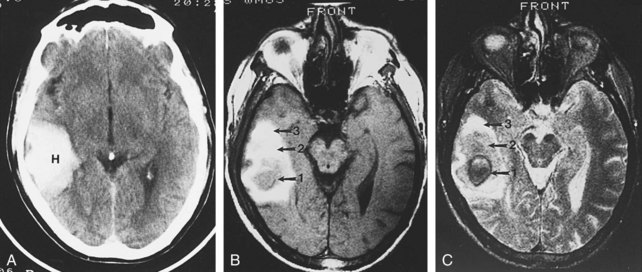
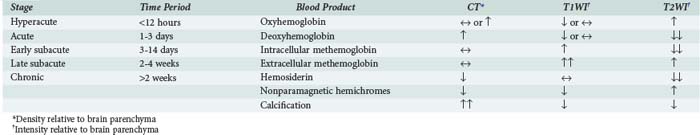
On MRI, the evolving appearance of a hemorrhage is largely explained by Hb having different paramagnetic properties as it is deoxygenated and metabolized. In the hyperacute to acute stages, diamagnetic oxyhemoglobin is predominant and appears slightly hypo- to isointense on T1WI and iso- to hyperintense on T2WI. As Hb becomes deoxygenated, it becomes paramagnetic and very hypointense on T2WI. In the subacute stage, Hb breakdown to methemoglobin begins peripherally and advances toward the center of the clot. Intracellular methemoglobin appears hyperintense on T1WI and hypointense on T2WI. As red blood cells lyse and release methemoglobin into the extracellular space, its signal becomes hyperintense on T1WI and T2WI. In the chronic stage, beginning within 2 weeks and lasting for years, methemoglobin undergoes phagocytic degradation to hemosiderin, which appears hypointense on T1WI and T2WI.7 The evolution of a hematoma is influenced by many factors, and there may be simultaneous overlap of two or more of these stages (see Figure 40-3, B and C). The widespread use of the gradient-recalled echo (GRE) sequence, and the increasing use of susceptibility-weighted imaging (SWI) sequences, has greatly increased the sensitivity of MRI for extravasated blood.24
Most intraparenchymal hematomas are associated with a surrounding area of vasogenic edema and evolve somewhat more quickly (owing to higher tissue thromboplastin concentration and lower oxygen tension) than extraaxial blood collections. Intraparenchymal hematomas expand significantly, usually within 3 hours from onset, in about one-third of patients,25 and contrast extravasation into the hematoma on CT is predictive of expansion.26 Vasogenic edema surrounding an intraparenchymal hematoma can also expand over several days, causing a significant increase in mass effect.
Mass Effect, Shift, and Herniation
Cerebral lesions may lead to brain herniation, either as a direct result of lesion growth, as with tumor growth or hematoma expansion, or secondary to intralesional cytotoxic edema, perilesional vasogenic edema, or obstructive hydrocephalus.27 Two relatively fixed dural partitions are present within the skull and create compartments across which the brain may herniate. The falx cerebri separates the cerebral hemispheres, and the tentorium cerebelli separates the cerebral hemispheres from the posterior fossa structures. Herniation is described in terms of location.
Subfalcine herniation occurs when the medial surface of a hemisphere, usually the cingulate or supracingulate gyrus, is compressed against and displaced beneath the falx. With CT or MRI, early signs may appear as compression or distortion of the lateral ventricles (see Figure 40-1). Later stages are recognized by deviation of the falx, identification of the hemispheric structures that are crossing the midline, and ischemia from compression of the anterior cerebral artery.
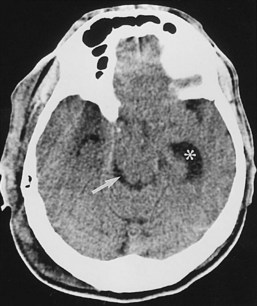
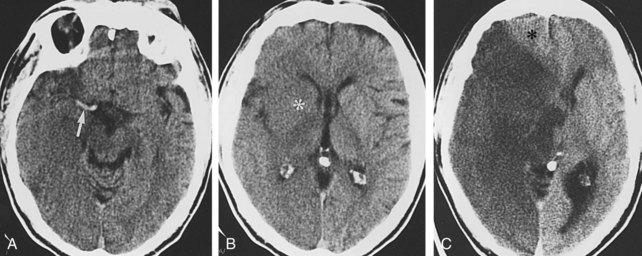
Masses arising on either side of the tentorium can result in transtentorial herniation. Descending transtentorial herniation involves a supratentorial mass pushing the medial temporal lobe through the incisura. On CT or MRI, the herniated brain pushes against and rotates the brainstem. This produces widening of the ipsilateral brainstem cistern and effacement of the contralateral cistern (Figure 40-4). Associated findings may include dilatation of the contralateral temporal horn secondary to ventricular trapping. Ascending transtentorial herniation is caused by an infratentorial mass displacing the pons, vermis, and adjacent portions of the cerebellar hemispheres upward through the incisura. On CT and MRI, the brainstem cisterns are symmetrically effaced as the cerebellar vermis bulges up through the incisura. This is often associated with acute hydrocephalus caused by compression of the cerebral aqueduct.
Specific Disease Processes
Traumatic Brain Injury
Noncontrast head CT continues to be the primary modality for the initial evaluation of patients with traumatic brain injury (TBI).28 Its advantages include fast examination time, wide availability, fracture detection, lack of contraindications, and high accuracy. Although MRI is more sensitive in detecting intracranial injuries, it is limited by longer examination times, need for sedation in uncooperative patients, and difficulties with monitoring potentially hemodynamically unstable patients. Once patients have been stabilized, MRI becomes the modality of choice for fully elucidating the nature and extent of the injury and for informing prognosis.29
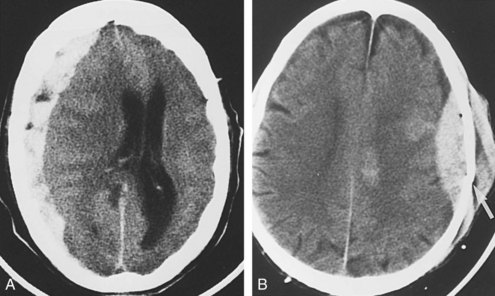
Damage to the brain coverings may lead to hemorrhage into the epidural, subdural, and subarachnoid (and, by extension, intraventricular) spaces. On CT, intraventricular and subarachnoid hemorrhage is identified by replacement of the normal low-density CSF by high-density blood. When subtle, subarachnoid hemorrhage can be mistaken for generalized edema, with loss of the basal cisterns. Subdural hematomas typically appear as crescentic mixed or hyperdense collections that cross suture lines but not dural attachments (Figure 40-5, A). Epidural hematomas typically appear as biconvex hyperdense collections that cross dural attachments but not suture lines (see Figure 40-5, B). With rapid accumulation of blood, unretracted semiliquid clot may be present. In this situation, CT demonstrates hypodense areas within the hyperdense hematoma, the so-called swirl sign.30 Distinction between epidural and subdural hematomas is important, because epidural hematomas often have an arterial source, expand rapidly, and require emergent drainage to avoid herniation.31
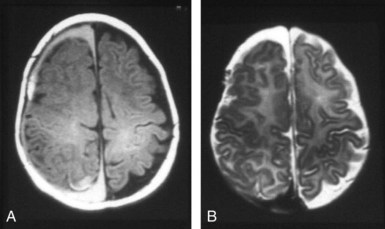
Abusive head trauma (AHT) is a significant cause of neurodevelopmental morbidity and mortality in children younger than 2 years old.32 Mechanisms that have been proposed include blunt trauma, axonal shearing from shaking, and secondary ischemic injury from strangulation, arterial dissection, suffocation, or brainstem injury leading to respiratory arrest. Intracranial injuries commonly encountered include skull fracture, subdural hematoma, subarachnoid hemorrhage, and shear injuries. Subdural hematoma is regarded as one of the most characteristic CNS lesions encountered in the “shaken baby” syndrome. In fact, subdural hematomas in young children are more often associated with AHT than with accidental trauma.32 The CT appearance of AHT in children is similar to that in adults. However, subdural hematoma is more common along the posterior interhemispheric fissure and appears as increased attenuation along the falx. Other common locations include the anterior interhemispheric, tentorial, and parieto-occipital regions. MRI can determine the age of the blood products and provide an estimate of when the hemorrhage occurred, as discussed earlier. Coexistence of blood products of different ages (Figure 40-6) is suggestive of recurrent bleeding and repeated abuse but must be interpreted with great caution.7
Vascular Lesions
Ischemia, Hypoxia, and Infarct
Although CT demonstrates only about half of infarcts within the first 48 hours, it remains the imaging modality of choice in the acute evaluation of patients with transient or persistent focal neurologic deficits that may be associated with cerebral ischemia, because rapid exclusion of a hemorrhagic etiology is critical in determining whether a patient can be treated with thrombolytic agents.33 CT can in some cases confirm the thromboembolic etiology of an ischemic stroke by showing subtle cerebral edema in a vascular distribution or by showing hyperdense clot within a thrombosed artery. It can also be immediately helpful in demonstrating mass lesions such as tumors, infections, and vascular lesions that can produce symptoms that mimic stroke and may require emergent surgical treatment.5 Small lacunar infarcts and infratentorial strokes are more difficult to visualize by CT.34
The CT appearance of an ischemic injury evolves over time. In the hyperacute stage (first 24 hours), the CT scan may be normal or demonstrate a subtle decrease in density and loss of gray-white differentiation (Figure 40-7). An artery obstructed by thromboembolism may appear hyperdense. During the acute stage (within the first week), the infarct becomes more pronounced owing to the mass effect and decreased density related to cytotoxic edema (see Figure 40-2). The infarct is better defined, involves gray and white matter, and corresponds to a known vascular territory. During the subacute stage (1–3 weeks), the edema and mass effect begin to resolve. Chronic infarcts demonstrate parenchymal replacement, with well-defined, sharply marginated zones of cystic encephalomalacia and gliosis. The infarct behaves like a contracting rather than an expanding mass.
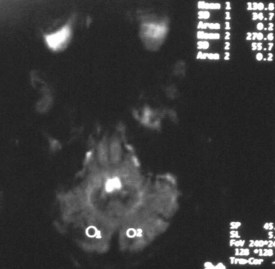
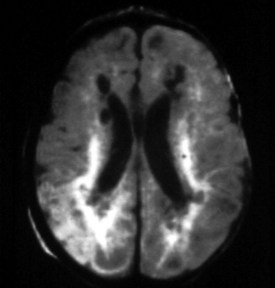
The MRI appearance of an ischemic infarct also evolves in a predictable fashion (Figure 40-8). Nonhemorrhagic infarcts begin with subtle increased signal intensity on T2WI and minimal changes on T1WI. Subtle findings include stagnation of blood flow (arterial enhancement) and swelling of the involved gyri. DWI (Figure 40-9) can show cytotoxic edema within minutes of the onset of a stroke, and the intensity of the abnormal signal is typically maximal at 3 to 5 days and then gradually fades over another 1 to 2 weeks. Because DWI shows directionally restricted water movement as a bright signal but also shows bright signal in areas that are bright on T2WI (T2 shine through), the presence of cytotoxic edema is best evaluated by the apparent diffusion coefficient (ADC) map, in which brain regions with fully restricted water diffusion appear darker than surrounding brain.
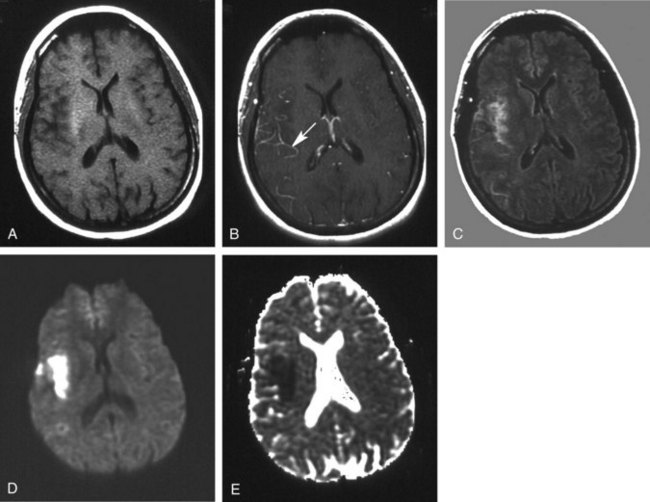
CT and MRI perfusion techniques can demonstrate diminished blood perfusion within minutes of an insult. When MRI perfusion studies are coupled with diffusion images, a penumbra can be identified as a zone of decreased perfusion surrounding an area of absent perfusion (Figure 40-10). Only the central area shows the diffusion restriction. The penumbra represents viable tissue at risk for infarction, which may still be salvageable.9
Imaging protocols that use a number of MRI sequences for acute evaluation of a suspected stroke may provide the ideal combination of information about regional anatomy (standard MRI), presence of blood (GRE or SWI), extent of infarction (DWI), vascular anatomy (MRA), blood flow (PWI), and metabolic alterations (MRS) (see Figure 40-10). The feasibility of using such protocols continues to be studied.35
Hypertensive encephalopathy is a syndrome that occurs in patients with elevated blood pressure of any cause. Severe preeclampsia and eclampsia of pregnancy are the most common causes, and CNS involvement is common. MRI findings include symmetric vasogenic edema in the subcortical white matter, primarily in the occipital and parietal lobes but occasionally extending into the frontal lobes. Radiologically similar lesions, referred to as posterior reversible encephalopathy syndrome (PRES), have been seen in association with a number of other conditions, including thrombotic thrombocytopenic purpura, sepsis, glomerulonephritis, and exposure to the immunosuppressants, cyclosporine and tacrolimus. The association with hypertension led to the presumption that edema was secondary to hyperemia and blood-brain barrier breakdown, but nearly half of patients with PRES lack a history of even moderate hypertension, and most perfusion studies have shown decreased perfusion in the areas of edema, rather than hyperemia, and the typical watershed distribution of the lesions is consistent with hypoperfusion contributing somewhat to the pathophysiology.36 In 15% to 25% of cases, cytotoxic edema and hemorrhage are also seen, and these patients are less likely to show the typical reversibility of the associated clinical symptoms.37 Brief episodes of severe hypotension, hypoxia, and hypoglycemia will typically result in infarction within a similar watershed distribution, whereas more prolonged episodes will cause progressively more severe injuries to the basal ganglia, thalami, hippocampi, cerebellum, and brainstem.38
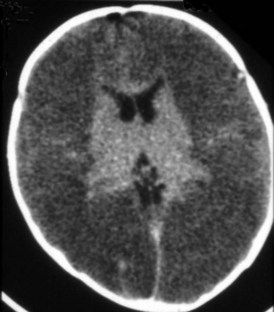
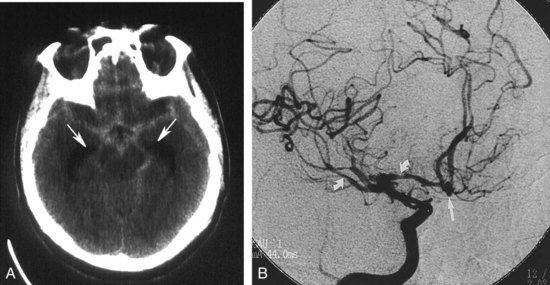
Imaging of newborns and children with cerebrovascular disease must take into account the imaging changes that occur with development. In general, the brain of a term infant has its greatest myelination and metabolic activity in the brainstem, basal ganglia, cerebellum, and perirolandic cortex. Global hypoxic-ischemic injuries in term neonates are most commonly seen in these areas, particularly in the specific regions with the highest expression of excitatory NMDA receptors, including the putamina, ventrolateral thalamic nuclei, lateral geniculate bodies, dorsal brainstem nuclei, hippocampi, and perirolandic cortex.39 Because of the greater propensity for the injured cells of neonates to undergo apoptosis, the full extent of an ischemic injury may not be apparent on MRI for at least 72 hours. During a child’s first year, as cerebral myelination proceeds from inferior to superior and posterior to anterior, the patterns of injury seen from vascular insults become more similar to those seen in older children and adults, with selective vulnerability seen in the striatum, lateral geniculate bodies, hippocampi, and frontal and parieto-occipital cortex, with sparing in moderate injuries of the thalami and perirolandic cortex.38 The relative sparing of the cerebellum, even with severe global hypoxic-ischemic injury of the cerebral hemispheres, can result in a “cerebellar reversal” sign on CT (Figure 40-11) in which the supratentorial structures all appear hypodense in comparison to the cerebellum.40
In the preterm brain, early imaging findings after an anoxic event include germinal matrix hemorrhage, periventricular venous infarction, and periventricular leukomalacia. The germinal matrix is a rich vascular stroma in the subependymal caudothalamic groove that is very vulnerable to hemorrhage. When an insult occurs, the germinal matrix bursts, and blood leaks into the ventricles or parenchyma. Ultrasonography is used to stage the degree of hemorrhage. Venous infarctions are similar to those discussed earlier but occur in the periventricular region. These focal hemorrhages are readily seen with MRI and are frequently seen with CT. Periventricular leukomalacia represents areas of coagulation necrosis of the white matter, leading to reduction of the central white matter. CT and MRI demonstrate loss of white matter in the parietal and occipital regions, and enlargement of the ventricles, with ragged borders (Figure 40-12). Cystic areas may be present, and the sulci may extend almost to the ventricles.38
Congenital Aneurysm and Subarachnoid Hemorrhage
Evaluation of a patient with suspected subarachnoid hemorrhage should begin with a noncontrast head CT (Figure 40-13). If subarachnoid blood is confirmed by CT or lumbar puncture, a conventional angiographic study is done to assess the patient for the presence of cerebral aneurysms (see Figure 40-13). MRA and CTA may be helpful in the evaluation of patients suspected of having unruptured aneurysms but are insufficiently sensitive to exclude an aneurysmal source of bleeding.41 In addition, when one or more aneurysms are present, conventional angiography provides the superior anatomic detail needed for planning endovascular occlusion or surgical treatment.
From 10% to 30% of patients with aneurysmal subarachnoid hemorrhage will develop morbidity from a delayed ischemic neurologic deficit from vasospasm, but many such patients are obtunded or sedated and are clinically difficult to assess for new deficits. A combination of imaging modalities may be best for identifying patients with vasospasm and ischemia.42 Angiographic studies show vasospasm in most patients and do not clearly differentiate between patients with symptomatic and asymptomatic narrowing. TCD is commonly used to identify vessels with increased blood flow velocity from narrowing, but comparison between TCD and xenon CT has shown that increased velocity is commonly associated with increased rather than decreased flow.43 Transluminal balloon angioplasty and intraarterial papaverine infusion improve outcomes for patients with symptomatic vasospasm, and several other interventional techniques are under investigation.44,45
Vascular Malformations
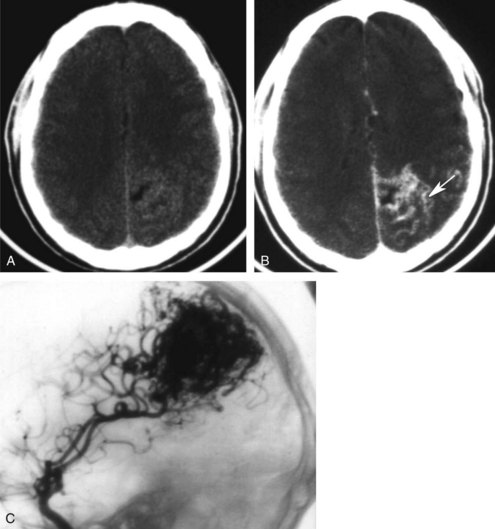
AVMs are the most common type. The vessels of an unruptured AVM may be apparent on CT as tubular structures that become hyperdense with contrast administration. On MRI, the abnormal vessels may appear hypointense due to blood flow. Conventional angiography is preferred for the evaluation of suspected AVMs to differentiate them from arteriovenous fistulas, identify associated aneurysms, and provide a detailed assessment of the number, size, and location of feeding arteries and draining veins (Figure 40-14).46 The interventional radiologist may be able to embolize some or all of the arterial feeders, making surgery either less complex or unneccesary.47
DVAs are composed of a large draining vein surrounded by a caput medusae of small feeding veins. The veins are typically inapparent on non-contrast-enhanced CT but enhance with contrast and can be seen on conventional MRI as flow voids. DVAs are rarely symptomatic other than when associated with a cavernous angioma or AVM, and conventional angiography is recommended only when an apparently simple DVA is associated with hemorrhage or edema that cannot be explained by thrombosis of the draining vein.48
Neoplasms
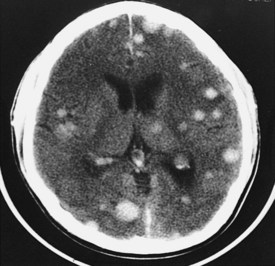
Neoplasms are typically grouped according to location. Knowledge of the imaging characteristics of specific tumors, age and gender of the patient, clinical presentation, and lesion location can narrow the differential diagnosis further and often provides a specific diagnosis. On CT, low-grade gliomas may appear as subtle nonenhancing masses, but higher-grade gliomas often demonstrate heterogeneous enhancement, with large areas of necrosis and vasogenic edema (see Figure 40-1). Metastatic lesions may be low-density and enhancing masses, as seen with lung or breast carcinoma, or they may have high density secondary to hemorrhagic components, as seen with melanomas and thyroid or renal cell carcinomas (Figure 40-15). Cystic tumors such as cystic astrocytomas may be composed of large cysts with the density of CSF (Figure 40-16). Epidermoid and dermoid tumors frequently contain areas of fat density that appear hypodense to CSF.
MRI has high sensitivity but low specificity in the evaluation of neoplasms, because most tumors appear similar. Tumors are typically of low intensity on T1WI and high intensity on T2WI (see Figure 40-1), although there are a few exceptions. Advanced imaging techniques have many applications in the study of brain tumors.15 DWI and MRS are helpful in presurgical grading, selection of optimal biopsy sites, determining the extent of subtle dissemination, and monitoring the response to therapy.49 DTI and fMRI have proven useful in visualizing the relation between eloquent cortex and critical white matter tracts around tumors, which can aid in defining and minimizing risk of morbidity from resection.50 MRS and DWI can help in distinguishing delayed treatment effects like postradiation ischemic necrosis from tumor recurrence, which can both show contrast-enhancing hyperintensity on conventional T2WI.10 PET studies show CBF, glucose consumption, and oxygen metabolism to be increased in recurrent tumor and decreased in necrosis.51
Infection and Inflammation
Parenchymal Infection
Parenchymal infections include encephalitis and pyogenic abscess. Encephalitis, a diffuse inflammation of the brain, is often viral or toxic in origin. Conventional CT and MRI may initially appear normal but later show areas of cortical edema or hemorrhage. DWI is often able to show areas of diffusion restriction early in the disease, making it important to include in the evaluation of patients with suspected encephalitis.6 The herpes simplex virus (HSV) shows a strong predilection for the temporal, insular, and cingulate regions in older children and adults but a more variable degree of involvement of cortex and deep grey matter in neonates.52 Acute disseminated encephalomyelitis (ADEM) is an immune-mediated encephalitis that typically occurs in response to a previous viral infection or vaccination but which may also be the initial presentation of a patient with multiple sclerosis. MRI with contrast is considerably more sensitive than CT for detecting the demyelination and edema most often seen in the bilateral deep white matter but may in some cases primarily affect the deep gray matter or present with a single mass-like (tumefactive) lesion. The combined information from conventional MRI, DWI, MRS, and perfusion studies may allow for the noninvasive discrimination of tumefactive demyelination from other mass lesions such as lymphoma, metastatic tumor, primary brain tumor, or pyogenic abscess.53
Cerebral abscess results from liquefactive necrosis, producing a localized collection of pus or caseous material in a cavity surrounded by a fibrous capsule. On CT, the abscess cavity demonstrates central hypodensity (necrotic cavity), a thin isodense wall (capsule), and surrounding low density (edema). Following contrast administration, there is enhancement of the capsule. Unlike the shaggy irregular walls of a tumor, the walls of an abscess are typically smooth, well defined, and uniform in thickness; these are important differential features. MRI findings are similar to CT findings. The central cavity has variable signal characteristics, depending on its contents. The capsule is iso- to hyperintense on T1WI, hypointense on T2WI, and enhances after contrast administration. Pyogenic abscess almost always shows hyperintensity on DWI, differentiating it from most nonpyogenic lesions, but MR spectroscopy can also be used to investigate lesions of uncertain significance.6
White Matter and Metabolic Diseases
Most white matter diseases can be classified as dysmyelinating (myelin is improperly formed or maintained) or demyelinating (myelin is destroyed after being properly formed). Dysmyelinating disorders include the leukodystrophies and storage diseases. Demyelinating disorders can be auto-immune (ADEM and multiple sclerosis), infectious (progressive multifocal leukoencephalopathy, subacute sclerosing panencephalitis), toxic-degenerative, or vascular. MRI is much more sensitive than CT and is the study of choice for determining the presence and extent of white matter disease (Figure 40-17). These lesions appear hypointense on T1WI and hyperintense on standard T2WI and on FLAIR sequences, which increase the conspicuity of subependymal white matter lesions. The majority of white matter diseases appear similar on imaging studies.
White matter diseases seldom present with acute encephalopathy, other than when there are exacerbations and complications during their usually slowly progressive course. When the presentation is acute, toxic and vascular causes of encephalopathy deserve primary consideration.54 Carbon monoxide poisoning causes hypoxic injury, visible early on as cytotoxic edema on DWI, with selective vulnerability in adults in the putamina, thalami, caudate heads, cerebellum, and cerebral white matter. Spectroscopy can show hypoxic demyelination in the white matter, with elevated Cho and decreased NAA.55 Severe and chronic malnutrition with thiamine deficiency, often associated in developed societies with alcoholism but also seen with hyperemesis gravidarum, gastric bypass surgery, or chronic renal failure, can lead to Wernicke encephalopathy. The classic clinical triad of ophthalmoplegia, cerebellar ataxia, and confusion is not always present or recognized. MRI can show evidence of vasogenic edema, cytotoxic edema, or hemorrhage within the thalami, hypothalamus, periaqueductal dorsal midbrain, mamillary bodies, and medullary tectum.56 Methanol ingestion causes contrast-enhancing hemorrhagic necrosis of the bilateral caudate heads, putamina, pons, optic nerves, and subcortical white matter, which can lead to intraventricular hemorrhage and diffuse cerebral edema.57
Several immunosuppressive medications have been associated with PRES, as previously described. A number of chemotherapeutic agents have the potential to cause toxic demyelination. Intrathecally administered methotrexate has a particularly well-known risk of acute, subacute, and chronic forms of toxicity, typically seen as hyperintensity on T2WI in the periventricular and deep white matter but sometimes involving the cerebellar white matter and thalami.10 Osmotic myelinolysis occurs with rapid correction of a hypoosmolar state, commonly hyponatremia in alcoholic, malnourished, or dehydrated patients. MRI shows hyperintensity on T2WI, with or without diffusion restriction on DWI, involving the central pons but sparing the periphery. Extrapontine structures, including the thalami, basal ganglia, and deep white matter, can also be involved.58 Encephalopathy occurs with many types of chronic liver disease, such as alcoholic cirrhosis, hepatitis, and portal systemic shunts. MRI frequently demonstrates hyperintensity on T1WI in the basal ganglia, particularly the globus pallidi and subthalamic nuclei and in the midbrain. Hyperintensity on T2WI may be seen diffusely in the cortex, although there often is sparing of the perirolandic and occipital regions. MRI shows evidence of hypoosmolarity, with decreased Cho and mI peaks, but also shows an increase in signal from glutamine and glutamate.59
 Spine
Spine
Patterns of Disease
It is often useful to classify spinal canal pathology according to the three spinal compartments, or spaces: intramedullary, extramedullary-intradural, and extradural (Figure 40-18). Certain pathologic lesions occur with greater frequency in specific spaces; therefore, diagnostic considerations can be significantly narrowed if a lesion can be localized. In most instances, MRI is the modality of choice in evaluating spinal pathology. The high degree of tissue contrast and spatial resolution can localize most lesions to a specific compartment, determine the extent of disease, and suggest a differential diagnosis.60 The only exception is acute trauma, in which case bony alignment and stability are better demonstrated by plain radiography and CT.
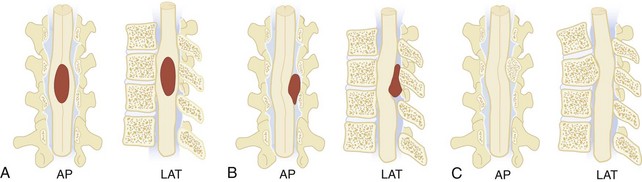
Intramedullary lesions expand the spinal cord as they enlarge, compressing the subarachnoid space, usually symmetrically (see Figure 40-18, A). If of sufficient size and chronicity, the intramedullary expansion may produce changes in the bony spinal canal, including posterior scalloping of the vertebral bodies, flattening of the spinous processes, widening of the interpeduncular distance, and overall widening of the canal. Intramedullary disease is usually neoplastic, and the most common tumors are gliomas (ependymoma, astrocytoma, glioblastoma), although other tumors (dermoid cysts, sarcomas, hemangioblastomas, and intramedullary metastases) can be seen. In the acute setting, intramedullary infectious (tuberculosis, bacterial abscess), inflammatory (sarcoidosis, transverse myelitis), and vascular insults must be considered.
Extramedullary-intradural lesions displace the arachnoid layer of the meninges but leave the dura in place such that the subarachnoid CSF flares out to form a “cap” at its interface with the lesion (see Figure 40-18, B). Meningiomas, nerve sheath tumors (neurofibromas and schwannomas), and other benign tumors (lipomas, dermoid and epidermoid tumors) account for the majority of lesions in this space, while more aggressive tumors (hemangiopericytomas), metastatic tumors, inflammatory disorders (arachnoiditis and sarcoidosis), vascular lesions (spinal-dural arteriovenous fistulas), and cystic lesions (perineural and arachnoid) are less commonly seen.61
Extradural lesions typically produce a more gradual displacement of the subarachnoid space and spinal cord (see Figure 40-18, C). Excluding disc disease, the most common extradural pathology is metastatic disease with epidural extension. Pathologic fractures of the involved vertebrae occur frequently and are often associated with spinal cord compression. Primary tumors of the spine and direct extension from paraspinal neoplasms make up the other malignant lesions of the extradural compartment; these include lymphomas, plasmacytomas, sarcomas, neuroblastomas and vertebral body chordomas. Benign lesions are uncommon in this compartment. Discitis and osteomyelitis with epidural abscess is an additional consideration.
Specific Disease Processes
Spinal Cord Injury
The sequence of performing the various imaging studies to evaluate spine injury remains controversial and is usually based on their availability at the particular trauma center. Initial evaluation usually involves a series of plain x-rays, which are able to identify most unstable injuries. Lateral and anteroposterior studies are sufficient for most thoracic and lumbar injuries, although oblique views are sometimes added for clarification; lateral, oblique, and odontoid views are typically ordered for cervical injuries. However, some vertebral fractures and misalignments are missed on these screening studies (Figure 40-19, A). CT with axial, coronal, and sagittal reconstructions should be considered whenever fractures are seen or suspected because of the severity of trauma or if the patient’s examination is unreliable owing to altered mental status or a distracting injury.62
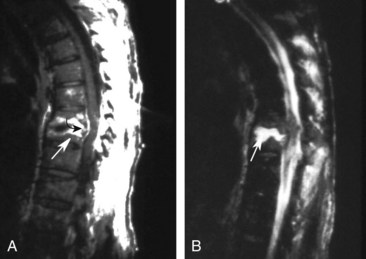
MRI is recommended when the patient has neurologic deficits, an unstable injury by prior imaging, or symptoms of an unstable injury despite a normal CT. MRI will rarely identify spinal injuries that require surgical stabilization in patients with no apparent neurologic deficits and a normal CT,63 but most studies suggest that spinal MRI is unnecessary even in obtunded and comatose trauma patients.64 MRI is the only imaging modality that can directly visualize intrinsic spinal cord and soft-tissue injuries. It can identify and distinguish between hemorrhagic (hematoma) and edematous (contusion) cord injuries. Cord hematoma has a poor prognosis and indicates a complete lesion, whereas localized edema has a better prognosis for functional recovery. Traumatic disc herniations can be readily identified. A disc herniation with cord compression can change management from nonsurgical to surgical or change a posterior stabilization approach to a combined anterior and posterior approach. MRI is also useful in detecting ligamentous injury by showing edematous changes or discontinuity in the ligaments. Although these findings are usually secondary, detection of isolated ligamentous injury may identify patients at risk for delayed instability. Epidural hematomas and the extent to which they compress the cord are also identified with MRI. Finally, although fractures are difficult to detect with MRI, the effect of bony fragment displacement and alignment abnormalities on the cord or nerve roots is elegantly seen with this modality (see Figure 40-19, D).
Spinal Infection
Infections involving the spine may involve the vertebral bodies (spondylitis), intervertebral discs (discitis), epidural and subdural spaces, or the spinal cord (myelitis, pyogenic cord abscess). In the management of spinal infections, delayed treatment can lead to increased morbidity and mortality, making early diagnosis critical. MRI is the primary imaging modality in all types of spinal infection because of its higher sensitivity and ability to detect changes earlier than plain films and CT.65
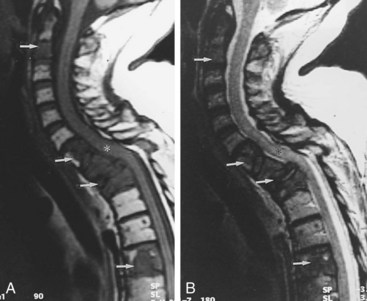
In spondylitis, involvement is seen in at least one entire spinal segment composed of two consecutive vertebrae and the intervening disc. Characteristic MRI findings include narrowing of the disc space, contrast enhancement, hypointensity on T1WI in the vertebral bodies, and hyperintensity on T2WI in the vertebral bodies and disc (Figure 40-20). These findings may not be present early, however, and can be mimicked by noninfectious processes. Skip lesions and associated large paraspinal abscesses are very suggestive of mycobacterial infection. Nuclear medicine studies such as FDG PET may be particularly useful in evaluating patients suspected of having chronic spondylitis or infected surgical hardware.66 Although MRI is sensitive in defining areas of myelitis, the findings are nonspecific and resemble those of other noninfectious and demyelinating disorders. Typically, focal or diffuse areas of hyperintensity are seen on T2WI with variable contrast enhancement.67
Neoplasm
Neoplasms involving the spinal axis typically present with progressive symptoms of myelopathy or cord compression. MRI is the primary modality for the evaluation of any suspected spinal tumor. It can demonstrate the location, extent, and nature of most tumors, regardless of the compartment of origin. Primary tumors of the bony elements and direct extension from paraspinal neoplasms are also easily identified with MRI.68
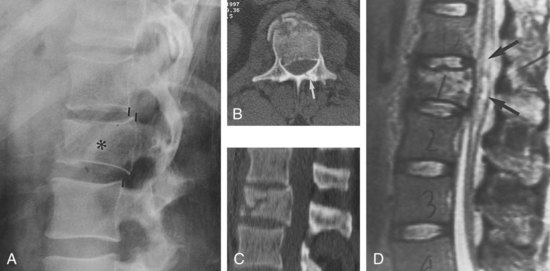
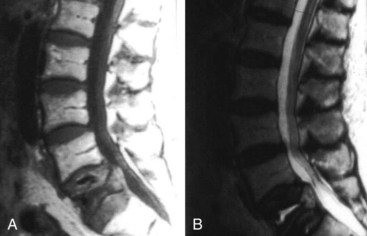
The spinal column is among the most common sites of tumor metastasis, third only to the lungs and liver. The most common primary tumor sites responsible for spinal metastasis are breast, prostate, thyroid, lung, and kidney. Plain radiographs can suggest the presence of spinal metastasis, with a blurred outline or generally moth-eaten appearance of a vertebral body suggesting diffuse cortical destruction. Focal bone loss that involves the posterior wall of the vertebral body is fairly indicative of neoplasia. Vertebral collapse is more likely to be due to neoplasia than degenerative disease when there is unilateral bone destruction, irregular or angular distortion of the vertebral endplates, involvement of the upper thoracic spine, a soft-tissue mass, or pedicle destruction.69 CT is more sensitive than plain radiography for many of these features, and MRI is yet more sensitive, particularly for epidural and paraspinous soft-tissue involvement and cord compression. The bone marrow of vertebral bodies with neoplastic infiltration appears hypointense on T1WI and hyperintense on T2WI (Figure 40-21). The bone marrow of vertebral fractures with benign fractures has normal imaging characteristics (Figure 40-22).
Key Points
Vezina G. Assessment of the nature and age of subdural collections in nonaccidental head injury with CT and MRI. Pediatr Radiol. 2009;39(6):586-590.
Wardlaw JM. Neuroimaging in acute ischaemic stroke: insights into unanswered questions of pathophysiology. J Intern Med. 2010;267(2):172-190.
Huang BY, Castillo M. Hypoxic-ischemic brain injury: imaging findings from birth to adulthood. Radiographics. 2008;28(2):417-439.
Arora A, Neema M, Stankiewicz J, et al. Neuroimaging of toxic and metabolic disorders. Semin Neurol. 2008;28(4):495-510.
Menaker J, Philp A, Boswell S, Scalea TM. Computed tomography alone for cervical spine clearance in the unreliable patient—are we there yet? J Trauma. 2008;64(4):898-903.
1 Lange BB, Penkar P, Binder WD, Novelline RA. Are cervical spine radiograph examinations useful in patients with low clinical suspicion of cervical spine fracture? An experience with 254 cases. Emerg Radiol. 2010 May;17(3):191-193.
2 Brenner DJ. Should we be concerned about the rapid increase in CT usage? Rev Environ Health. 2010 Jan-Mar;25(1):63-68.
3 Paciaroni M, Caso V, Agnelli G. The concept of ischemic penumbra in acute stroke and therapeutic opportunities. Eur Neurol. 2009;61(6):321-330.
4 Moseley ME, Liu C, Rodriguez S, Brosnan T. Advances in magnetic resonance neuroimaging. Neurol Clin. 2009 Feb;27(1):1-19. xiii
5 Chalela JA, Kidwell CS, Nentwich LM, et al. Magnetic resonance imaging and computed tomography in emergency assessment of patients with suspected acute stroke: a prospective comparison. Lancet. 2007 Jan 27;369(9558):293-298.
6 Kastrup O, Wanke I, Maschke M. Neuroimaging of infections. NeuroRx. 2005 Apr;2(2):324-332.
7 Vezina G. Assessment of the nature and age of subdural collections in nonaccidental head injury with CT and MRI. Pediatr Radiol. 2009 Jun;39(6):586-590.
8 Kidwell CS, Alger JR, Saver JL. Evolving paradigms in neuroimaging of the ischemic penumbra. Stroke. 2004 Nov;35(11 Suppl 1):2662-2665.
9 Wardlaw JM. Neuroimaging in acute ischaemic stroke: insights into unanswered questions of pathophysiology. J Intern Med. 2010 Feb;267(2):172-190.
10 Arora A, Neema M, Stankiewicz J, et al. Neuroimaging of toxic and metabolic disorders. Semin Neurol. 2008 Sep;28(4):495-510.
11 Soares DP, Law M. Magnetic resonance spectroscopy of the brain: review of metabolites and clinical applications. Clin Radiol. 2009 Jan;64(1):12-21.
12 Jang SH, Kim SH, Kim OL, Byun WM, Ahn SH. Corticospinal tract injury in patients with diffuse axonal injury: a diffusion tensor imaging study. NeuroRehabilitation. 2009;25(4):229-233.
13 Shellock FG, Crues JV. MR procedures: biologic effects, safety, and patient care. Radiology. 2004 Sep;232(3):635-652.
14 Masdeu JC, Arbizu J. Brain single photon emission computed tomography: technological aspects and clinical applications. Semin Neurol. 2008 Sep;28(4):423-434.
15 Mechtler L. Neuroimaging in neuro-oncology. Neurol Clin. 2009 Feb;27(1):171-201. ix
16 Podoloff DA, Ball DW, Ben-Josef E, et al. NCCN task force: clinical utility of PET in a variety of tumor types. J Natl Compr Canc Netw. 2009 Jun;7(Suppl 2):S1-26.
17 Heran MK, Heran NS, Shemie SD. A review of ancillary tests in evaluating brain death. Can J Neurol Sci. 2008 Sep;35(4):409-419.
18 Willinsky RA, Taylor SM, TerBrugge K, Farb RI, Tomlinson G, Montanera W. Neurologic complications of cerebral angiography: prospective analysis of 2,899 procedures and review of the literature. Radiology. 2003 May;227(2):522-528.
19 Dawkins AA, Evans AL, Wattam J, et al. Complications of cerebral angiography: a prospective analysis of 2,924 consecutive procedures. Neuroradiology. 2007 Sep;49(9):753-759.
20 Bradley WGJr. Diagnostic tools in hydrocephalus. Neurosurg Clin N Am. 2001 Oct;12(4):661-684. viii
21 Lagares A, Millan JM, Ramos A, Alen JA, Gallego JH. Perfusion computed tomography in a dural arteriovenous fistula presenting with focal signs: vascular congestion as a cause of reversible neurologic dysfunction. Neurosurgery. 2010 Jan;66(1):E226-E227. discussion E7
22 Deb S, Bhaumik S, Pal H. Isodense acute subdural haematoma in anaemic patients. Neurol India. 2000 Sep;48(3):298-299.
23 Claes F, Verhagen CV, Verhagen WI, Schaafsma E, Rongen RJ. Acute isodense intracerebral haematoma due to coagulopathy associated with prostate cancer. Clin Neurol Neurosurg. 2007 Jul;109(6):520-522.
24 Tong KA, Ashwal S, Holshouser BA, et al. Hemorrhagic shearing lesions in children and adolescents with posttraumatic diffuse axonal injury: improved detection and initial results. Radiology. 2003 May;227(2):332-339.
25 Kidwell CS, Wintermark M. Imaging of intracranial haemorrhage. Lancet Neurol. 2008 Mar;7(3):256-267.
26 Kim J, Smith A, Hemphill JC3rd, et al. Contrast extravasation on CT predicts mortality in primary intracerebral hemorrhage. AJNR Am J Neuroradiol. 2008 Mar;29(3):520-525.
27 Kalita J, Misra UK, Vajpeyee A, Phadke RV, Handique A, Salwani V. Brain herniations in patients with intracerebral hemorrhage. Acta Neurol Scand. 2009 Apr;119(4):254-260.
28 Le TH, Gean AD. Neuroimaging of traumatic brain injury. Mt Sinai J Med. 2009 Apr;76(2):145-162.
29 Ashwal S, Babikian T, Gardner-Nichols J, Freier MC, Tong KA, Holshouser BA. Susceptibility-weighted imaging and proton magnetic resonance spectroscopy in assessment of outcome after pediatric traumatic brain injury. Arch Phys Med Rehabil. 2006 Dec;87(12 Suppl 2):S50-S58.
30 Subramanian SK, Roszler MH, Gaudy B, Michael DB. Significance of computed tomography mixed density in traumatic extra-axial hemorrhage. Neurol Res. 2002 Mar;24(2):125-128.
31 Su IC, Wang KC, Huang SH, et al. Differential CT features of acute lentiform subdural hematoma and epidural hematoma. Clin Neurol Neurosurg. 2010 May 17.
32 Chiesa A, Duhaime AC. Abusive head trauma. Pediatr Clin North Am. 2009 Apr;56(2):317-331.
33 Hacke W, Kaste M, Fieschi C, et al. Randomised double-blind placebo-controlled trial of thrombolytic therapy with intravenous alteplase in acute ischaemic stroke (ECASS II). Second European-Australasian Acute Stroke Study Investigators. Lancet. 1998 Oct 17;352(9136):1245-1251.
34 Brazzelli M, Sandercock PA, Chappell FM, et al. Magnetic resonance imaging versus computed tomography for detection of acute vascular lesions in patients presenting with stroke symptoms. Cochrane Database Syst Rev. 2009(4):CD007424.
35 Breuer L, Schellinger PD, Huttner HB, et al. Feasibility and safety of magnetic resonance imaging-based thrombolysis in patients with stroke on awakening: initial single-centre experience. Int J Stroke. 2010 Apr;5(2):68-73.
36 Bartynski WS. Posterior reversible encephalopathy syndrome, part 2: controversies surrounding pathophysiology of vasogenic edema. AJNR Am J Neuroradiol. 2008 Jun;29(6):1043-1049.
37 Bartynski WS. Posterior reversible encephalopathy syndrome, part 1: fundamental imaging and clinical features. AJNR Am J Neuroradiol. 2008 Jun;29(6):1036-1042.
38 Huang BY, Castillo M. Hypoxic-ischemic brain injury: imaging findings from birth to adulthood. Radiographics. 2008 Mar-Apr;28(2):417-439. quiz 617
39 Lequin MH, Dudink J, Tong KA, Obenaus A. Magnetic resonance imaging in neonatal stroke. Semin Fetal Neonatal Med. 2009 Oct;14(5):299-310.
40 Rafaat KT, Spear RM, Kuelbs C, Parsapour K, Peterson B. Cranial computed tomographic findings in a large group of children with drowning: diagnostic, prognostic, and forensic implications. Pediatr Crit Care Med. 2008 Nov;9(6):567-572.
41 Dupont SA, Lanzino G, Wijdicks EF, Rabinstein AA. The use of clinical and routine imaging data to differentiate between aneurysmal and nonaneurysmal subarachnoid hemorrhage prior to angiography. J Neurosurg. 2010 May 21.
42 Carlson AP, Yonas H. Radiographic assessment of vasospasm after aneurysmal subarachnoid hemorrhage: the physiological perspective. Neurol Res. 2009 Jul;31(6):593-604.
43 Clyde BL, Resnick DK, Yonas H, Smith HA, Kaufmann AM. The relationship of blood velocity as measured by transcranial doppler ultrasonography to cerebral blood flow as determined by stable xenon computed tomographic studies after aneurysmal subarachnoid hemorrhage. Neurosurgery. 1996 May;38(5):896-904. discussion-5
44 Jabbour PM, Tjoumakaris SI, Rosenwasser RH. Endovascular management of intracranial aneurysms. Neurosurg Clin N Am. 2009 Oct;20(4):383-398.
45 Pierot L, Aggour M, Moret J. Vasospasm after aneurysmal subarachnoid hemorrhage: recent advances in endovascular management. Curr Opin Crit Care. 2010 Jan 21.
46 Geibprasert S, Pongpech S, Jiarakongmun P, Shroff MM, Armstrong DC, Krings T. Radiologic assessment of brain arteriovenous malformations: what clinicians need to know. Radiographics. 2010 Mar-Apr;30(2):483-501.
47 Strozyk D, Nogueira RG, Lavine SD. Endovascular treatment of intracranial arteriovenous malformation. Neurosurg Clin N Am. 2009 Oct;20(4):399-418.
48 Ruiz DS, Yilmaz H, Gailloud P. Cerebral developmental venous anomalies: current concepts. Ann Neurol. 2009 Sep;66(3):271-283.
49 Rossi A, Gandolfo C, Morana G, Severino M, Garre ML, Cama A. New MR sequences (diffusion, perfusion, spectroscopy) in brain tumours. Pediatr Radiol. 2010 Jun;40(6):999-1009.
50 Vezina LG. Imaging of central nervous system tumors in children: advances and limitations. J Child Neurol. 2008 Oct;23(10):1128-1135.
51 Yang I, Huh NG, Smith ZA, Han SJ, Parsa AT. Distinguishing glioma recurrence from treatment effect after radiochemotherapy and immunotherapy. Neurosurg Clin N Am. 2010 Jan;21(1):181-186.
52 Vossough A, Zimmerman RA, Bilaniuk LT, Schwartz EM. Imaging findings of neonatal herpes simplex virus type 2 encephalitis. Neuroradiology. 2008 Apr;50(4):355-366.
53 Al-Okaili RN, Krejza J, Woo JH, et al. Intraaxial brain masses: MR imaging-based diagnostic strategy–initial experience. Radiology. 2007 May;243(2):539-550.
54 Sharma P, Eesa M, Scott JN. Toxic and acquired metabolic encephalopathies: MRI appearance. AJR Am J Roentgenol. 2009 Sep;193(3):879-886.
55 Prockop LD, Chichkova RI. Carbon monoxide intoxication: an updated review. J Neurol Sci. 2007 Nov 15;262(1-2):122-130.
56 Chu K, Kang DW, Kim HJ, Lee YS, Park SH. Diffusion-weighted imaging abnormalities in wernicke encephalopathy: reversible cytotoxic edema? Arch Neurol. 2002 Jan;59(1):123-127.
57 Sefidbakht S, Rasekhi AR, Kamali K, et al. Methanol poisoning: acute MR and CT findings in nine patients. Neuroradiology. 2007 May;49(5):427-435.
58 Chu K, Kang DW, Ko SB, Kim M. Diffusion-weighted MR findings of central pontine and extrapontine myelinolysis. Acta Neurol Scand. 2001 Dec;104(6):385-388.
59 Grover VP, Dresner MA, Forton DM, et al. Current and future applications of magnetic resonance imaging and spectroscopy of the brain in hepatic encephalopathy. World J Gastroenterol. 2006 May 21;12(19):2969-2978.
60 Van Goethem JW, van den Hauwe L, Ozsarlak O, De Schepper AM, Parizel PM. Spinal tumors. Eur J Radiol. 2004 May;50(2):159-176.
61 Beall DP, Googe DJ, Emery RL, et al. Extramedullary intradural spinal tumors: a pictorial review. Curr Probl Diagn Radiol. 2007 Sep-Oct;36(5):185-198.
62 Egloff AM, Kadom N, Vezina G, Bulas D. Pediatric cervical spine trauma imaging: a practical approach. Pediatr Radiol. 2009 May;39(5):447-456.
63 Menaker J, Philp A, Boswell S, Scalea TM. Computed tomography alone for cervical spine clearance in the unreliable patient–are we there yet? J Trauma. 2008 Apr;64(4):898-903. discussion -4
64 Tomycz ND, Chew BG, Chang YF, et al. MRI is unnecessary to clear the cervical spine in obtunded/comatose trauma patients: the four-year experience of a level I trauma center. J Trauma. 2008 May;64(5):1258-1263.
65 James SL, Davies AM. Imaging of infectious spinal disorders in children and adults. Eur J Radiol. 2006 Apr;58(1):27-40.
66 El-Maghraby TA, Moustafa HM, Pauwels EK. Nuclear medicine methods for evaluation of skeletal infection among other diagnostic modalities. Q J Nucl Med Mol Imaging. 2006 Sep;50(3):167-192.
67 Hong SH, Choi JY, Lee JW, Kim NR, Choi JA, Kang HS. MR imaging assessment of the spine: infection or an imitation? Radiographics. 2009 Mar-Apr;29(2):599-612.
68 Rodallec MH, Feydy A, Larousserie F, et al. Diagnostic imaging of solitary tumors of the spine: what to do and say. Radiographics. 2008 Jul-Aug;28(4):1019-1041.
69 Guillevin R, Vallee JN, Lafitte F, Menuel C, Duverneuil NM, Chiras J. Spine metastasis imaging: review of the literature. J Neuroradiol. 2007 Dec;34(5):311-321.
