[level-membership-for-internal-medicine-category]

B. Water Balance

C. Replacement Fluids

D. Acid-Base Disorders
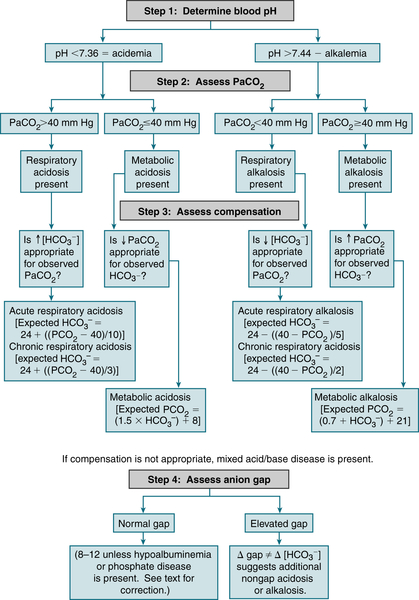
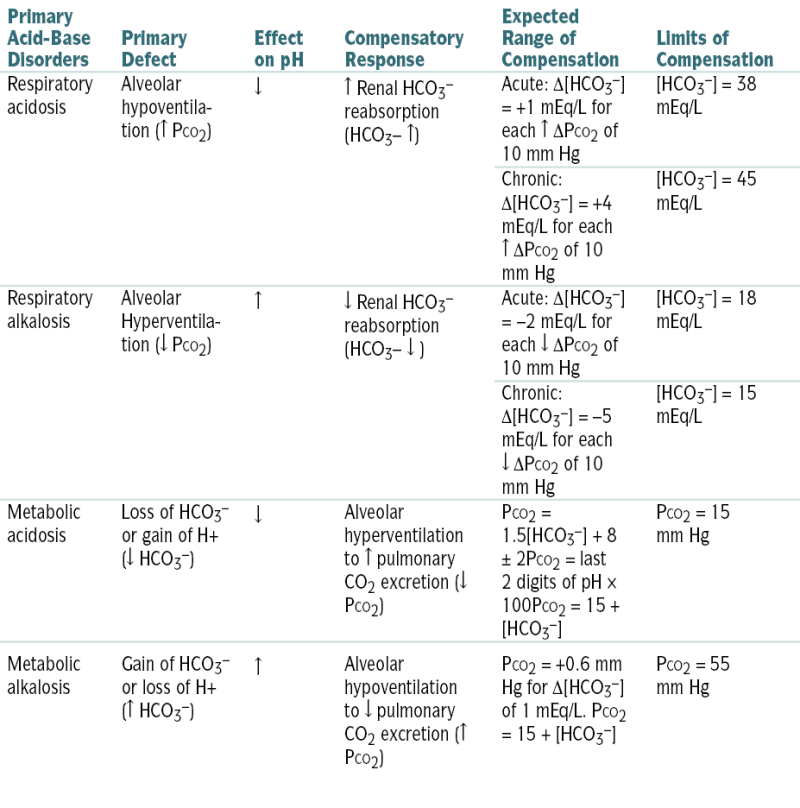
1. Approach to Acid-Base Disorders

 Table 9-2 describes acid-base abnlities and appropriate compensatory responses for simple disorders.


or
or
or
where UNa is urine sodium concentration, V is urine flow rate, PNa is plasma sodium concentration, UCr is urine creatinine concentration, and PCr is plasma creatinine concentration.


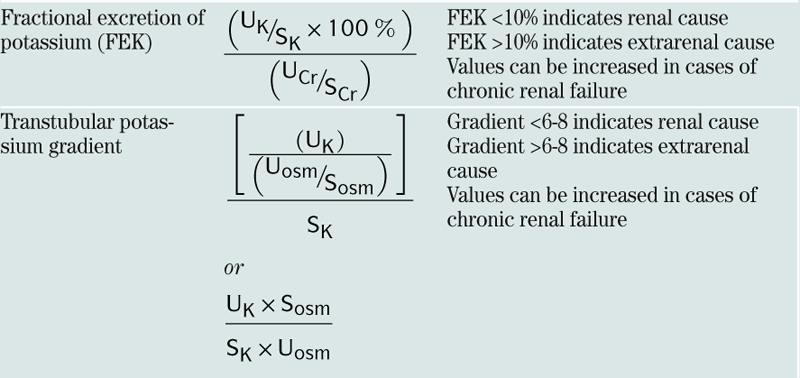
| Fractional excretion of potassium (FEK) |  |
FEK <10% indicates renal cause FEK >10% indicates extrarenal cause Values can be increased in cases of chronic renal failure |
| Transtubular potassium gradient |  or  |
Gradient <6-8 indicates renal cause Gradient >6-8 indicates extrarenal cause Values can be increased in cases of chronic renal failure |

2. Metabolic Acidosis
Etiology
 Metabolic acidosis w/AG (AG acidosis). The mnemonic MUDPILES is useful to remember the causes of AG acidosis:
TABLE 9-1
Replacement Fluids
| Fluids | Na (mEq/L) | K (mEq/L) | Cl (mEq/L) | HCO3− (mEq/L) | Ca (mEq/L) | Kcal/L |
| ½ Nl saline | 77 | — | 77 | — | — | — |
| Nl saline | 154 | — | 154 | — | — | — |
| D5W | — | — | — | — | — | 170 |
| D10W | — | — | — | — | — | 340 |
| Lactated Ringer’s solution | 130 | 4 | 109 | 28∗ | 3 | 9 |
| Extracellular fluid | 141 | 4 | — | 27 | 5 | — |
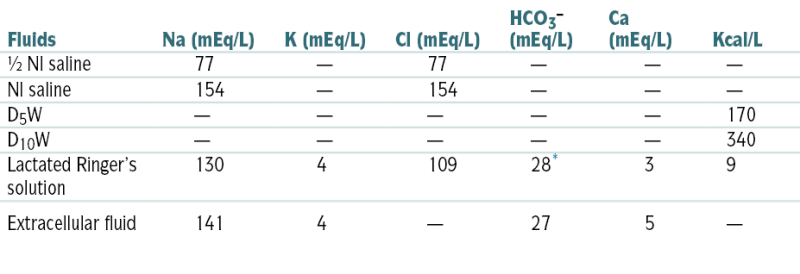
∗ Lactate converted to HCO3− in liver.
From Nguyen TC, Abilez OJ (eds): Practical Guide to the Care of the Surgical Patient: The Pocket Scalpel. Philadelphia, Mosby, 2009.


where PNa is plasma sodium concentration.


where the osmolar clearance is calculated as:
 Metabolic acidosis w/nl AG (hyperchloremic acidosis)
Diagnosis (Fig. 9-3)
 Measurement of urinary AG (UNa+ + UK+ − UCl−) and urinary pH is useful in the ddx of hyperchloremic metabolic acidosis:
Treatment

3. Renal Tubular Acidosis (RTA)
 Disorder characterized by an inability to excrete H+ or inadequate generation of new HCO3−. Four types:
Etiology

 Type 2 RTA: Fanconi’s syndrome, primary hyperparathyroidism, MM, medications (acetazolamide)
 Type 4 RTA: DM, sickle cell disease, Addison’s disease, urinary obstruction
Diagnosis
Labs
 ABGs: metabolic acidosis, with nl AG
 Serum K+ ↓ in RTA types 1 and 2, nl in type 3, and high in type 4
 Minimum urine pH >5.5 in RTA type 1 and <5.5 in types 2, 3, and 4
 Urinary AG 0 or (+) in all types of RTA
Treatment
4. Respiratory Acidosis
Etiology
 Pulmonary disease (COPD, severe pneumonia, pulmonary edema, interstitial fibrosis)
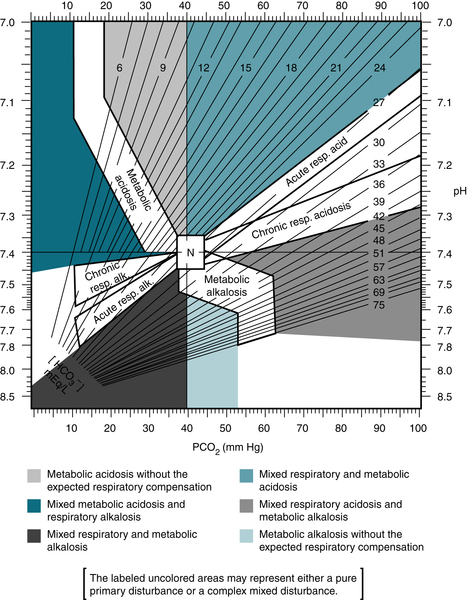
FIGURE 9-2 Map for acid-base disorders. (From Ferri F: Practical Guide to the Care of the Medical Patient, 8th ed. St. Louis, Mosby, 2011.)
 Airway obstruction (foreign body, severe bronchospasm, laryngospasm)
 Thoracic cage disorders (pneumothorax, flail chest, kyphoscoliosis)
 Defects in muscles of respiration (myasthenia gravis, hypokalemia, muscular dystrophy)
 Defects in PNS (amyotrophic lateral sclerosis, poliomyelitis, GBS, botulism, tetanus, organophosphate poisoning, spinal cord injury)
 Depression of respiratory center (anesthesia, narcotics, sedatives, vertebral artery embolism or thrombosis, ICP)
 Failure of mechanical ventilator
Diagnosis

Treatment
 Correction of the underlying etiology
5. Metabolic Alkalosis
Etiology
 Divided into chloride-responsive (urinary chloride <20 mEq/L) and chloride-resistant (urinary chloride level >20 mEq/L) forms
Chloride Responsive
 Vomiting
 NG suction
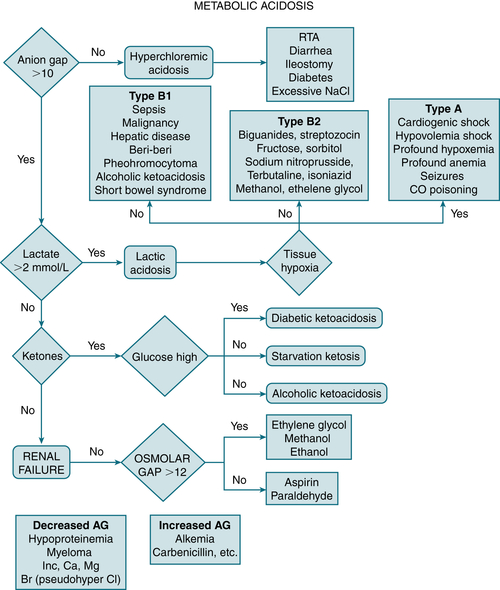
FIGURE 9-3 Diagnostic approach to metabolic acidosis. (From Vincent JL, Abraham E, Moore FA, et al [eds]: Textbook of Critical Care, 6th ed. Philadelphia, Saunders, 2011.)
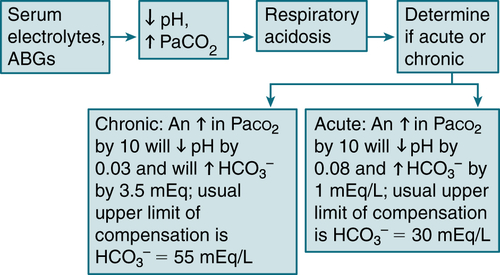
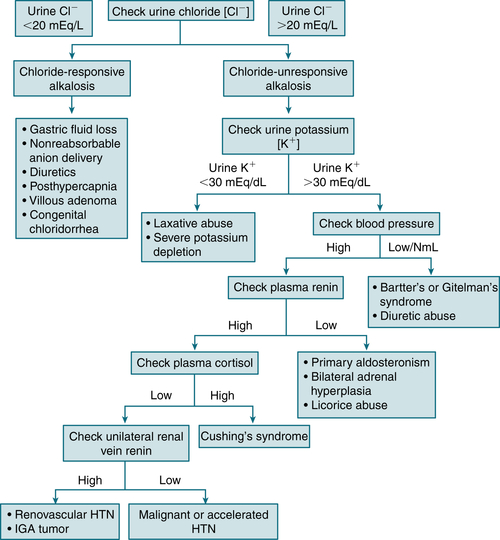
FIGURE 9-5 Workup of metabolic alkalosis. (From DuBose TD Jr: Acid-base disorders. In: Brenner BM [ed]: Brenner and Rector’s The Kidney, 8th ed. Philadelphia: Saunders, 2008, p. 513.)
 Diuretics
 Posthypercapnic alkalosis
 Stool losses (laxative abuse, cystic fibrosis, villous adenoma)
 Massive blood transfusion
 Exogenous alkali administration
Chloride Resistant
 Hyperadrenocorticoid states (Cushing’s syndrome, primary hyperaldosteronism, secondary mineralocorticoidism [licorice, chewing tobacco])
 Hypomagnesemia
 Hypokalemia
 Bartter’s syndrome
Diagnosis

Treatment
 Chloride-responsive forms: saline administration and correction of accompanying hypokalemia
 Chloride-resistant forms: correction of underlying cause and associated K+ depletion
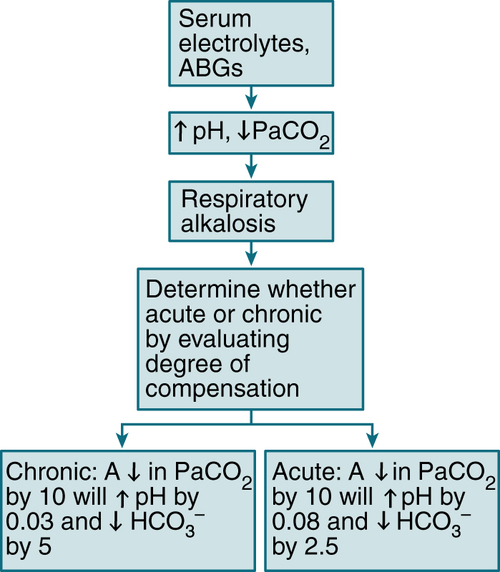
6. Respiratory Alkalosis
Etiology
 Hypoxemia (pneumonia, PE, atelectasis, high-altitude living)
 Drugs (salicylates, xanthines, progesterone, epinephrine, thyroxine, nicotine)
 CNS disorders (tumor, CVA, trauma, infections)
 Psychogenic hyperventilation (anxiety, hysteria)
 Hepatic encephalopathy
 Gram(−) sepsis
 Sudden recovery from metabolic acidosis
 Assisted ventilation
Diagnosis

Treatment
 Rx is aimed at its underlying cause; symptomatic pts w/psychogenic hyperventilation often require some form of rebreathing apparatus (e.g., paper bag, breathing 5% CO2 by mask).
E. Disorders of Sodium Homeostasis
1. Hyponatremia
Etiology
Isovolemic
 SIADH
SIADH Water intoxication (e.g., schizophrenic pts, primary polydipsia, Na+-free irrigant solutions, multiple tap-water enemas, dilute infant formulas). These entities are rare and often associated w/a deranged ADH axis.
 Renal failure
 Reset osmostat (e.g., chronic active TB, carcinomatosis)
 Glucocorticoid deficiency (hypopituitarism)
 Hypothyroidism
 Thiazide diuretics, NSAIDs, carbamazepine, amitriptyline, thioridazine, vincristine, cyclophosphamide, colchicine, tolbutamide, chlorpropamide, ACEIs, clofibrate, oxytocin, SSRIs, amiodarone
Hypovolemic
 Renal losses (diuretics, partial urinary tract obstruction, salt-losing renal disease)
 Extrarenal losses: GI (vomiting, diarrhea), extensive burns, third spacing (peritonitis, pancreatitis)
 Adrenal insufficiency
Hypervolemic
 CHF
CHF Nephrotic syndrome
 Cirrhosis
 Pregnancy
 Isotonic hyponatremia (nl serum osmolality)
 Pseudohyponatremia (↑ serum lipids and serum proteins). Newer Na+ assays eliminate this problem.
 Isotonic infusion (e.g., glucose, mannitol)
 Hypertonic hyponatremia (serum osmolality)
 Hyperglycemia: each 100 mg/dL ↑ in blood glucose level above nl ↓ plasma Na+ concentration by 1.6 mEq/L
 Hypertonic infusions (e.g., glucose, mannitol)
Diagnosis

Treatment
Isovolemic Hyponatremia
 SIADH: fluid restriction unless acutely symptomatic
 Acute symptomatic pt: hypertonic 3% to 5% saline solution infusion; give 200 to 500 mL slowly, followed by fluid restriction to 750 mL/day for 24 to 48 hr. Hypertonic saline can be combined w/furosemide to limit Rx-induced expansion of the ECF volume.
Hypovolemic Hyponatremia
 0.9% NS infusion
Hypervolemic Hyponatremia
 Na+ and water restriction. The combination of captopril and furosemide is effective in pts w/hyponatremia resulting from CHF.
Chronic Hyponatremia
 Correction of chronic hyponatremia should be kept at a rate <10 mEq/L (mmol/L) in any 24-hr period to prevent myelinolysis, a neurologic disorder that can occur after rapid correction of hyponatremia. Initially named central pontine myelinolysis, this disease is now known also to affect extrapontine brain areas and is known as osmotic demyelination syndrome. Manifestations of myelinolysis usually evolve several days after correction of hyponatremia. Typical features are disorders of UMNs, spastic quadriparesis and pseudobulbar palsy, and mental disorders ranging from mild confusion to coma. Death may occur. The motor and localizing signs of myelinolysis differ from those of the generalized encephalopathy that is caused by untreated hyponatremia.
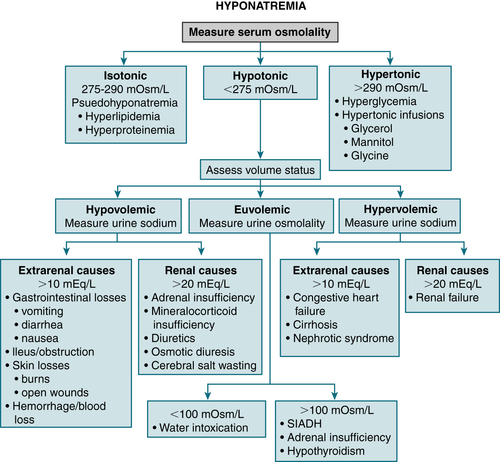
FIGURE 9-7 Algorithm for treatment of hyponatremia. (From Cameron AM: Current Surgical Therapy, 10th ed. Philadelphia, Saunders, 2011.)
Clinical Pearls
 In general, the serum Na+ should be corrected only halfway to nl in the initial 24 hr (but not >1 mEq/L/hr) to prevent complications from rapid correction (cerebral edema, myelinolysis, seizures). A slower correction rate is indicated in pts w/chronic hyponatremia.
 In symptomatic pts w/hyponatremia, an ↑ in the serum Na+ concentration of 2 mEq/L/hr to a level of 120 to 130 mEq/L is considered safe by some experts; however, less rapid correction may be indicated in pts w/severe or chronic hyponatremia.
2. Hypernatremia
Etiology
 Isovolemic (↓ TBW, nl TBNa, and ECF)
 Hypervolemic (TBW, TBNa, and ECF)
 Hypovolemic: loss of H2O and Na+ (H2O loss > Na+)
Diagnosis

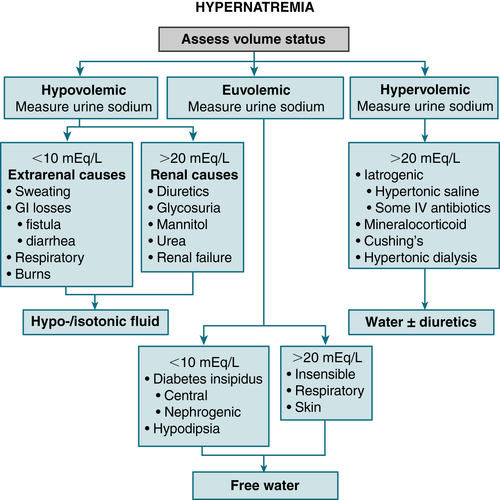
FIGURE 9-8 Algorithm for treatment of hypernatremia. (From Cameron AM: Current Surgical Therapy, 10th ed. Philadelphia, Saunders, 2011.)
Treatment
Isovolemic Hypernatremia
 Fluid replacement w/D5W. Correct only half of estimated water deficit in initial 24 hr. The rate of correction of serum Na+ should not exceed 1 mEq/L/hr in acute hypernatremia or 0.5 mEq/L/hr in chronic hypernatremia.
 Calculate water deficit in hypernatremic pts.
 H2O deficit (in liters) = 0.6 × BW (kg) × ([measured Na+/140] − 1)
Hypovolemic Hypernatremia
 Fluid replacement is achieved w/isotonic saline solution.
 The rate of correction of plasma osmolarity should not exceed 2 mOsm/kg/hr.
Hypervolemic Hypernatremia
 Fluid replacement w/D5W (to correct hypertonicity) is instituted after use of loop diuretics (to ↑ Na+ excretion).
F. Disorders of Potassium Homeostasis
1. Hypokalemia
Etiology
 Cellular shift (redistribution) and undetermined mechanisms
 Renal excretion
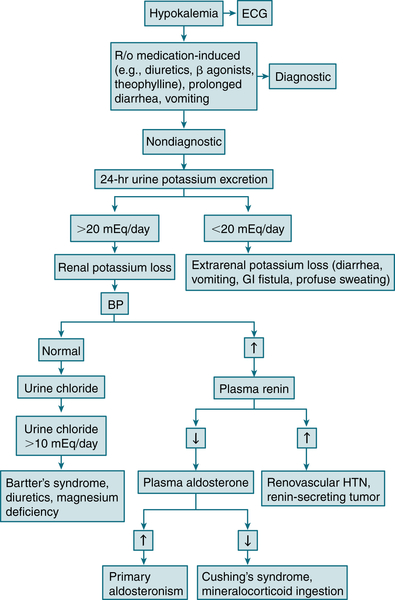
FIGURE 9-9 Diagnostic algorithm for hypokalemia. (From Ferri FF: Ferri’s Best Test: A Practical Guide to Clinical Laboratory Medicine and Diagnostic Imaging, 2nd ed. Philadelphia, Mosby, 2010.)
 GI loss
 Inadequate dietary intake (e.g., anorexia nervosa)
 Cutaneous loss (excessive sweating)
 High dietary Na+ intake, excessive use of licorice
Diagnosis

 Distinguish true K+ depletion from redistribution (e.g. alkalosis, insulin administration).
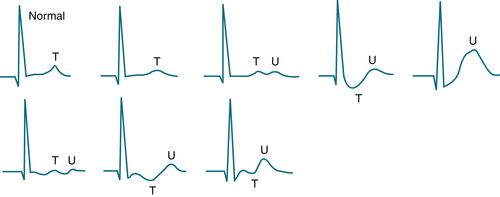
FIGURE 9-10 Variable ECG patterns can be seen with hypokalemia, ranging from slight T wave flattening to the appearance of prominent U waves, sometimes with ST depression or T wave inversion. These patterns are not always directly related to the specific level of serum K+. (From Ferri FF: Ferri’s Best Test: A Practical Guide to Clinical Laboratory Medicine and Diagnostic Imaging, 2nd ed. Philadelphia, Mosby, 2010.)
 If the cause of hypokalemia is not apparent (e.g. diuretics, vomiting), measure 24-hr urinary K+ excretion while pt is receiving regular dietary Na+ intake.
 If renal K+ wasting is suspected, the following steps are indicated:
Treatment
 K+ replacement
 Monitor ECG and urinary output.
 Identify the underlying cause and treat accordingly.
 IV NS solution is given in chloride-responsive hypokalemia.
2. Hyperkalemia
Etiology
 Pseudohyperkalemia
 ↑ K+ intake (often in setting of impaired excretion)
 ↓ Renal excretion
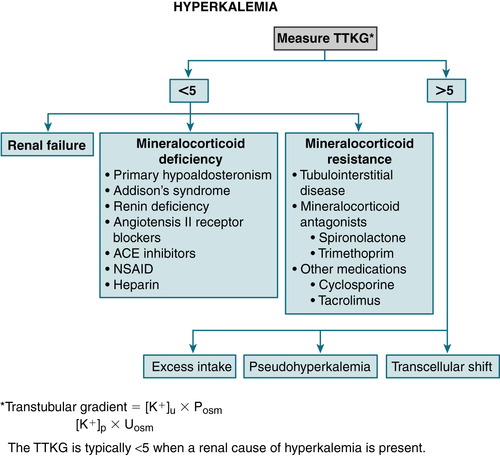
FIGURE 9-11 Algorithm for treatment of hyperkalemia. (From Cameron AM: Current Surgical Therapy, 10th ed. Philadelphia, Saunders, 2011.)
 Redistribution (excessive cellular release)
Diagnosis
 R/o pseudohyperkalemia or lab error: Repeat serum K+ level.
 Obtain ECG; in pts w/suspected pseudohyperkalemia secondary to hemolyzed specimen or thrombocytosis, the ECG will not show any manifestations of hyperkalemia.
 In pts w/thrombocytosis or severe leukocytosis, an accurate serum K+ level can be determined by drawing a heparinized sample.
 Check pH, correct acidosis (if present).
 Check Ca, Mg, glucose, serum and urine electrolytes, BUN, and Cr levels. Calculate the transtubular K+ gradient (TTKG). Figure 9-11 provides a diagnostic algorithm for hyperkalemia.
Treatment

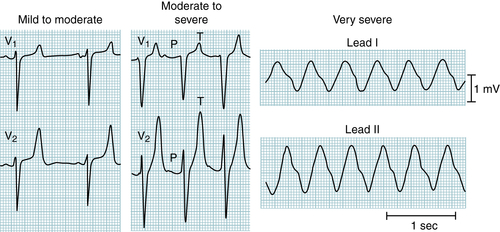
FIGURE 9-12 The earliest ECG change with hyperkalemia is peaking (“tenting”) of the T waves. With progressive increases in serum potassium, the QRS complexes widen, the P waves decrease in amplitude and may disappear, and, finally, a sine wave pattern leads to asystole. (From Ferri FF: Ferri’s Best Test: A Practical Guide to Clinical Laboratory Medicine and Diagnostic Imaging, 2nd ed. Philadelphia, Mosby, 2010.)
TABLE 9-3
Treatment of Hyperkalemia
| Treatment | Mechanism | Dosage/Comment | Onset | Duration |
| Calcium | Stabilizes cardiac cells | 10 mL of 10% solution (calcium gluconate or calcium chloride) | Seconds | 30-60 min |
| Insulin (regular) | Shifts K+ into cells | 10 U IV + glucose (50 g) | 15-30 min | 2-4 hr |
| Albuterol | Shifts K+ into cells | 10-20 mg by inhaler over 10 min | 20-30 min | 2-3 hr |
| NaHCO3 | Shifts K+ into cells | In cases of acidosis | Delayed | — |
| Kayexalate with sorbitol | Removes K+ from body | Oral: 15-30 g | 4-6 hr | — |
| Retention enema: 30-50 g | 1 hr | — | ||
| Loop diuretics | Removes K+ from body | Intravenous, varies by drug and renal function | 1 hr | — |
| Hemodialysis | Removes K+ from body | Preferred over peritoneal dialysis in acute cases | 15-30 min | — |
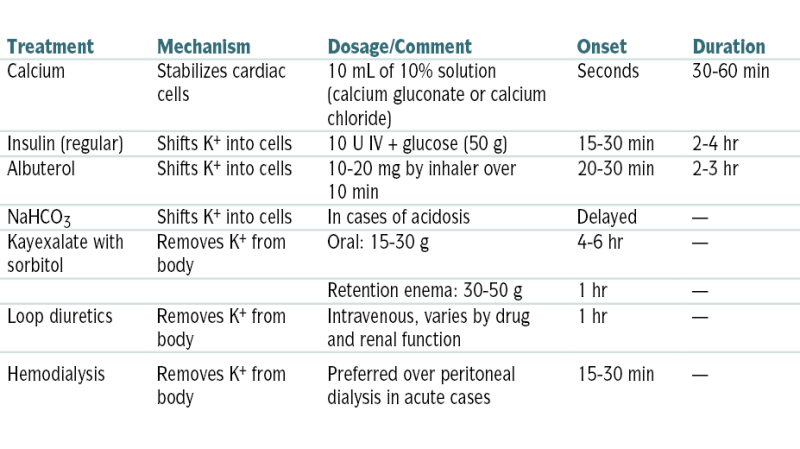
From Vincent JL, Abraham E, Moore FA, et al (eds): Textbook of Critical Care, 6th ed. Philadelphia, Saunders, 2011.
G. Disorders of Magnesium Metabolism
1. Hypomagnesemia
Etiology
 GI and nutritional
 Excessive renal losses
 Redistribution: hypoalbuminemia, cirrhosis, administration of insulin and glucose, theophylline, epinephrine, acute pancreatitis, cardiopulmonary bypass
 Miscellaneous: sweating, burns, prolonged exercise, lactation, “hungry bones” syndrome
Diagnosis
H&P
 Neuromuscular: weakness, hyperreflexia, fasciculations, tremors, convulsions, delirium, coma
 CV: cardiac arrhythmias
 Hypokalemia refractory to K+ replacement
 Hypocalcemia refractory to Ca replacement
ECG
 Prolonged QT interval, T wave flattening, prolonged PR interval, AF, torsades de pointes
Treatment
 Mild hypomagnesemia: 600 mg oxide PO provides 35 mEq of Mg; dosage is 1 to 2 tablets qd.
 Moderate: 50% solution Mg sulfate (each 2-mL ampule contains 8 mEq or 96 mg of elemental Mg); dosage is one 2-mL ampule of 50% Mg solution q6h PRN.
 Severe (serum Mg level <1 mg/dL) and symptomatic pt (seizures, tetany): 2 g Mg in 20 mL D5W IV during 60 min; monitor ECG, BP, pulse, respiration, DTRs, and urinary output. An alternative regimen is the administration of 6 g Mg sulfate (49 mEq) in 1000 mL of D5W during 3 hr, followed by 10 g of Mg sulfate in 2000 mL of 5% dextrose in water during 24 hr.
2. Hypermagnesemia
Etiology
 Renal failure
 ↓ Renal excretion secondary to salt depletion
 Abuse of antacids and laxatives containing Mg in pts w/renal insufficiency
 Endocrinopathies (deficiency of mineralocorticoid or thyroid hormone)
 ↑ Tissue breakdown (rhabdo)
 Redistribution: DKA, pheochromocytoma
 Other: lithium, volume depletion, familial hypocalciuric hypercalcemia
Diagnosis
H&P
 Clinical manifestations: paresthesias, hypotension, confusion, ↓ DTRs, paralysis, coma, apnea; acute hypermagnesemia suppresses PTH secretion and can produce hypocalcemia.
ECG
 ↓ PR interval, heart block, peaked T waves, QRS duration
Treatment
 Identify and correct the underlying disorder.
 Intracardiac conduction abnlities can be treated w/IV Ca gluconate.
 Prescribe dialysis for severe hypermagnesemia.
H. Disorders of Phosphate Metabolism
1. Hypophosphatemia
Etiology
 ↓ Intake (prolonged starvation, alcoholism, hyperalimentation, or IV infusion w/o phosphorus)
 Malabsorption
 PO4-3-binding antacid
 Renal loss
 Transcellular shift into cells
Treatment
 Mild to moderate hypophosphatemia (>1 mg/dL): Neutra-Phos capsules (250 mg per capsule), 2 capsules tid
 Severe symptomatic hypophosphatemia (<1 mg/dL): IV administration of PO4-3 salts (0.08-0.16 mmol/kg during 6 hr) repeated q6h until serum PO4-3 level is >1.5 mg/dL
2. Hyperphosphatemia
Etiology
 Excessive PO4-3 administration
 Transcellular shift out of cells
 Artifact: in vitro hemolysis
 Pseudohyperphosphatemia: hyperlipidemia, paraproteinemia, hyperbilirubinemia
Treatment
 Administration of Ca2+ carbonate (1 g w/each meal, gradually to 8-12 g of Ca carbonate a day) to bind PO4-3 in the gut and to prevent its absorption
 Insulin and glucose infusion (to promote cell phosphate uptake); may be useful when a rapid ↓ in phosphate is needed
 Institution of hemodialysis when renal failure is present
J. Acute Kidney Injury (AKI)
Definition
Etiology
 The causes of AKI can be subdivided into prerenal, intrinsic renal diseases, and postrenal.
Labs

 Rx: See Rx of CKD.
K. Chronic Kidney Disease (CKD)
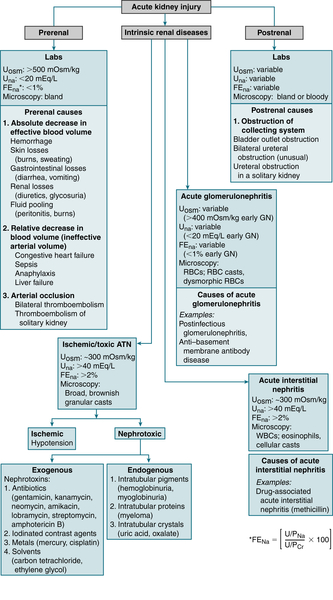
TABLE 9-4
RIFLE and AKIN Criteria for Diagnosis of AKI
| RIFLE Classification | ||
| GFR Criteria | UO Criteria | |
| Risk | SCr > 1.5 × baseline or ΔGFR > 25% reduction |
UO < 0.5 mL/kg/hr × 6 hr |
| Injury | SCr > 2.0 × baseline or ΔGFR > 50% reduction |
UO < 0.5 mL/kg/hr × 12 hr |
| Failure | SCr > 3.0 × baseline or ΔGFR > 75% reduction or SCr > 4.0 mg/dL |
UO < 0.3 mL/kg/hr × 24 hr or anuria × 12 hr |
| Loss | Persistent ARF = Complete loss of function for >4 wk | |
| ESRD | ESRD >3 mo | |
| AKIN Classification | ||
| Stage | SCr Criteria | UO Criteria |
| 1 | ΔSCr ≥ 0.3 mg/dL (30μmol/L) or SCr ≥ 1.5, ≤ 2.0 baseline |
UO < 0.5 mL/kg/hr × 6 hr |
| 2 | SCr > 2.0, ≤ 3.0 × baseline | UO < 0.5 mL/kg/hr × 12 hr |
| 3 | SCr ≥ 4.0 mg/dL with an acute rise ≥ 0.5mg/dL (50μmol/L) or on renal replacement therapy | UO < 0.3 mL/kg/hr × 24 hr or anuria × 12 hr |
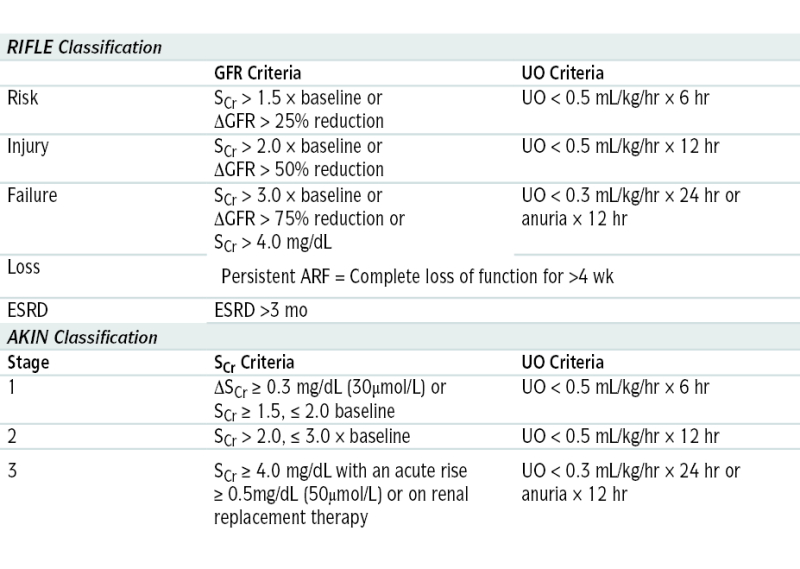
SCr, Serum creatinine; UO, urine output.
From Floege J, John RJ, Feehally J (eds): Comprehensive Clinical Nephrology, 4th ed. Philadelphia, Saunders, 2010.
TABLE 9-5
Diagnostic Tests to Distinguish Prerenal and Renal AKI
| Index | Prerenal Causes | Renal Causes |
| FENa∗ | <1% | >2% |
| Urine sodium | <10 mmol/L | >40 mmol/L |
| Urine/plasma osmolality | >1.5 | 1-1.5 |
| Renal failure index | <1 | >2 |
| BUN/creatinine ratio | >20 | <10 |
∗ Calculation of FENa: (Urine sodium × Plasma creatinine)/(Plasma sodium × Serum creatinine) × 100
Renal failure index: (Urine sodium × Urine creatinine)/Plasma creatinine
From Cameron AM: Current Surgical Therapy, 10th ed. Philadelphia, Saunders, 2011.
Etiology
 DM (37%), HTN (30%), chronic GN (12%)
 Polycystic kidney disease
 Tubular interstitial nephritis (e.g., drug hypersensitivity, analgesic nephropathy), obstructive nephropathies (e.g., nephrolithiasis, prostatic disease)
 Vascular diseases (renal artery stenosis, hypertensive nephrosclerosis)
 Autoimmune diseases
Diagnosis
H&P
 Skin pallor, ecchymoses
 Edema, leg cramps, restless legs, peripheral neuropathy
 HTN
HTN Emotional lability and depression, ↓ mental acuity
 The clinical presentation varies with the degree of renal failure and its underlying etiology. Common sx are generalized fatigue, nausea, anorexia, pruritus, sleep disturbances, smell and taste disturbances, hiccups, and seizures.
TABLE 9-6
Criteria for Definition of CKD
From Floege J, John RJ, Feehally J (eds): Comprehensive Clinical Nephrology, 4th ed. Philadelphia, Saunders, 2010.
TABLE 9-7
Classification of CKD Based on GFR
| CKD Stage∗ | Definition |
| 1 | Nl or increased GFR; some evidence of kidney damage reflected by microalbuminuria, proteinuria, and hematuria as well as radiologic or histologic changes |
| 2 | Mild decrease in GFR (89-60 mL/min/1.73 m2) with some evidence of kidney damage reflected by microalbuminuria, proteinuria, and hematuria, as well as radiologic or histologic changes |
| 3 | GFR 59-30 mL/min/1.73 m2 |
| 3A | GFR 59-45 mL/min/1.73 m2 |
| 3B | GFR 44-30 mL/min/1.73 m2 |
| 4 | GFR 29-15 mL/min/1.73 m2 |
| 5 | GFR <15 mL/min/1.73 m2; when renal replacement therapy in the form of dialysis or transplantation has to be considered to sustain life |
Classification of CKD based on GFR was proposed by the Kidney Disease Outcomes Quality Initiative (KDOQI) guidelines and modified by the National Institute for Health and Care Excellence (NICE) in 2008.
∗ The suffix p is added to the stage in proteinuric pts (proteinuria >0.5 g/24 hr).
From Floege J, John RJ, Feehally J (eds): Comprehensive Clinical Nephrology, 4th ed. Philadelphia, Saunders, 2010.
Imaging
 Sonographic evaluation of the kidneys reveals smaller kidneys with ↑ echogenicity in CKD.
Treatment

 Adjust drug doses to correct for prolonged half-lives.
 ACEIs and ARBs are useful in reducing proteinuria and slowing the progression of chronic renal disease, especially in hypertensive diabetic pts. Avoid combinations of ACEIs and ARBs because of the ↑ risk of hyperkalemia, hypotension, and worsening renal failure.
 Initiation of dialysis:
 ESAs to reduce the need for transfusions in pts with anemia. Anemia should not be fully corrected in pts with CKD. Maintaining a target hemoglobin of <10 g/dL or hematocrit 30% to 33% is satisfactory. Targeting higher hemoglobin levels in CKD may ↑ risks for stroke, HTN, and serious cardiovascular events.
 Restrict fluid if significant edema is present. Give diuretics for significant fluid overload (loop diuretics are preferred).
 Correct HTN to at least 130/85 mm Hg with ACEIs (avoid in pts with significant hyperkalemia), ARBs, and/or nondihydropyridine Ca2+ channel blockers (verapamil, diltiazem), which can be used in pts intolerant to ACEIs or when other agents are needed to control blood pressure. Systolic BP between 110 and 129 mm Hg may be beneficial in pts with urine protein excretion >1.0 g/day. Systolic BP <110 mm Hg may be associated with a higher risk for kidney disease progression.
 Correct electrolyte abnormalities.
 Lipid-↓ agents are indicated in pts with dyslipidemia; target LDL cholesterol is <100 mg/dL; these agents are shown to ↓ cardiac death and atherosclerosis-mediated cardiovascular events in persons with CKD.
 Control renal osteodystrophy with Ca2+ supplementation and vitamin D.
 Dietary PO4-3 restriction effectively reduces serum PO4-3 levels and is recommended in all pts with CKD.
 Kidney transplantation in selected pts improves survival. The 2-yr kidney graft survival rate for living related donor transplantations is >80%, whereas the 2-yr graft survival rate for cadaveric donor transplantation is approximately 70%.
TABLE 9-8
Nutritional Recommendations in Renal Disease
| Daily Intake | Predialysis Chronic Renal Failure | Hemodialysis | Peritoneal Dialysis |
| Protein (g/kg ideal BW) (see KDOQI for estimation of adjusted edema-free BW) | 0.6-1.0 | 1.1-1.2 | 1.0-1.3 |
| Level depends on the view of the nephrologist 1.0 for nephrotic syndrome |
This is a broad recommendation because protein intake would be individualized for the pt’s nutritional status, serum phosphate levels, and dialysis adequacy | ||
| Energy (kcal/kg BW) | 35 (<60 yr) 30-35 (>60 yr) |
35 (<60 yr) 30-35 (>60 yr) | 35 including dialysate calories (<60 yr) 30-35 including dialysate calories (>60 yr) |
| Sodium (mmol) Potassium |
<100 (more if salt wasting) Reduce if hyperkalemic |
<100 Reduce if hyperkalemic |
<100 Reduce if hyperkalemic; potassium restriction is generally not required |
| If hyperkalemic, advice will take the form of decreasing certain foods (e.g., some fruits and vegetables) and giving information about cooking methods | |||
| Phosphorus | Reduce; level depends on protein intake Advice will take the form of reducing certain foods (e.g., dairy, offal, some shellfish) and giving information about the timing of binders with high-phosphorus meals and snacks |
||
| Calcium | In CKD stages 3-5, total intake of elemental calcium (including dietary calcium) should not exceed 2000 mg/day | Total intake of elemental calcium (including dietary calcium) should not exceed 2000 mg/day | Total intake of elemental calcium (including dietary calcium) should not exceed 2000 mg/day |
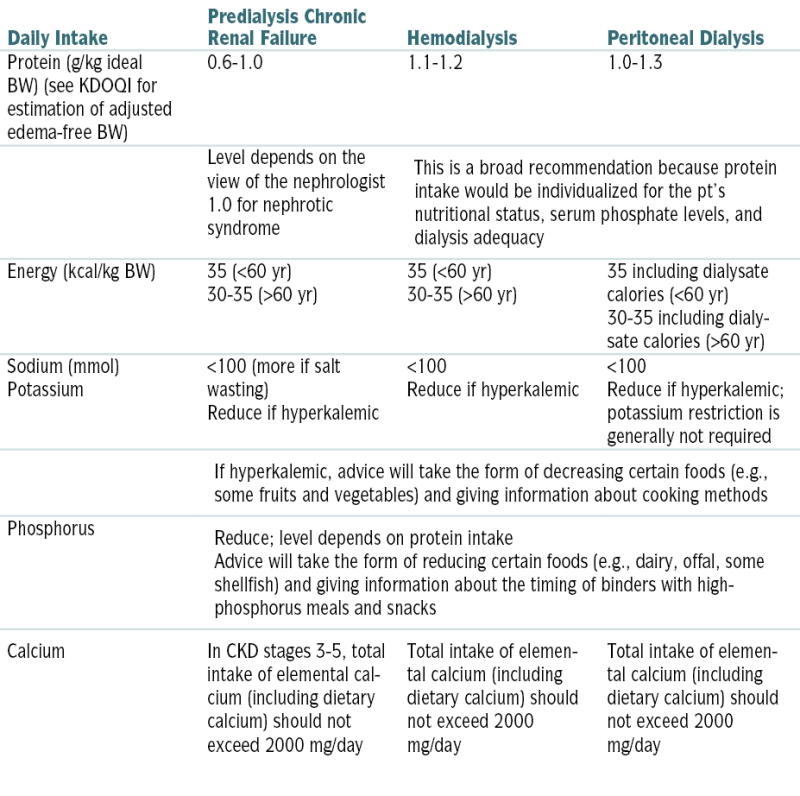
Recommendations are for typical pts but should always be individualized on the basis of clinical, biochemical, and anthropometric indices.
KDOQI, Kidney Disease Outcomes Quality Initiative.
From Floege J, John RJ, Feehally J (eds): Comprehensive Clinical Nephrology, 4th ed. Philadelphia, Saunders, 2010.
L. Glomerular Disease
1. Nephrotic Syndrome
Definition
Etiology
 Idiopathic (may be secondary to the following glomerular diseases: minimal-change disease [nil disease, lipoid nephrosis], focal segmental glomerular sclerosis, membranous nephropathy, membranoproliferative glomerular nephropathy)
 Systemic diseases: DM, SLE, amyloidosis, dysproteinemias
 Most children w/nephrotic syndrome have minimal-change disease (this form is also associated w/allergy, NSAIDs, and Hodgkin’s disease).
 Focal glomerular disease: associated w/HIV, heroin abuse, obesity. A more severe form of nephrotic syndrome associated w/rapid progression to ESRD within months can also occur in HIV(+) pts and is known as collapsing glomerulopathy.
 Membranous nephropathy can occur w/Hodgkin’s lymphoma, carcinomas, SLE, gold Rx.
 Membranoproliferative glomerulonephropathy is often associated w/URIs.
Diagnosis
H&P
 Typically pts present w/severe peripheral edema, exertional dyspnea, and abd fullness secondary to ascites. Most pts have a significant amount of weight gain.
TABLE 9-9
Nephrotic Syndrome: Definitions
| NS Definitions∗ | ||
| Term | Adult | Pediatric |
| Relapse | Proteinuria ≥3.5 g day–1 occurring after complete remission has been obtained for >1 mo | Albu-stix 3+ or proteinuria >40 mg m–2 h–1 occurring on 3 days within 1 wk |
| Frequently relapsing | 2+ relapses within 6 mo | 2+ relapses within 6 mo |
| Complete remission | Reduction of proteinuria to ≤0.20 g day–1 and serum albumin >35 gl–1 | <4 mg m–2 h–1 on at least 3 occasions within 7 days serum albumin >35 gl–1 |
| Partial remission | Reduction of proteinuria to between 0.21 g day21 and 3.4 g day–1 ± decrease in proteinuria of ≥50% from baseline | Disappearance of edema. Increase in serum albumin >35 gl–1 and persisting proteinuria >4 mg m–2 h–1 or >100 mg m–2 day–1 |
| Steroid-resistant | Persistence of proteinuria despite prednisone therapy 1 mg kg21 day21 × 4 mo | Persistence of proteinuria despite prednisone therapy 60 mg m22 × 4 wk† |
| Steroid-dependent—NS recurs when pts stop or decrease treatment | Two consecutive relapses occurring during therapy or within 14 days of completing steroid therapy | Two relapses of proteinuria within 14 days after stopping or during alternate day steroid therapy |
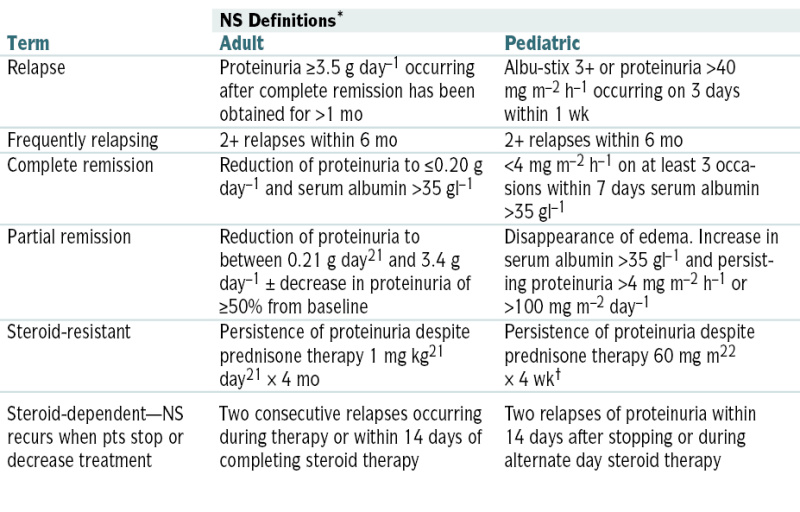
NS, Nephrotic syndrome.
∗ Definition of terms used in idiopathic nephrotic syndrome in adults and children. The definitions were generated by a consensus of the International Society for Kidney Diseases in Children and the German Pediatric Nephrology Society.
† Or persistence of proteinuria despite prednisone therapy 60 mg m–2 × 4 wk and three methylprednisolone pulses.
From Floege J, John RJ, Feehally J (eds): Comprehensive Clinical Nephrology, 4th ed. Philadelphia, Saunders, 2010.
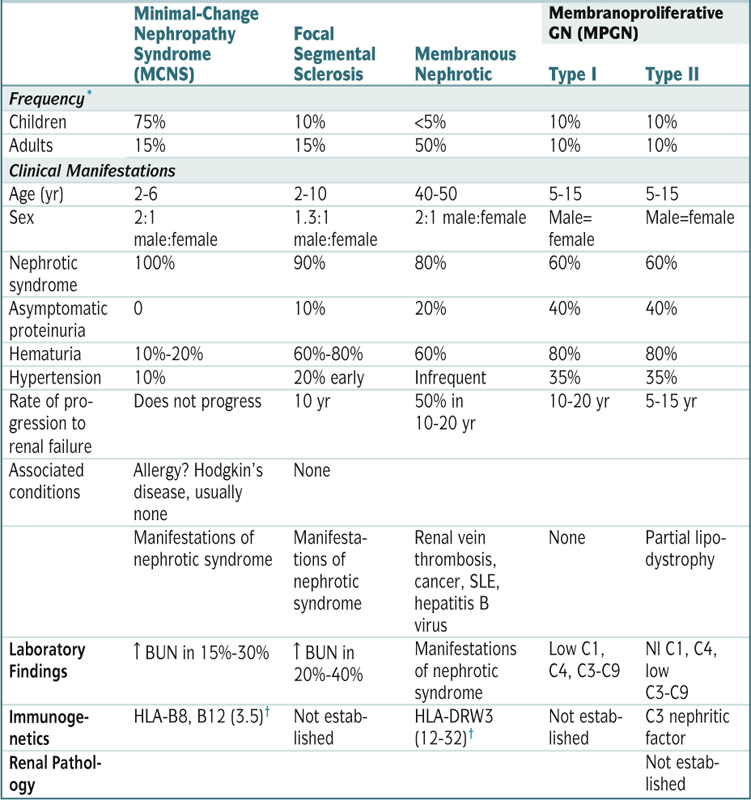
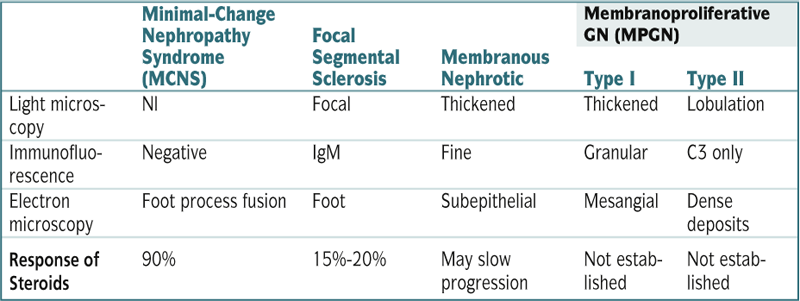
TABLE 9-10
Summary of Primary Renal Diseases That Manifest as Idiopathic Nephrotic Syndrome
| Minimal-Change Nephropathy Syndrome (MCNS) | Focal Segmental Sclerosis | Membranous Nephrotic | Membranoproliferative GN (MPGN) | ||
| Type I | Type II | ||||
| Frequency∗ | |||||
| Children | 75% | 10% | <5% | 10% | 10% |
| Adults | 15% | 15% | 50% | 10% | 10% |
| Clinical Manifestations | |||||
| Age (yr) | 2-6 | 2-10 | 40-50 | 5-15 | 5-15 |
| Sex | 2:1 male:female | 1.3:1 male:female | 2:1 male:female | Male=female | Male=female |
| Nephrotic syndrome | 100% | 90% | 80% | 60% | 60% |
| Asymptomatic proteinuria | 0 | 10% | 20% | 40% | 40% |
| Hematuria | 10%-20% | 60%-80% | 60% | 80% | 80% |
| Hypertension | 10% | 20% early | Infrequent | 35% | 35% |
| Rate of progression to | Does not progress | 10 yr | 50% in 10-20 yr | 10-20 yr | 5-15 yr |
| renal failure | |||||
| Associated conditions | Allergy? Hodgkin’s disease, usually none | None | |||
| Manifestations of nephrotic syndrome | Manifestations of nephrotic syndrome | Renal vein thrombosis, cancer, SLE, hepatitis B virus | None | Partial lipodystrophy | |
| Laboratory Findings | ↑ BUN in 15%-30% | ↑ BUN in 20%-40% | Manifestations of nephrotic syndrome | Low C1, C4, C3-C9 | Nl C1, C4, low C3-C9 |
| Immunogenetics | HLA-B8, B12 (3.5)† | Not established | HLA-DRW3 (12-32)† | Not established | C3 nephritic factor |
| Renal Pathology | Not established | ||||
| Minimal-Change Nephropathy Syndrome (MCNS) | Focal Segmental Sclerosis | Membranous Nephrotic | Membranoproliferative GN (MPGN) | ||
| Type I | Type II | ||||
| Light microscopy | Nl | Focal | Thickened | Thickened | Lobulation |
| Immunofluorescence | Negative | IgM | Fine | Granular | C3 only |
| Electron microscopy | Foot process fusion | Foot | Subepithelial | Mesangial | Dense deposits |
| Response of Steroids | 90% | 15%-20% | May slow progression | Not established | Not established |
C, complement.
∗ Approximate frequency as a cause of idiopathic nephrotic syndrome. About 10% of cases of adult nephrotic syndrome result from various diseases that usually manifest with AGN.
† Relative risk.
Modified from Goldman L, Ausiello D (eds): Cecil Textbook of Medicine, 22nd ed. Philadelphia, Saunders, 2004.
 HTN
HTN Pleural effusion
Labs
 U/A: proteinuria, oval fat bodies (tubular epithelial cells w/cholesterol esters). The presence of hematuria, cellular casts, and pyuria is suggestive of nephritic syndrome.
 24-hr urine protein excretion >3.5 g/1.73 m3/24 hr
 Blood chemistries: ↓ alb <3 g/dL, ↓ total protein, ↑ serum cholesterol, ↑ BUN, ↑ Cr
Imaging
 U/S of kidneys
Treatment
 ↓ -Fat diet, fluid restriction in hyponatremic pts; nl protein intake unless urinary protein loss >10 g/24 hr (some pts may require additional dietary protein to prevent [−] nitrogen balance and significant protein malnutrition). Improved urinary protein excretion and serum lipid changes have been observed w/↓-fat soy protein diet providing 0.7 g of protein/kg/day. However, because of the risk of malnutrition, many nephrologists recommend nl protein intake.
 Na+ restriction for peripheral edema
 Monitor for development of peripheral venous thrombosis and renal vein thrombosis (risk related to loss of antithrombin III and other proteins involved in the clotting mechanism).
 Furosemide for severe edema
 ACEIs to ↓ proteinuria
 Anticoagulants as long as nephrotic proteinuria or alb level <20 g/L is present
 Minimal-change glomerulopathy (MCG): prednisone 1 mg/kg/day; cyclophosphamide or other immunosuppressive agents for relapses
 Focal segmental glomerulosclerosis (FSGS): corticosteroids or calcineurin inhibitors initially. Many pts eventually require immunosuppressive Rx (cyclophosphamide, mycophenolate mofetil, rituximab).
 Membranous GN: immunosuppressive Rx (cyclophosphamide/corticosteroids or calcineurin inhibitor) if persistent proteinuria ≥4 g/day; rituximab for Rx failure
 Membranoproliferative GN (MPGN): corticosteroids with immunosuppressive agents and antiplatelet drugs
2. Nephritic Syndrome
Definition
Etiology
 Post–group A β-hemolytic streptococcus infection (other infectious etiologies, including endocarditis and visceral abscess)
 Vasculitis (granulomatosis with polyangiitis [Wegener’s granulomatosis], polyarteritis nodosa). Pauci-immune crescenteric GN (PICG) is associated with polyangiitis, microscopic polyangiitis, and Churg-Strauss syndrome and manifests with RPGN.
 Idiopathic GN (membranoproliferative, idiopathic, crescentic, IgA nephropathy)
 Goodpasture’s syndrome
 Other cryoglobulinemia (Henoch-Schönlein purpura)
 Drug induced (gold, penicillamine)
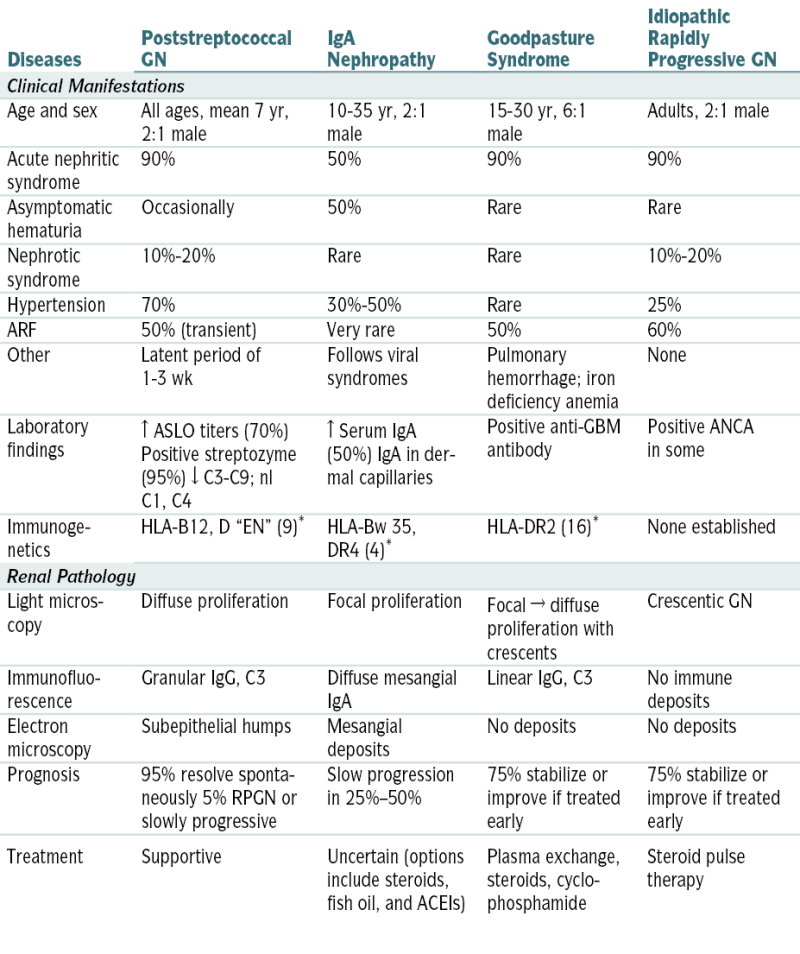
TABLE 9-11
Summary of Primary Renal Diseases That Manifest as AGN
| Diseases | Poststreptococcal GN | IgA Nephropathy | Goodpasture Syndrome | Idiopathic Rapidly Progressive GN |
| Clinical Manifestations | ||||
| Age and sex | All ages, mean 7 yr, 2:1 male | 10-35 yr, 2:1 male | 15-30 yr, 6:1 male | Adults, 2:1 male |
| Acute nephritic syndrome | 90% | 50% | 90% | 90% |
| Asymptomatic hematuria | Occasionally | 50% | Rare | Rare |
| Nephrotic syndrome | 10%-20% | Rare | Rare | 10%-20% |
| Hypertension | 70% | 30%-50% | Rare | 25% |
| ARF | 50% (transient) | Very rare | 50% | 60% |
| Other | Latent period of 1-3 wk | Follows viral syndromes | Pulmonary hemorrhage; iron deficiency anemia | None |
| Laboratory findings | ↑ ASLO titers (70%) Positive streptozyme (95%) ↓ C3-C9; nl C1, C4 |
↑ Serum IgA (50%) IgA in dermal capillaries | Positive anti-GBM antibody | Positive ANCA in some |
| Immunogenetics | HLA-B12, D “EN” (9)∗ | HLA-Bw 35, DR4 (4)∗ | HLA-DR2 (16)∗ | None established |
| Renal Pathology | ||||
| Light microscopy | Diffuse proliferation | Focal proliferation | Focal → diffuse proliferation with crescents | Crescentic GN |
| Immunofluorescence | Granular IgG, C3 | Diffuse mesangial IgA | Linear IgG, C3 | No immune deposits |
| Electron microscopy | Subepithelial humps | Mesangial deposits | No deposits | No deposits |
| Prognosis | 95% resolve spontaneously 5% RPGN or slowly progressive | Slow progression in 25%–50% | 75% stabilize or improve if treated early | 75% stabilize or improve if treated early |
| Treatment | Supportive | Uncertain (options include steroids, fish oil, and ACEIs) | Plasma exchange, steroids, cyclophosphamide | Steroid pulse therapy |
RPGN, idiopathic rapidly progressive GN.
∗ Relative risk.
Modified from Kliegman RM, Greenbaum L, Lye P: Practical Strategies in Pediatric Diagnosis and Therapy, 2nd ed. Philadelphia, Saunders, 2004, p. 427.
Diagnosis
Labs
 U/A : hematuria (dysmorphic erythrocytes and RBC casts), proteinuria
Imaging
 CXR: r/o pulmonary congestion, Wegener’s granulomatosis, and Goodpasture’s syndrome
 Renal U/S: evaluate renal size and determine extent of fibrosis. A kidney size of <9 cm suggests extensive scarring and ↓ likelihood of reversibility.
 Echo: in pts w/new cardiac murmurs or + blood cultures to r/o endocarditis and pericardial effusion
TABLE 9-12
Antigens Identified in GN
| Poststreptococcal GN Anti-GBM disease IgA nephropathy |
Streptococcal pyrogenic exotoxin B (SPEB), plasmin receptor α3 type IV collagen (likely induced by molecular mimicry) Possibly no antigen but rather polymerized polyclonal IgA (? superantigen driven) |
| Membranous nephropathy | Phospholipase A2 receptor (idiopathic), neutral endopeptidase (NEP) in podocyte (congenital), HBeAg (hepatitis associated) |
| Staphylococcus aureus–associated GN | Staphylococcus superantigens induce polyclonal response; not necessarily antigen in glomeruli |
| Membranoproliferative GN | HCV and HBsAg in hepatitis-associated MPGN |
| ANCA-associated vasculitis | Proteinase 3 (c-ANCA) and myeloperoxidase (p-ANCA) in neutrophils; antibodies to lysosome-associated membrane protein 2 (LAMP-2) on endothelial cells (likely induced by molecular mimicry to fimbriated bacterial antigens) |
From Floege J, John RJ, Feehally J (eds): Comprehensive Clinical Nephrology, 4th ed. Philadelphia, Saunders, 2010.
Treatment
 Avoidance of salt if edema or HTN is present
 ↓ Protein intake (≈0.5 g/kg/day) in pts w/renal failure
 Fluid restriction in pts w/significant edema; furosemide PRN
 Avoidance of ↑ K+ foods
 Correction of electrolyte abnlities (hypocalcemia, hyperkalemia) and acidosis (if present)
 ACEIs or ARBs for HTN
 Rx of specific cause of nephritic syndrome:
M. Tubulointerstitial Disorders
1. Acute Tubular Necrosis
Definition
Etiology
 Perfusion deficits (prolonged prerenal failure, shock, hypovolemia, sepsis, pancreatitis, ↓ output states, CABG surgery, aortic aneurysm repair)
 Pigment nephropathy: myoglobinuria (rhabdo), hemoglobinuria
 Contrast agent toxicity
 Drug toxicity: AGs, cisplatinum, pentamidine, lithium, amphotericin
 Crystal-induced ARF: acyclovir, sulfonamides, MTX, oxalate from ethylene glycol ingestion or high doses of vitamin C
 Uric acid deposition in the tumor lysis syndrome
Diagnosis
Labs
 Serial ↑ in Cr and BUN varies w/catabolic rate and protein intake.
 Oliguria or nonoliguria occurs, but at relatively fixed outputs.
 Variable response to high-dose furosemide: may allow diuresis but does not change the underlying lesion.
 Pulmonary vascular congestion and hyperkalemia represent the most important parameters to follow: pulmonary artery catheter may be necessary to monitor fluid status.
 Urinary Na+ is ↑, generally >30.
 Urinary osmolarity is <350 mOsm/kg.
 Urinary Cr is ↓ in relation to urinary volume, leading to a U/P Cr level <20.
 FENa >1
 Urinary sediment contains “muddy brown” renal tubular casts.
 Myoglobinuria and serum CPK are ↑ in rhabdo.
Treatment
 Most pts w/ARF recover w/conservative management (fluid monitoring, protein restriction, drug adjustments, and dietary or Kayexalate K+ control).
 Dialysis, usually temporary, may become necessary.
N. Kidney Cystic Disorders
O. Urolithiasis
Etiology
 Absorption of Ca in the small bowel: type I absorptive hypercalciuria (independent of Ca intake)
 Idiopathic hypercalciuria nephrolithiasis is the most common dx for pts w/Ca stones; the dx is made only if there is no hypercalcemia and no known cause of hypercalciuria.
 ↑ Vitamin D synthesis (e.g., secondary to renal PO4-3 loss: type III absorptive hypercalciuria)
 Renal tubular malfunction w/inadequate reabsorption of Ca and resulting hypercalciuria
 Heterozygous mutations in the NPT2a gene resulting in hypophosphatemia and urinary PO4-3 loss
 Hyperparathyroidism w/resulting hypercalcemia
 Uric acid level (metabolic defects, dietary excess)
 Chronic diarrhea (e.g., IBD) w/oxalate absorption
 Type 1 (distal tubule) RTA (<1% of Ca stones)
 Chronic hydrochlorothiazide Rx
 Chronic infections w/urease-producing organisms (e.g., Proteus, Providencia, Pseudomonas, Klebsiella). Struvite or Mg ammonium PO4-3 crystals are produced when the urinary tract is colonized by bacteria, thus producing concentrations of ammonia.
 Abnl excretion of cystine
 ChemoRx for malignant neoplasms
Diagnosis
H&P
 Stones may be asymptomatic or may cause sudden onset of flank tenderness.
 Pain may be referred to the testes or labium (progression of stone down the urinary ureter) or may radiate anteriorly over to the abd and result in intestinal ileus.
Labs

TABLE 9-13
Comparison of Clinical Features of Cystic Kidney Diseases
| Disease | Inheritance | Frequency | Gene Product | Age of Onset | Cyst Origin | Renomegaly | Cause of ESRD | Other Manifestations |
| ADPKD | AD | 1:400-1,000 | Polycystin-1 Polycystin-2 |
20s and 30s | Anywhere (including Bowman’s capsule) | Yes | Yes | Liver cysts |
| Cerebral aneurysms | ||||||||
| Hypertension | ||||||||
| Mitral valve prolapse | ||||||||
| Kidney stones | ||||||||
| UTIs | ||||||||
| ARPKD | AR | 1:6,000-10,000 | Fibrocystin/polyductin | First yr of life | Distal nephron, CD | Yes | Yes | Hepatic fibrosis |
| Pulmonary hypoplasia | ||||||||
| Hypertension | ||||||||
| ACKD | No | 90% of ESRD pts at 8 yr | None∗ | Years after onset of ESRD | Proximal and distal tubules | Rarely | No | None |
| Simple cysts | No | 50% in those >40 yr | None∗ | Adulthood | Anywhere (usually cortical) | No | No | None |
| Nephronophthisis | AR | 1:80,000 | Nephrocystins (NPHP1–9) | Childhood or adolescence | Medullary DCT | No | Yes | Retinal degeneration; neurologic, skeletal, hepatic, cardiac malformations |
| MCKD | AD | Rare | Uromodulin, others | Adulthood | Medullary DCT | No | Yes | Hyperuricemia, gout |
| MSK | No | 1:5,000-20,000 | None∗ | 30s | Medullary CD | No | No | Kidney stones |
| Hypercalciuria | ||||||||
| Tuberous sclerosis | AD | 1:10,000 | Hamartin (TSC1), tuberin (TSC2) | Childhood | Loop of Henle, DCT | Rarely | Rarely | Renal cell carcinoma |
| Tubers, seizures | ||||||||
| Angiomyolipoma | ||||||||
| Hypertension | ||||||||
| VHL syndrome | AD | 1:40,000 | VHL protein | 20s | Cortical nephrons | Rarely | Rarely | Retinal angioma, CNS hemangioblastoma, renal cell carcinoma, pheochromocytoma |
| Oral-facial-digital syndrome-1 | XD | 1:250,000 | OFD1 protein | Childhood or adulthood | Renal glomeruli | Rarely | Yes | Malformation of the face, oral cavity, and digits; liver cysts; mental retardation |
| Bardet-Biedl syndrome | AR | 1:65,000-160,000 | BBS 1-14 | Adulthood | Renal calyces | Rarely | Yes | Syndactyly and polydactyly, obesity, retinal dystrophy, male hypogenitalism, hypertension, mental retardation |
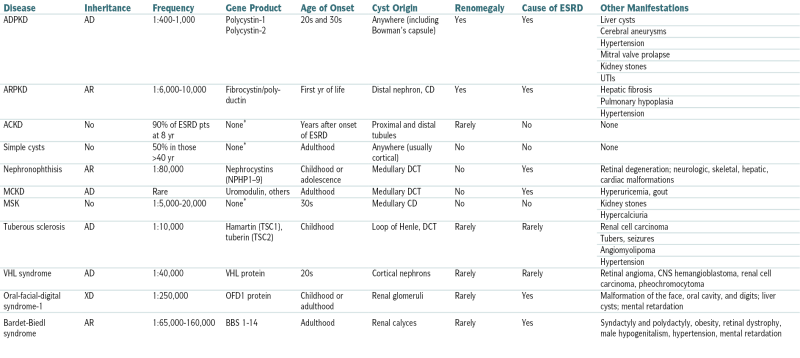
ACKD, Acquired cystic kidney disease; CD, collecting duct; DCT, distal convoluted tubule; MCKD, medullary cystic kidney disease; MSK, medullary sponge kidney; TSC, tuberous sclerosis complex; VHL, von Hippel–Lindau.
From Goldman L, Schafer AI (eds): Goldman’s Cecil Medicine, 24th ed. Philadelphia, Saunders, 2012.
Imaging
 Plain films of the abd can identify radiopaque stones (Ca, uric acid stones).
 Unenhanced (non–contrast-enhanced) helical CT scan has a sensitivity of 15% to 100% and a specificity of 94% to 96%.
Treatment
 ↑ Water or other fluid intake (doubling of previous fluid intake unless pt has h/o CHF or fluid overload)
 Specific Rx tailored to the stone type:
 Surgical Rx in pts w/severe pain unresponsive to medication and pts w/persistent fever or nausea or significant impediment of urine flow:
 Rx of ureteral stones:
Clinical Pearls
 >50% of pts will pass the stone within 48 hr.
 Stones will recur in 50% of pts within 5 yr if no medical Rx is provided.
[/level-membership-for-internal-medicine-category][not-level-membership-for-internal-medicine-category]
B. Water Balance
C. Replacement Fluids
D. Acid-Base Disorders
1. Approach to Acid-Base Disorders
Table 9-2 describes acid-base abnlities and appropriate compensatory responses for simple disorders.
or
or
or
where UNa is urine sodium concentration, V is urine flow rate, PNa is plasma sodium concentration, UCr is urine creatinine concentration, and PCr is plasma creatinine concentration.
| Fractional excretion of potassium (FEK) | |
FEK <10% indicates renal cause FEK >10% indicates extrarenal cause Values can be increased in cases of chronic renal failure |
| Transtubular potassium gradient | or |
Gradient <6-8 indicates renal cause Gradient >6-8 indicates extrarenal cause Values can be increased in cases of chronic renal failure |
2. Metabolic Acidosis
Etiology
Metabolic acidosis w/AG (AG acidosis). The mnemonic MUDPILES is useful to remember the causes of AG acidosis:TABLE 9-1
Replacement Fluids
| Fluids | Na (mEq/L) | K (mEq/L) | Cl (mEq/L) | HCO3− (mEq/L) | Ca (mEq/L) | Kcal/L |
| ½ Nl saline | 77 | — | 77 | — | — | — |
| Nl saline | 154 | — | 154 | — | — | — |
| D5W | — | — | — | — | — | 170 |
| D10W | — | — | — | — | — | 340 |
| Lactated Ringer’s solution | 130 | 4 | 109 | 28∗ | 3 | 9 |
| Extracellular fluid | 141 | 4 | — | 27 | 5 | — |
∗ Lactate converted to HCO3− in liver.
From Nguyen TC, Abilez OJ (eds): Practical Guide to the Care of the Surgical Patient: The Pocket Scalpel. Philadelphia, Mosby, 2009.
where PNa is plasma sodium concentration.
where the osmolar clearance is calculated as:
Metabolic acidosis w/nl AG (hyperchloremic acidosis)Diagnosis (Fig. 9-3)
Measurement of urinary AG (UNa+ + UK+ − UCl−) and urinary pH is useful in the ddx of hyperchloremic metabolic acidosis:Treatment
3. Renal Tubular Acidosis (RTA)
Disorder characterized by an inability to excrete H+ or inadequate generation of new HCO3−. Four types:Etiology
Type 2 RTA: Fanconi’s syndrome, primary hyperparathyroidism, MM, medications (acetazolamide) Type 4 RTA: DM, sickle cell disease, Addison’s disease, urinary obstructionDiagnosis
Labs
ABGs: metabolic acidosis, with nl AG Serum K+ ↓ in RTA types 1 and 2, nl in type 3, and high in type 4 Minimum urine pH >5.5 in RTA type 1 and <5.5 in types 2, 3, and 4 Urinary AG 0 or (+) in all types of RTATreatment
4. Respiratory Acidosis
Etiology
Pulmonary disease (COPD, severe pneumonia, pulmonary edema, interstitial fibrosis)FIGURE 9-2 Map for acid-base disorders. (From Ferri F: Practical Guide to the Care of the Medical Patient, 8th ed. St. Louis, Mosby, 2011.)
Airway obstruction (foreign body, severe bronchospasm, laryngospasm) Thoracic cage disorders (pneumothorax, flail chest, kyphoscoliosis) Defects in muscles of respiration (myasthenia gravis, hypokalemia, muscular dystrophy) Defects in PNS (amyotrophic lateral sclerosis, poliomyelitis, GBS, botulism, tetanus, organophosphate poisoning, spinal cord injury) Depression of respiratory center (anesthesia, narcotics, sedatives, vertebral artery embolism or thrombosis, ICP) Failure of mechanical ventilatorDiagnosis
Treatment
Correction of the underlying etiology5. Metabolic Alkalosis
Etiology
Divided into chloride-responsive (urinary chloride <20 mEq/L) and chloride-resistant (urinary chloride level >20 mEq/L) formsChloride Responsive
Vomiting NG suctionFIGURE 9-3 Diagnostic approach to metabolic acidosis. (From Vincent JL, Abraham E, Moore FA, et al [eds]: Textbook of Critical Care, 6th ed. Philadelphia, Saunders, 2011.)
FIGURE 9-5 Workup of metabolic alkalosis. (From DuBose TD Jr: Acid-base disorders. In: Brenner BM [ed]: Brenner and Rector’s The Kidney, 8th ed. Philadelphia: Saunders, 2008, p. 513.)
Diuretics Posthypercapnic alkalosis Stool losses (laxative abuse, cystic fibrosis, villous adenoma) Massive blood transfusion Exogenous alkali administrationChloride Resistant
Hyperadrenocorticoid states (Cushing’s syndrome, primary hyperaldosteronism, secondary mineralocorticoidism [licorice, chewing tobacco]) Hypomagnesemia Hypokalemia Bartter’s syndromeDiagnosis
Treatment
Chloride-responsive forms: saline administration and correction of accompanying hypokalemia Chloride-resistant forms: correction of underlying cause and associated K+ depletion6. Respiratory Alkalosis
Etiology
Hypoxemia (pneumonia, PE, atelectasis, high-altitude living) Drugs (salicylates, xanthines, progesterone, epinephrine, thyroxine, nicotine) CNS disorders (tumor, CVA, trauma, infections) Psychogenic hyperventilation (anxiety, hysteria) Hepatic encephalopathy Gram(−) sepsis Sudden recovery from metabolic acidosis Assisted ventilationDiagnosis
Treatment
Rx is aimed at its underlying cause; symptomatic pts w/psychogenic hyperventilation often require some form of rebreathing apparatus (e.g., paper bag, breathing 5% CO2 by mask).E. Disorders of Sodium Homeostasis
1. Hyponatremia
Etiology
Isovolemic
SIADH Water intoxication (e.g., schizophrenic pts, primary polydipsia, Na+-free irrigant solutions, multiple tap-water enemas, dilute infant formulas). These entities are rare and often associated w/a deranged ADH axis. Renal failure Reset osmostat (e.g., chronic active TB, carcinomatosis) Glucocorticoid deficiency (hypopituitarism) Hypothyroidism Thiazide diuretics, NSAIDs, carbamazepine, amitriptyline, thioridazine, vincristine, cyclophosphamide, colchicine, tolbutamide, chlorpropamide, ACEIs, clofibrate, oxytocin, SSRIs, amiodaroneHypovolemic
Renal losses (diuretics, partial urinary tract obstruction, salt-losing renal disease) Extrarenal losses: GI (vomiting, diarrhea), extensive burns, third spacing (peritonitis, pancreatitis) Adrenal insufficiencyHypervolemic
CHF Nephrotic syndrome Cirrhosis Pregnancy Isotonic hyponatremia (nl serum osmolality) Pseudohyponatremia (↑ serum lipids and serum proteins). Newer Na+ assays eliminate this problem. Isotonic infusion (e.g., glucose, mannitol) Hypertonic hyponatremia (serum osmolality) Hyperglycemia: each 100 mg/dL ↑ in blood glucose level above nl ↓ plasma Na+ concentration by 1.6 mEq/L Hypertonic infusions (e.g., glucose, mannitol)Diagnosis
Treatment
Isovolemic Hyponatremia
SIADH: fluid restriction unless acutely symptomatic Acute symptomatic pt: hypertonic 3% to 5% saline solution infusion; give 200 to 500 mL slowly, followed by fluid restriction to 750 mL/day for 24 to 48 hr. Hypertonic saline can be combined w/furosemide to limit Rx-induced expansion of the ECF volume.Hypovolemic Hyponatremia
0.9% NS infusionHypervolemic Hyponatremia
Na+ and water restriction. The combination of captopril and furosemide is effective in pts w/hyponatremia resulting from CHF.Chronic Hyponatremia
Correction of chronic hyponatremia should be kept at a rate <10 mEq/L (mmol/L) in any 24-hr period to prevent myelinolysis, a neurologic disorder that can occur after rapid correction of hyponatremia. Initially named central pontine myelinolysis, this disease is now known also to affect extrapontine brain areas and is known as osmotic demyelination syndrome. Manifestations of myelinolysis usually evolve several days after correction of hyponatremia. Typical features are disorders of UMNs, spastic quadriparesis and pseudobulbar palsy, and mental disorders ranging from mild confusion to coma. Death may occur. The motor and localizing signs of myelinolysis differ from those of the generalized encephalopathy that is caused by untreated hyponatremia.
FIGURE 9-7 Algorithm for treatment of hyponatremia. (From Cameron AM: Current Surgical Therapy, 10th ed. Philadelphia, Saunders, 2011.)
Clinical Pearls
In general, the serum Na+ should be corrected only halfway to nl in the initial 24 hr (but not >1 mEq/L/hr) to prevent complications from rapid correction (cerebral edema, myelinolysis, seizures). A slower correction rate is indicated in pts w/chronic hyponatremia. In symptomatic pts w/hyponatremia, an ↑ in the serum Na+ concentration of 2 mEq/L/hr to a level of 120 to 130 mEq/L is considered safe by some experts; however, less rapid correction may be indicated in pts w/severe or chronic hyponatremia.2. Hypernatremia
Etiology
Isovolemic (↓ TBW, nl TBNa, and ECF) Hypervolemic (TBW, TBNa, and ECF) Hypovolemic: loss of H2O and Na+ (H2O loss > Na+)Diagnosis
FIGURE 9-8 Algorithm for treatment of hypernatremia. (From Cameron AM: Current Surgical Therapy, 10th ed. Philadelphia, Saunders, 2011.)
Treatment
Isovolemic Hypernatremia
Fluid replacement w/D5W. Correct only half of estimated water deficit in initial 24 hr. The rate of correction of serum Na+ should not exceed 1 mEq/L/hr in acute hypernatremia or 0.5 mEq/L/hr in chronic hypernatremia. Calculate water deficit in hypernatremic pts. H2O deficit (in liters) = 0.6 × BW (kg) × ([measured Na+/140] − 1)Hypovolemic Hypernatremia
Fluid replacement is achieved w/isotonic saline solution. The rate of correction of plasma osmolarity should not exceed 2 mOsm/kg/hr.Hypervolemic Hypernatremia
Fluid replacement w/D5W (to correct hypertonicity) is instituted after use of loop diuretics (to ↑ Na+ excretion).F. Disorders of Potassium Homeostasis
1. Hypokalemia
Etiology
Cellular shift (redistribution) and undetermined mechanisms Renal excretionFIGURE 9-9 Diagnostic algorithm for hypokalemia. (From Ferri FF: Ferri’s Best Test: A Practical Guide to Clinical Laboratory Medicine and Diagnostic Imaging, 2nd ed. Philadelphia, Mosby, 2010.)
[/not-level-membership-for-internal-medicine-category]
