[level-membership-for-internal-medicine-category]
Chapter 2 Naturopathic diagnostic techniques
INTRODUCTION
The diagnostic process should flow from an extensive case history and physical examination to a differential diagnosis that lists possible alternatives for the presentations within the patient. An awareness of different types of pathology that may lead to particular signs and symptoms will assist the naturopath to narrow down the list of possibilities and select the most likely hypothesis.1
Further investigations, including pertinent biochemical evaluations, should then be performed to point to a more definitive diagnosis. This diagnosis, along with any other health issues that may have presented during the investigation, should all be used to address a patient from a holistic perspective and develop an adequate management plan. Clinical methods of diagnosis are best used in combination, and when interpreted alone possess definite disadvantages. Physical signs in conjunction with dietary and biochemical methods may provide a clearer picture of the physiology or pathophysiology at play in each individual. This chapter provides an overview of a variety of physical examination techniques such as anthropometric data, body signs and symptoms, gastrointestinal palpation and iridology, as well as an outline of dietary assessment methods and biochemical evaluations via a variety of pathology testing methods. Some of these types of assays have robust scientific bases, while others that have not been so extensively studied have
been included as an overview of available techniques. The chapter then concludes with some useful traditional Chinese medicine analytical methods that have been adapted for naturopathic diagnostic purposes. A section on factors that affect nutritional status has also been included as a tool to assist with identifying potential confounding variables that should also be taken into consideration.
EVIDENCE-BASED CLINICAL DIAGNOSTIC TECHNIQUES
Physical examination
Naturopathic physical examination should be systematic and precisely recorded, while relating particular signs to standardised definitions. Assessment of a patient begins as soon as the consultation starts. A person’s disposition, facial complexion and expression, body size and shape, mobility, gait and posture, as well as the way they conduct or hold themselves, may provide important clues in relation to their mental and physical states.1 A general inspection of the whole body may reveal external evidence of a disease, for example obesity, wasting, arthritis, abnormal stature or development, presence of pain, jaundice, pallor or cyanosis.2
Warm, sweaty palms on the initial handshake may indicate an overactive thyroid due to increased circulation with blood vessel dilation. In contrast, an underactive thyroid may cause the hands to be cool and dry in texture.3 Persons with alcohol dependence may attempt to conceal their addiction; however, certain signs may provide indicators such as plethoric faces, rhinophymic noses and alcoholic aroma. Smokers may also be revealed by their scent or nicotine-stained fingers. A person’s facial expression may portray psychiatric illness such as depression, while conversation may alert to an anxiety disorder. In developing countries, malnutrition with subsequent wasting and loss of weight is a relatively common occurrence; however, when these signs appear in more developed populations, naturopaths should be alerted to potential underlying pathological conditions such as diabetes, thyrotoxicosis, malabsorption syndromes or chronic infections.4
Anthropometric data
Height and weight should be determined to assess if a person is over- or underweight. Waist to hip ratio (WHR) is the most useful predictor of cardiovascular disease mortality while body mass index (BMI = weight (kg)/height (m2)) may be a better predictor of increased mortality from raised blood pressure (see Table 2.1).5
Table 2.1 Data that predict increased mortality from cardiovascular disease and raised blood pressure5
| FEMALES | MALES |
|---|---|
| WHR > 0.8 | WHR > 0.9 |
| Waist circumference of > 88 | Waist circumference of > 102 |
| BMI > 25 | BMI > 30 |
Some form of body composition analysis, whether via skin fold or BIA, should also be performed to determine lean mass or protein sufficiency. Protein insufficiency may have widespread ramifications. Hypoproteinaemia can cause deviations in circulating levels of certain micronutrients, such as iron,6 zinc, copper7 and potentially selenium.8
Body signs and symptoms
Physical signs may be important aids in identifying nutritional dysfunction, though care should also be taken during case taking as particular signs may not be specific and may relate to non-biological factors (such as injury or excessive sun exposure). Signs may also differ between populations and may also vary over time periods within a population.9 Any findings suggesting an abnormality should be considered a clue rather than a diagnosis. Table 2.2 outlines a variety of signs and symptoms as documented in research literature.
| SYSTEM | SIGN | POSSIBLE NUTRIENT DEFICIENCIES |
|---|---|---|
| Biliary | Fatty liver deposits | Omega-6 EFA10 |
| Cardiovascular |
Bioelectrical impedance analysis
Bioelectrical impedance analysis measures the impedance or opposition to the flow of an electric current (usually 50 kHz) through the body fluids contained mainly in the lean and fat tissue. This is generally low in lean tissue, where intracellular fluid and electrolytes are primarily contained, but high in fat tissue. In practice, a small constant current is passed between electrodes spanning the body and the voltage drop between electrodes provides a measure of impedance. The resulting impedance reading is proportional to the total body water volume. Prediction equations are used to convert impedance to a corresponding estimate of total body water.127 Lean body mass is then calculated from this estimate using an assumed hydration fraction for lean tissue. Fat mass may then be calculated by subtracting lean mass from total body weight. Although commonly accepted as a measure of these markers many naturopathic practitioners adopt novel conclusions from this technique that are yet to build an evidentiary base.
Gastrointestinal palpation
Palpitation of the abdominal area may reveal various underlying organ pathologies such as liver disease or gall bladder insufficiencies (see Figure 2.1a):
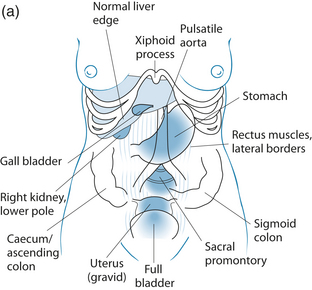
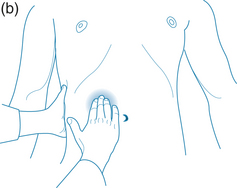
Figure 2.1 (a) Normally palpable abdominal structures (b) Palpating the liver
Source: Adapted from Jarvis 200764
Palpation may also locate a mass. If so, it must be distinguished from a normally palpable structure or enlarged organ and note must be taken of its location, size, shape, tenderness, consistency, surface, mobility, pulsatility and tenderness. Gastrointestinal palpation may also be used in conjunction with other abdominal physical examinations, such as auscultation and percussion, to elicit required information. An example of this is that a fluid wave indicates ascites, which may occur with heart failure, portal hypertension, cirrhosis of the liver, hepatitis, pancreatitis and cancer.64
Palpation should begin in the upper middle region below the ribcage where the stomach is located. To the right along the line of the ribs is the gallbladder and further to the right is the liver. Across on the far left of the stomach, the spleen is located somewhat deeper than the previous organs. If you roll the person onto their right side the pancreas may be felt if deep pressure is placed from near the side moving toward the midline and slightly upward. Next the area around the umbilicus is the small intestines, while slightly above and toward the right is the duodenum. Distal to the small intestine is the ascending colon with the appendix situated below the latter. The jejunum is located to the left of the small intestine; continuing in this direction the descending colon with the sigmoid is found below. From this position moving medially, above the pubic bone, is the rectal sheath (see Figure 2.1).
Nutritional assessment
Clinical signs due to insufficient nutrition may occur primarily due to underlying changes in metabolic processes.65 Optimal nutrition is indispensible for proper physiological functioning, where adequate intakes need to be considered with factors such as impaired digestion and absorption. Excessive losses may result from chronic haemorrhage or catabolic states, as well as from the use of certain medications such as diuretics or corticosteroids.66 At any time a need is elevated, the risk of developing a deficiency is increased. Adequate macro- and micronutrients are crucial for growth and maintenance of tissues, preventing cell damage and mutation,67 as well as immune system function68 and may decrease the likelihood of chronic disease development. It is considered by some investigators that an underlying condition linked to nutritional status may cause undefined or subsyndromal symptoms such as irritability, insomnia, lethargy and difficulty in concentrating.69 If tissue stores become depleted, various clinical manifestations may become apparent and, if left untreated, progress to deficiency disease states.
For example, protein deficiency can affect the status of many other nutrients, namely type II nutrients such as phosphorus, potassium, sodium, chlorine, water, nitrogen, sulfur, zinc and magnesium, as well as the essential amino acids. Deficiency of any one of these nutrients may result in cessation of growth, increased catabolism and, eventually, loss of all tissue components.70 These nutrients are required to be absorbed in approximately the same ratios as occur in the body. Secondary deficiencies may manifest if supplements that do not contain all of the necessary nutrients for tissue synthesis are given. It is possible to unbalance the diet and cause a greater level of malnutrition via the dilution of any potentially existing marginal levels of these nutrients.71 The Oxford Textbook of Medicine states:
These types of deficiency states have always posed problems for clinicians because of the difficulty in making a diagnosis, the non-specificity of weight loss and the lack of confirmatory tests. This has led these nutrients to be largely ignored and their importance to be grossly underestimated. As a group, their deficiency is responsible for malnutrition in half the world’s children and to the unrecognised problems of ill health in many others.70
These interactions may be bidirectional. For example, protein deficiency can significantly affect vitamin A metabolism, and in turn its deficiency can influence protein metabolism. Protein insufficiency principally affects vitamin A status via mechanisms such as impeding intestinal absorption, release from the liver and blood transport. In light of this, protein deficiency can lead to a secondary deficiency of this vitamin, despite an adequate intake. Vitamin A deficiency, on the other hand, can also influence the metabolism of proteins by lowering the plasma levels of retinol-binding protein, impairing nitrogen balance and decreasing the synthesis of other specific proteins such as enzymes and hormones.35
Dietary assessment
Dietary assessment methods may be controversial as they require a patient’s recall of either their usual or their actual diet and may be influenced by the patient not consuming a representative diet during the assessment period, along with variations in perceived quantities also having the potential to occur. Retrospective methods such as 24-hour recall, semi-quantitative food frequency questionnaires and diet histories all have the disadvantage of assessing memory, which may limit the quality of information presented. Factors that have been documented to affect recall accuracy include food consumption patterns, gender, age, weight status and even mood.72
Other methods such as 3–7-day food diaries and weighed food records may be better alternatives. This information is documented at the actual time the food is consumed. The information gained from such exercises may be analysed by various software programs to provide a more detailed assessments of actual nutrient intakes.73 Various commercial programs are available. Alternatively, food table information databases are accessible on the internet for various nations including Australia,74 the USA,75 Canada76 and Europe.77 These methods may also be subject to the bias of variations in a patient’s change of dietary choices during the assessment period, as well as deviations in perceived quantities for the former method. Although weighed records may be the most accurate, this process is extremely labour intensive and may have issues with compliance. Digestion and absorption may also affect the accuracy of intake estimates on body status.14
Pathology testing
Blood analysis
The analysis of blood cells may be a useful tool to confirm a suspected dysfunction or deficiency. These may also play an important role in monitoring the efficacy of a treatment program and to highlight improvements in a patient’s condition. Particular reference ranges for specific assays may be laboratory, age and gender specific; therefore it is best to consult national standards for their appropriate values. A list of Australian reference ranges can be found in Appendix 4.
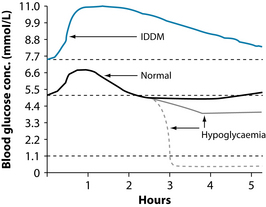
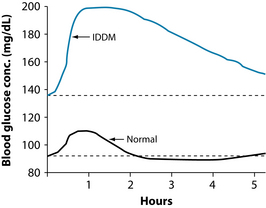
For example, glucose tolerance testing may be a useful tool to assess blood sugar regulation (see Figures 2.2 and 2.3). The test is performed immediately following a fast of at least 8 hours, but no more than 16 hours. A fasting blood glucose test is performed immediately prior to the glucose tolerance testing. If the level is ≥ 7.0 mmol/L, the glucose tolerance testing is usually not performed, as this level is diagnostic of diabetes mellitus. Gestational diabetes mellitus or suspected diabetes may be indicated when the fasting glucose is 5.5–6.9 mmol/L or a random glucose level is 7.8–11.0 mmol/L. A dose of oral glucose is then administered at 75 g for an adult and 1.75 g/kg body weight (75 g maximum) for children, after an overnight fast in subjects consuming at least 150 g of carbohydrate daily for 3 days prior to the test.78 Medications that impair glucose tolerance, such as diuretics, glucocorticoids, nicotinic acid and phenytoin, may invalidate results.79
Validity of direct micronutrient analyses
Assessment of mineral status has traditionally included body signs and symptoms, although in recent times it has relied on the quantification of mineral element concentrations in a variety of components and cells in the blood. This strategy is based on the assumption that circulating mineral concentrations reflect organ and tissue mineral contents. Although methods such as these have been used, it has not been a sensitive approach for the evaluation of the total body nutritional status of mineral elements.80
The term ‘acute phase response’ is used to describe a short-term metabolic change, encompassing increased plasma levels of particular proteins and decreased levels of others. These responses occur not only in tissue injury such as infection, surgical or other trauma, burns, tissue infarction and a variety of idiopathic inflammatory states, but have also been documented in pregnancy, during the first few days in a neonate’s life and in neoplastic states.81 Several frequently used indicators of micronutrient status are affected by the acute phase response and may not effectively reflect micronutrient status. During an acute phase response, there can be a redistribution of micronutrients without actual alterations in the total body content of the micronutrient, resulting in commonly used serum indicators producing inaccurate measurements. On the other hand, requirements or losses may be amplified during this time and also occasionally in combination with impaired assimilation, inevitably resulting in an alteration in body stores.82
Micronutrients are also disseminated among circulating, storage and tissue pools, depending on the chemical nature of their environment. Physiological stress, intercompartmental fluid shifts, acid–base balance and recent dietary intake can all influence a nutrient’s existence within a particular pool. Hypoproteinaemia during malnutrition alters the circulating levels of certain nutrients such as iron,6 zinc, copper7 and potentially selenium,8 regardless of tissue store adequacy, due to them circulating in plasma bound to protein carriers.67 Plasma levels of vitamins A, C, E and B6 have also been shown to be altered during an acute phase response.83 In these instances a measure of an acute phase protein such as C-reactive protein, would be useful in identifying the presence of an acute phase response.6
Furthermore, levels of micronutrients may also be modified during the haemodilution at certain stages of pregnancy or surgery and have been shown to be influenced by exercise, with the most evident changes occurring throughout the inflammatory processes of infection84 or trauma. Nutrient levels in both plasma and serum may also appear to be sufficient, even when there is verification of functional impairment due to the serum concentrations of some nutrients, such as calcium, vitamin A and zinc, being strongly homeostatically regulated,85,86 therefore providing little information on total body status. In cases such as these, alternative biochemical indicators may be needed, such as the assay of intracellular enzymes or other metabolites known to be dependent upon an adequate supply of a micronutrient.87
Functional laboratory tests assess the extent of functional impairments during a specific nutrient deficiency and as such have greater biological implication than commonly used static laboratory tests. Functional biochemical tests may involve the measurement of an abnormal metabolic product in blood or urine samples, which is caused by the overflow of an intermediary by-product, due to a lack of a nutrient-dependent enzyme. For some nutrients, reduction in the activity of enzymes that require a nutrient as a coenzyme or prosthetic group can also be assayed.26 Here the underlying assumption is that loss of such functions is biologically more important than the levels of a mineral element in circulation or in a tissue or organ. In light of this concept, various functional parameters may serve as diagnostic tests to verify the adequacy of a variety of vitamins and minerals to permit cells, tissues, organs, anatomical systems and the individual to optimally carry out nutrient-dependent biological functions.80
Table 2.3 outlines specific nutrients and the best readily available assessment methods to determine status, as well as factors that may affect results.
| NUTRIENT | ASSAY | CONFOUNDING VARIABLES |
|---|---|---|
| Vitamin A | Retinol binding protein: transthyretin (prealbumin) | |
| B1 | Red cell thiamine pyrophosphate | |
| B2 | Erythrocyte glutathione reductase activity coefficient | |
| B6 | Urinary kynurenate or xanthurenate + PLP coenzyme | |
| B12 | Methylmalonic acid in serum | |
| Folic acid | Red cell folate | |
| Vitamin C | Leukocyte vitamin C | |
| Vitamin D | 25-hydroxy vitamin D | |
| Vitamin E | Plasma α-tocopherol:cholesterol ratio |
Urine testing
Nutrient status assessment
Assessment of the majority of vitamins and trace elements in urine is of limited value as most are not under homeostatic regulation. Excretion may be a direct measure of intake as opposed to active retention even in cases of whole body deficiency. Large dosages of supplements at any given time can lead to high levels of excretion.14 Urine specimens may be used for the assessment of recent dietary intake of some trace elements such as chromium, iodine and selenium, as well as protein and the water-soluble B and C vitamins, if renal function is normal. This type of assessment is invalid in cases where metabolites are not excreted in proportion to amounts consumed, absorbed and metabolised, such as vitamins A, D, E and K.26
In relation to the minerals for which the kidneys are not involved in maintaining homeostasis, measurement of urinary excretion rates does not provide useful information on dietary intake or mineral status. In contrast, excretion rates of iodine for which the kidneys have a prominent role in homeostasis provide a useful biomarker of dietary intake of this mineral.97 In circumstances such as infections, after trauma, with the use of antibiotics or other medications, as well as in conditions that produce negative balance, increases in urinary excretion may occur regardless of depletion of body nutrient stores.26
Urinary organic acid assays
These tests may be a useful tool for the detection of organic acids or heavy metals. Organic acids derived from the metabolic conversion of dietary proteins, fats and carbohydrates provide a unique chemical profile of cellular health. Key intermediate metabolic markers of cellular physiology are quantified to assess compromised energy production, detoxification, intestinal microbial activity, neurotransmitter metabolism and nutrient deficiencies. Clinically, these markers offer valuable information into possible causative factors of dysfunctional cellular physiology physical and mental performance, as well as overall health status.98
Urinalysis
Dipstick urinalysis is a method of urine analysis involving dipping a plastic strip with a series of pads that change colour according to specific chemical reactions into a sample of urine. Results are then read off this strip by comparing it to a chart that shows levels of substances in the urine, depending on the colour change that occurred. A variety of substances, including protein, glucose, bilirubin, blood and pH, may be investigated at one time. Despite being simple, fast and easy to use, many dipsticks may not be completely accurate and therefore may provide false positive results.99
Urinary indican
The production of indicans such as indoxyl potassium sulfate and indoxyl glucoronate is thought to reflect bacterial activity in the small and large intestines. As such it has been used as an indicator of intestinal toxaemia and overgrowth of anaerobic bacteria, although research on this method has been quite limited. A positive test may indicate hypochlorhydria, bacterial overgrowth in the small intestine,100 malabsorption of protein or a high protein diet.101
Breath testing
Breath testing is a useful method of distinguishing small intestine bacterial overgrowth from other digestive disorders. The hydrogen and methane breath test uses a challenge dose of lactulose or glucose after an overnight fast in order to identify bacterial overgrowth in the small intestine. If dysbiosis exists in the small intestine, the bacteria will ferment the challenge substance and produce increased methane and hydrogen in the breath. Testing for both hydrogen and methane is more sensitive than testing for hydrogen alone, as fasting breath hydrogen levels can be suppressed by methanogenic bacteria.102
Alternatively, a challenge dose of lactose may be used to identify lactose intolerance.
Saliva
Salivary testing to measure levels of hormones such as cortisol and the sex steroid hormones has many advantages, both scientific and practical, over serum testing. The non-protein bound or unbound fractions of these hormones are measured, as opposed to the total levels, which are quantitated in serum measures. As these steroid hormones are predominantly bound to specific protein carriers, it is the free hormones that are considered to best reflect a person’s hormonally related symptoms.103 On the other hand, saliva levels of DHEA, thyroxine and cortisone may be of little value due to changes in their concentrations dependent upon salivary flow rate, enzymatic production or degradation by the salivary glands themselves, as well as contamination by plasma exudates, respectively.104
Hair
Hair analysis is one of the most meaningful and representative methods to detect and monitor heavy metal toxicity105 or the ingestion of drugs, although its usefulness in identifying nutrient status remains controversial. Despite its many advantages such as its non-invasive manner, a number of pitfalls exist in using hair in nutritional assessment, including the wide variability in levels reported in healthy people; this may be due to methods of sampling and sample preparation, as well as alterations caused by shampoos, hair treatments and other forms of environmental contamination that may make mineral content inconsistent throughout the length of the hair strand.106 Furthermore, results of measuring metal concentrations in hair, even under ideal circumstances, may not correlate with those obtained in blood pathology.107
FACTORS AFFECTING NUTRITIONAL STATUS
Examples of these include omega-3 essential fatty acid status being affected by excessive omega-6 due to their competition for the enzyme delta-6-desaturase, or the antagonism between zinc and copper.30 A variety of genetic polymorphisms that may affect the absorption of a nutrient or its bioavailability on a number of different levels depending on the position of the amino acid replacement on the nucleotide base within the DNA strand also exist.108–110 A comprehensive examination of this issue is placed in Appendix 5.
TRADITIONAL OR EMERGING DIAGNOSTIC TECHNIQUES
Iridology
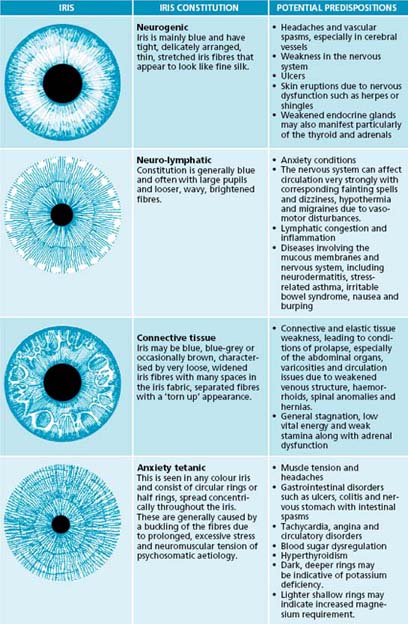
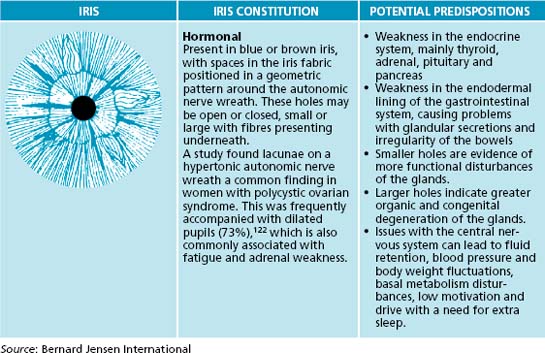
Iridology is the study and analysis of the neuro-optic reflex, which is thought to have the potential to reveal disharmonies in the body ranging from pathological, structural and functional to psychological and emotional. Its roots stem as far back as the advanced ancient cultures of the Egyptians, Chinese and Greeks, and in more recent times the development of the German and American schools of iridology has seen numerous scientists and doctors accumulating knowledge of this area through their own personal research. Iris analysis as a tool of diagnosis has been officially accepted in the former Soviet Union (1984), South Korea (1996–97) and Belarus (2002).111 It should be noted that much of the information discussed in this section has been derived from this empirical knowledge and currently lacks firm evidentiary support. While orthodox medical practice uses certain diagnostic signs of the iris (the arcus senilis or calcium ring), many other signs have not been adopted into conventional practice. A key point regarding the practice of iridology is that signs are considered to be reflective of a ‘constitutional health pattern’, rather than an indication of a specific disease, surgery or medications.
Iridology has the potential to reveal inherent strengths and weaknesses of organs, glands and tissues of the body, as well as the quality of assimilation of nutrients, inflammation and toxicity, circulatory and lymphatic congestion. It is not meant to nor does it reveal specific disease processes. Of the published evidence, negative studies exist for iridology to detect cancer,112 gall bladder disease113 and kidney disease,114 concluding that this practice was no better than chance at detecting these conditions. Positive studies do exist for broader constitutional correlations, for example hypertension, TNF alpha gene and iris constitution.115,116 As the skilled iridologist may be able to identify inherited or acquired health dispositions, as well as potential strengths and weaknesses within a system, the endpoint of final disease may not always manifest in these people and therefore the practitioner will be unable to place a definitive diagnosis. Here is the importance of using this science as an adjunct to the overall health assessment, giving possible clues to assist in piecing together the complex biological system of each patient.
A variety of positive articles have also been published, although many of these have been uncontrolled and unmasked investigations.117,118 Much of the literature on iridology is published in non-English (predominantly Portuguese and Russian) literature and is therefore either difficult to source or not included in many systematic reviews.119 A methodologically rigorous longitudinal study on the ability of both iridology and sclerology to detect or predict predisposed vulnerability to type 2 diabetes is currently being currently undertaken.120 However, in general the evidence base for iridology remains poor to date, and even by naturopathic standards current approaches to iridology remain a relatively recent diagnostic invention.
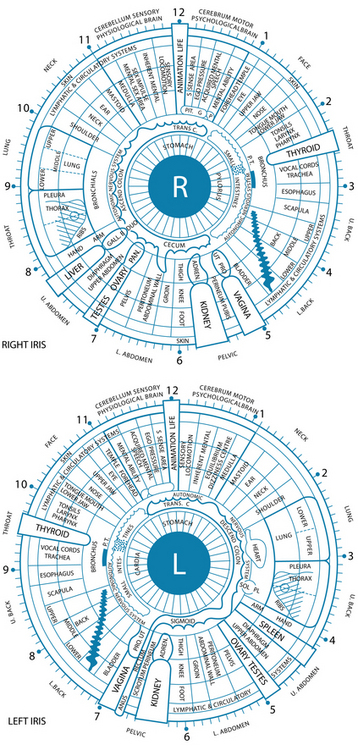
In an iris evaluation the most outstanding iris signs and impressions should first be documented. Overall integrity of the fibres will give an indication of the ability of a patient to resist negative influences to their health. Next, constitutional types and subtypes, overall pigmentation patterns, then specific structural and pigmentation signs according to appearance and location on the iris chart should be noted (see Table 2.4). The area from the pupil and extending out concentrically through the digestive and nervous zones to the outer circulatory zone should also be examined sequentially.
Source: Bernard Jensew International
The constitutional framework of German iridology is based on inherent iris signs that have been clinically researched and verified for pathology that may potentially occur if preventive measures are not taken (see Table 2.5). The iris may be categorised by basic colour, along with structures and colours: blue eyes being ‘lymphatic’, light brown ‘biliary’ and true brown eyes ‘haematogenic’. These categories have been further subdivided into subtypes according to structure and overlying colours. Overall pigmentation patterns and structural signs can also be observed in relation to their location on the iris chart. Classical American-style iridology also focuses on structure and colours in specific regions of the iris, related to the various organ reflex positions. Here the depth of the openings of iris tissue are assessed; the deeper the lesion, the more chronic and degenerative condition. This theory also incorporates the idea of concentric circle zones radiating from the pupil to the periphery, with the pupil reflecting the central nervous system and the areas surrounding indicating in sequence, the digestive zone, blood and primary lymph nodes, endocrine glands, skeletal and muscular systems, secondary lymphatic system, skin and the blood capillaries that feed it. A study has demonstrated that almost half of the 87 hypertensive subjects displayed connective tissue weakness in the cardiac and renal positions in the iris.121
| IRIS SIGN | REASON |
|---|---|
| Small pupil (miosis) | |
| Large pupil (mydriasis) |
• Sympathetic overactivity such as hyperthyroidism and anxiety,2 which can lead to adrenal insufficiency
|
| Pupil border and surrounding area | |
| Autonomic nerve wreath/collarette |
• Thick or raised—excessive energy in the gastrointestinal tract and may predispose to diarrhoea, colic and spasms
|
Source: Bernard Jensen International
Figure 2.4 outlines the American chart and has been reproduced with permission from Bernard Jensen International.
IRIDOLOGY AND PERSONALITY: ANY LINK?
Current evidence indicates the following:
Dark field microscopy
Dark field microscopy or live blood-cell examination is a method of screening patients for abnormal cell morphology and for the detection of uncharacteristic substances within blood. This type of assessment may be clinically useful for identifying bacterial forms, blood cell morphology and the effects of cell-mediated immune responses. However, as stated in a position statement by the Council on Diagnosis and Internal Disorders, ‘There is no direct correlation that can be ascertained with certainty regarding any defined nutritional component and the particular morphology that might be seen under the microscope’.126 This council does, however, believe live blood analysis to be a beneficial diagnostic laboratory technique when used as a method of screening patients for abnormal cell morphology and for the identification of abnormal biological contents in blood plasma.126
Humoral theory
Humoral medicine was the predominant type of medicine practised in England by orthodox naturopaths from the 1200s to 1800s.128 The theory was based on early Greek manuscripts, believed to be written by Hippocrates in the 5th century BC. The four humours doctrine states that the body consists of blood, phlegm, yellow and black bile. When the body is healthy, each is proportional in strength and quantity; however, if an imbalance has occurred, illness results.128 As this balance is different in every person, it is necessary to determine the patient’s normal humoral condition before an assessment can be made of the changes that caused the illness.129 Extensive case taking from patients included pulse, urine inspection and symptoms of humoral changes such as heightened colour, quickening of pulse, swollen veins or headaches indicative of excess blood. Excessive phlegm may manifest as catarrh, slow pulse, indigestion or poor appetite, too much yellow bile as jaundice, and surplus black bile as mental disturbances such as nightmares or depression. A variety of treatments may have been employed and include medicines, dietary measures, bloodletting, purging and counter-irritation.128
Naturopaths are advised to base diagnostic assessment on case taking and evidence-based techniques, but the humoral diagnostic technique may provide a supplementary approach to fine-tune analysis or the patient’s health state, and afford a richer understanding of the person beyond quantitative assessment. As revealed in Table 2.6 and Figure 2.5, the four humours describe energetic qualities that may be found in somatic or psychological presentations in people. Example of various conditions and tongue and pulse signs are:
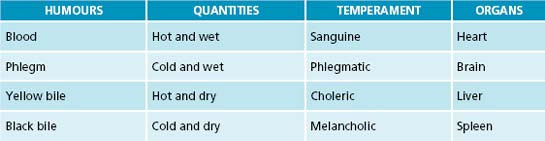
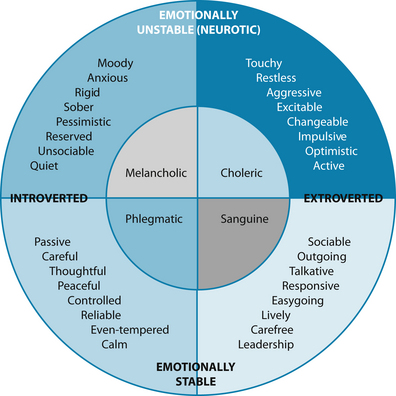
Figure 2.5 The four humours and their attributes
Source: Eysenck HJ, Eysenck MW. Personality and individual differences, plenum publishing 1958
The philosophy of treating a humoral presentation is to use its ‘energetic opposite’. For example to treat a classically melancholic condition such as osteoarthritis, the use of warming circulatory stimulants may be of assistance. Or in the case of a choleric condition such as psoriasis or dry eczema, the use of cooling moistening treatments may help. Below is a brief list of herbal energetic examples that may be used to treat the opposite humoral presentation:130
Adapted traditional Chinese medicine diagnostic techniques
Although traditional Chinese medicine diagnosis does not have a developed evidence base in terms of Western scientific method, it does have a history of development by empirical observation and testing spanning thousands of years. There is also evidence of concordance of diagnosis by different traditional Chinese medicine practitioners for a number of conditions.131
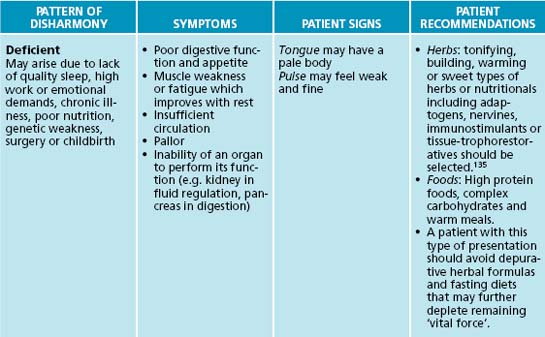
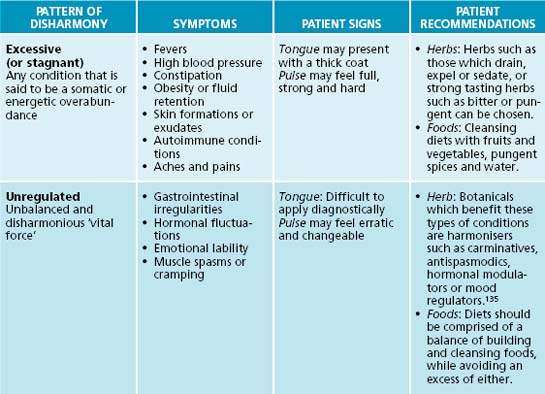
Traditional Chinese medicine is similar to humoralism in regard to its view of health and disease.132 The traditional Chinese medicine energetic model can be adapted for use in the naturopathic context, with the Western theory of ‘vital force’ being analogous with the traditional Chinese medicine theory of Qi. The concept of Qi is fundamental to Chinese medical thinking. Its five major functions are responsible for a person’s physical integrity and for any changes they may experience.133 Qi is said to be the source of all movement and harmonious transformation in the body; it protects and warms the body, as well as governs retention of the body’s substances and organs. There are three major patterns of disharmony associated with Qi: deficient or empty, excessive or stagnant, and unregulated or disharmonious.131 Qi and the principles of the six pernicious influences can add insight into a patient’s condition and assist with selection of the right prescription.
Traditional Chinese medicine has a unique diagnostic framework, which can be adapted for naturopathic practice. Conditions can be divided into three patterns of disharmony: deficient, excessive or unregulated. General signs and symptoms may provide diagnostic detail of which state the body/mind is in, and prescriptive recommendations. Table 2.7 details basic traditional Chinese medicine diagnostic patterns and clinical recommendations for application in naturopathic practice. It should be noted that this table is only theoretical (for further reference to traditional Chinese medicine diagnostic techniques, see Appendices 7, 8 and 9).
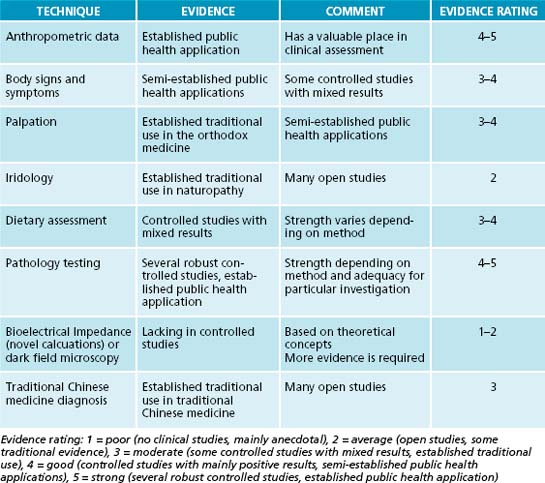
CHOOSING DIAGNOSTIC METHODS
When interpreted alone many have explicit shortcomings due to the lack of available evidence of efficacy. Each person’s needs should be evaluated and investigations adjusted accordingly, always keeping in mind what level of evidence is available, as well as the relative strengths and weaknesses of each (see Table 2.8).
CONSIDER COST
carried out. It is likely that patients have already had a test, if not a number of them, performed by their general practitioners and in these cases it is beneficial to seek the results.
Gibson R. Principles of nutritional assessment, 2nd edn. USA: Oxford University Press; 2005.
Olgilvie C., Evans C.C. Symptoms and signs in clinical medicine: an introduction to medical diagnostics, 12th edn. Oxford: Butterworth–Heinemann; 1997.
Heimburger D., et al. Clinical manifestations of nutrient deficiencies and toxicities: a resume. In: Heimburger D., Shils M., McLaren D., editors. Modern nutrition in health and disease. USA: Lippincott Williams & Wilkins, 2006.
Maciocia G. The foundations of Chinese medicine. New York: Churchill Livingstone; 1996.
1. Model D. Making sense of clinical examination of the adult patient. New York: Oxford University Press; 2006.
2. Olgilvie C., Evans C.C. Symptoms and signs in clinical medicine: an introduction to medical diagnostics, 12th edn. Oxford: Butterworth–Heinemann; 1997.
3. Welsby P.D. Clinical history taking and examination. New York: Churchill Livingstone; 1995.
4. Toghill P. First impressions. In: Toghill P.J., editor. Examining patients: an introduction to clinical medicine. London: Edward Arnold, 1995.
5. Welborn T., et al. Waist–hip ratio is the dominant risk factor predicting cardiovascular death in Australia. Med J Aust. 2003;179(11):580-585.
6. Shenkin A. Trace elements and inflammatory response: implications for nutritional support. Nutrition. 1995;11(1 Suppl):100-105.
7. Sauberlich H.E. Laboratory tests for the assessment of nutritional status, 2nd edn. USA: CRC Press; 1999.
8. Maehira F., et al. Selenium regulates transcription factor NF-[kappa]B activation during the acute phase reaction. Clin Chim Acta. 2003;334(1–2):163-171.
9. WHO. Clinical assessment of nutritional status. AJPH. 1973;63(Suppl):18-27.
10. Anderson G.J., Connor W.E. On the demonstration of omega-3 essential-fatty-acid deficiency in humans. Am J Clin Nutr. 1989;49(4):585-587.
11. Rude R.K. Magnesium deficiency: a cause of heterogenous disease in humans. J Bone Miner Res. 1998;13(4):749-758.
12. Allender P.S., et al. Dietary calcium and blood pressure: a meta-analysis of randomized clinical trials. Ann Intern Med. 1996;124(9):825-831.
13. Heimburger D., et al. Clinical manifestations of nutrient deficiencies and toxicities: a resume in. In: Modern Nutrition in Health and disease. USA: Lippincott Williams & Wilkins; 2006.
14. Shenkin A., et al. Vitamins and trace elements. In: Burtis C., et al, editors. Tietz textbook of clinical chemistry and molecular diagnostics. Missouri: Elsevier Saunders, 2006.
15. Olson J. Vitamin A. In: Ziegler E.E., Filer L.J.Jr., editors. Present knowledge in nutrition. Washington: ILSI Press; 1996:109-117.
16. Sommer A., Davidson F.R. Assessment and control of vitamin A deficiency: the Annecy accords. J Nutr. 2002;132(9):2845S-2850S.
17. Ryan A.S., Goldsmith L.A. Nutrition and the skin. Clin Dermatol. 1996;14(4):389-406.
18. Thurnham D.I. Red cell enzyme tests of vitamin status: do marginal deficiencies have any physiological significance? Proc Nutr Soc. 1981;40(2):155-163.
19. Holman R.T., et al. A case of human linolenic acid deficiency involving neurological abnormalities. Am J Clin Nutr. 1982;35(3):617-623.
20. Pencharz P.B. Making a nutritional assessment. Can Med Assoc J. 1982;127(9):823-835.
21. Sato S. Iron deficiency: structural and microchemical changes in hair, nails and skin. Semin Dermatol. 1991;10:313-319.
22. Shankar A.H., Prasad A.S. Zinc and immune function: the biological basis of altered resistance to infection. Am J Clin Nutr. 1998;68(2 Suppl):447S-463S.
23. Kubena K.S., Durlach J. Historical review of the effects of marginal intake of magnesium in chronic experimental magnesium deficiency. Magnes Res. 1990;3(3):219-226.
24. Jeejeebhoy K.N., et al. Chromium deficiency, glucose intolerance, and neuropathy reversed by chromium supplementation, in a patient receiving long-term total parenteral nutrition. Am J Clin Nutr. 1977;30(4):531-538.
25. Delange F. Physiopathology of iodine nutrition. In: Chandra R.K., editor. Trace elements in nutrition of children. New York: Raven Press; 1985:291-296.
26. Gibson R. Principles of nutritional assessment, 2nd edn. USA: Oxford University Press; 2005.
27. Hopper N. Zinc metalloproteases in health and disease. London: Taylor & Francis Ltd; 1996. 1–22
28. Smidt L., et al. Influence of thiamin supplementation on the health and general well-being of an elderly Irish population with marginal thiamin deficiency. J Gerontol. 1991;46:M16-M22.
29. Carlson G.L., et al. Biotin deficiency complicating long-term total parenteral nutrition in an adult patient. Clin Nutr. 1995;14(3):186-190.
30. Groff J., Gropper S. Advanced nutrition and human metabolism, 3rd edn. USA: Wadsworth/Thompson Learning; 2000.
31. Smith H. Diagnosis in paediatric haematology. New York: Churchill Livingstone; 1996. 6–40
32. Rayman M.P. The importance of selenium to human health. Lancet. 2000;356(9225):233-241.
33. Rushton D.H. Nutritional factors and hair loss. Clin Exp Dermatol. 2002;27(5):400-408.
34. Paulsrud J.R., et al. Essential fatty acid deficiency in infants induced by fat-free intravenous feeding. Am J Clin Nutr. 1972;25(9):897-904.
35. Mejia L. Vitamin A–nutrient interrelationships. In: Bauernfeind J., editor. Vitamin A deficiency and its control. Orlando: Academic Press, 1986.
36. Chandra R.K., Newberne P.M. Nutrition, immunity and infection. New York: Plenum Press; 1977. 37–86
37. Prasad A.S. Effects of zinc deficiency on immune functions. Journal of Trace Elements in Experimental Medicine. 2000;13(1):1-20.
38. Stabler S.P., et al. Clinical spectrum and diagnosis of cobalamin deficiency. Blood. 1990;76(5):871-881.
39. Wilfond B.S., et al. Severe hemolytic anemia associated with vitamin E deficiency in infants with cystic fibrosis: implications for neonatal screening. Clin Pediatr. 1994;33(1):2-7.
40. Johnson L., et alBoggs T.R.Jnr. The premature infant, vitamin E deficiency and retrolental fibroplasia. Am J Clin Nutr. 1974;27(10):1158-1173.
41. Mead J.F. The non-eicosanoid functions of the essential fatty acids. J Lipid Res. 1984;25(13):1517-1521.
42. Rivlin R. Riboflavin. In: Ziegler E.E., Filer L.J.Jr., editors. Present knowledge in nutrition. Washington: ILSI Press; 1996:167-173.
43. Leklem J. Vitamin B6. In: Ziegler E.E., Filer L.J.Jr., editors. Present knowledge in nutrition. Washington: ILSI Press; 1996:175-183.
44. Field E.A., et al. Oral signs and symptoms in patients with undiagnosed vitamin B12 deficiency. J Oral Pathol Med. 1995;24(10):468-470.
45. Leggott P.J. The effect of controlled ascorbic acid depletion and supplementation on periodontal health. J Periodontol. 1986;57:480-485.
46. Hambidge K. Clinical deficiencies: when to suspect there is a problem. In: Chandra R.K., editor. Trace elements in nutrition of children. New York: Raven Press, 1985.
47. Haddad J.G., Stamp T.C.B. Circulating 25-hydroxyvitamin D in man. Am J Med. 1974;57(1):57-62.
48. Welch T.R., et al. Vitamin D-deficient rickets: the reemergence of a once-conquered disease. J Pediatr. 2000;137(2):143-145.
49. Arnaud C. Calcium and phosphorus. In: Ziegler E.E., Filer L.J.Jr., editors. Present knowledge in nutrition. Washington: ILSI Press; 1996:245-255.
50. Cumming R.G. Calcium intake and bone mass: a quantitative review of the evidence. Calcif Tissue Int. 1990;47(4):194-201.
51. Daniel R., et al. Nails in systemic disease. Dermatol Clin. 1985;3(3):465-483.
52. Daniel R. Nail pigmentation abnormalities. Dermatol Clin. 1985;3(3):431-443.
53. Kechijian P. Brittle fingernails. Dermatol Clin. 1985;3(3):421-429.
54. Goodman K., Salt W. Vitamin B12 deficiency: important concepts in recognition. Postgrad Med. 1990;88:147-158.
55. Kalra V., et al. Vitamin E deficiency and associated neurological deficits in children with protein-energy malnutrition. J Trop Pediatr. 1998;44(5):291-295.
56. Healton E.B.M.D., et al. Neurologic aspects of cobalamin deficiency. Medicine. 1991;70(4):229-245.
57. Hetzel B.S. Iodine and neuropsychological development. J Nutr. 2000;130(2):489S-491S.
58. Mohanram M., Reddy V. Utilisation of radioactive iron in vitamin A deficient children. Proceedings of the International Congress of Nutrition,. 1981.
59. Maclean A.R., Renwick C. Audit of pre-operative starvation. Anaesthesia. 1993;48(2):164-166.
60. Whang R., et al. Magnesium homeostasis and clinical disorders of magnesium deficiency. Ann Pharmacother. 1994;28(2):220-226.
61. Baly D.L., et al. Studies of marginal zinc deprivation in rhesus monkeys. III. Effects on vitamin A metabolism. Am J Clin Nutr. 1984;40(2):199-207.
62. Britton J., et al. Dietary magnesium, lung function, wheezing, and airway hyper-reactivity in a random adult population sample. Lancet. 1994;344(8919):357-362.
63. Fleming C.R., et al. Essential fatty acid deficiency in adults receiving total parenteral nutrition. Am J Clin Nutr. 1976;29(9):976-983.
64. Jarvis C. Physical examination and health assessment. St Louis: Elsevier Saunders; 2007.
65. Mertz W. Metabolism and metabolic effects of trace elements. In: Chandra R.K., editor. Trace elements in nutrition of children. New York: Raven Press; 1985:107-117.
66. Salmenpera L. Detecting subclinical deficiency of essential trace elements in children with special reference to zinc and selenium. Clin Biochem. 1997;30(2):115-120.
67. Prelack K., Sheridan R.L. Micronutrient supplementation in the critically ill patient: strategies for clinical practice. J Trauma. 2001;51(3):601-620.
68. Chandra R.K., Sarchielli P. Immunocompetence methodology. In: Fidanza F., editor. Nutritional status assessment – a manual for population studies. London: Chapman & Hall; 1991:425-441.
69. Holmes S. Undernutrition in hospital patients. Nurs Stand. 2003;17(19):45-52. quiz 54–55
70. Golden M. Severe malnutrition. In: Weatherall D., et al, editors. Oxford textbook of medicine. 3rd edn. Oxford: Oxford University Press; 1995:1279-1280.
71. Golden M.H. Malnutrition. In: Guandalini S., editor. Textbook of pediatric gastroenterology and nutrition. London: Taylor & Francis; 2004:489-525.
72. Krall E.A., et al. Factors influencing accuracy of dietary recall. Nutr Res. 1988;8(7):829-841.
73. Nelson M. Methods and validity of dietary assessment. In: Garrow J.S., et al, editors. Human nutrition and dietetics. Edinburgh: Churchill Livingstone; 2000:311-331.
74. Food Standards Australia New Zealand, NUTTAB database. Online. Available: http://www.foodstandards.gov.au/monitoringandsurveillance/nuttab2006/.
75. Agricultural Research Service, USDA, USDA Nutrient database. Online. Available: http://www.nal.usda.gov/fnic/foodcomp/search/.
76. Health Canada, Canada. Online. Available: http://www.hc-sc.gc.ca/fn-an/nutrition/fiche-nutri-data/index-eng.php.
77. European Food Information Resource Network, EuroFIR, Food Composition Databases. Online. Available: http://www.eurofir.net/public.asp?id=8778 2009.
78. Royal College of Pathologists of Australasia, RCPA Manual. 2004. Online. Available: http://www.rcpamanual.edu.au/sections/pathologytestindex.asp?s=33
79. Pizzorno J., Murray M. Textbook of natural medicine. London: Churchill Livingstone; 1999.
80. Lukaski H.C., Penland J.G. Functional changes appropriate for determining mineral element requirements. J Nutr. 1996;126(9S):2354S.
81. Kushner I. The phenomenon of the acute phase response. Ann N Y Acad Sci. 1982:39-48.
82. Wieringa F.T., et al. Estimation of the effect of the acute phase response on indicators of micronutrient status in Indonesian infants. J Nutr. 2002;132(10):3061-3066.
83. Louw J.A.M.F., et al. Blood vitamin concentrations during the acute-phase response. Crit Care Med. 1992;20(7):934-941.
84. Tomkins A. Assessing micronutrient status in the presence of inflammation. J Nutr. 2003;133(5 Suppl 2):1649S-1655S.
85. Ruz M., et al. Development of a dietary model for the study of mild zinc deficiency in humans and evaluation of some biochemical and functional indices of zinc status. Am J Clin Nutr. 1991;53(5):1295-1303.
86. Hambidge M. Biomarkers of trace mineral intake and status. J Nutr. 2003;133(Suppl 3):948S-955S.
87. Fell G., Talwar D. Assessment of status [review article]. Curr Opin Clin Nutr Metab Care. 1998;1(6):491-497.
88. Bates C. Vitamin analysis. Ann Clin Biochem. 1997;34:599-626.
89. Rosales F.J., et al. Determination of a cut-off value for the molar ratio of retinol-binding protein to transthyretin (RBP: TTR) in Bangladeshi patients with low hepatic vitamin A stores. J Nutr. 2002;132(12):3687-3692.
90. Bates C., et al. Vitamin C. In: Fidanza F., editor. Nutritional status assessment – a manual for population studies. London: Chapman & Hall; 1991:309-319.
91. Maiani G., et al. Vitamin A. Int J Vitam Nutr Res. 1993;63(4):252-257.
92. Talwar D., et al. Effect of inflammation on measures of antioxidant status in patients with non-small cell lung cancer. Am J Clin Nutr. 1997;66(5):1283-1285.
93. Ganther H.E. Selenium and glutathione peroxidase in health and disease: a review. In: Prasad A.S., Oberleas D., editors. Trace elements in human health and disease. New York: Academic Press, 1976.
94. Spencer C.A., Wang C.C. Thyroglobulin measurement. Techniques, clinical benefits, and pitfalls. Endocrinol Metab Clin North Am. 1995;24(4):841-863.
95. Van Leeuwen A., et al. Davis’s comprehensive handbook of laboratory and diagnostic tests with nursing implications, 2nd edn. Philadelphia: FA Davis Company; 2006.
96. Skikne B.S., et al. Serum transferrin receptor: a quantitative measure of tissue iron deficiency. Blood. 1990;75(9):1870-1876.
97. Sweetman L. Qualitative and quantitative analysis of organic acids in physiologic fluids for diagnosis of the organic acidurias. In: Nyhan W., editor. Abnormalities in amino acid metabolism in clinical medicine. Norwalk: Appleton-Century-Crofts; 1984:419-453.
98. Newman M, et al. Urinary organic acid analysis: a powerful clinical tool, potentially muddled by poor testing methods. US BioTek Laboratories, 2004. Online. Available: http://www.usbiotek.com/Downloads/information/MarkOATLArticle-V6.pdf
99. Talley N.J., O’Connor S. Clinical examination: a systematic guide to physical diagnosis, 4th edn. Sydney: MacLennan & Petty; 2001.
100. Neale G., Tabaqchali S. The British society of gastroenterology. Gut. 1966;7(6):708-718.
101. Greenberger N., et al. Urine indican excretion in malabsorption disorders. Gastroenterology. 1968;55:204-211.
102. Hamilton L.H. Breath testing and gastroenterology. Menomonee Falls, Wisconsin: Quintron Division, The EF Brewer Company,. 1992.
103. Lac G. Saliva assays in clinical and research biology. Pathol Biol. 2001;49(8):660-667.
104. Vining R.F., McGinley R.A. The measurement of hormones in saliva: possibilities and pitfalls. J Steroid Biochem. 1987;27(1–3):81-94.
105. Jenkins DW. Toxic trace metals in mammalian hair and rails. US Environmental Protection Agency. Number 600/4-79-049, 1979.
106. Haddy T., et al. Minerals in hair, serum and urine of healthy and anemic black children. Public Health Rep. 1991;106(5):557-563.
107. Rivlin R.S. Misuse of hair analysis for nutritional assessment. Am J Med. 1983;75(3):489-493.
108. Zeisel S.H. Genetic polymorphisms in methyl-group metabolism and epigenetics: lessons from humans and mouse models. Brain Res. 2008;1237:5-11.
109. Yates Z., Lucock M. Interaction between common folate polymorphisms and B-vitamin nutritional status modulates homocysteine and risk for a thrombotic event. Mol Genet Metab. 2003;79(3):201-213.
110. Whitehead V.M. Acquired and inherited disorders of cobalamin and folate in children. Br J Haematol. 2006;134(2):125-136.
111. Andrews J. Endocrinology and iridology. Corona: John Andrews Iridology; 2006.
112. Munstedt K., et al. Can iridology detect susceptibility to cancer? A prospective case-controlled study. J Altern Complementary Med. 2005;11(3):515-519.
113. Knipschild P. Looking for gall bladder disease in the patient’s iris. Br Med J. 1988;297:1578-1581.
114. Simon A., et al. An evaluation of iridology. JAMA. 1979;242(13):1385-1389.
115. Yoo C., et al. Relationship between iris constitution analysis and TNF-alpha gene polymorphism in hypertensives. Am J Chin Med. 2007;35(4):621-629.
116. Cho J., et al. Angiotensinogen gene polymorphism predicts hypertension, and iridological constitutional classification enhances the risk for hypertension in Koreans. Int J Neurosci. 2008;118(5):635-645.
117. Pokanevych V. Iridology in Ukraine. Lik Sprava. 1998;3:152-156.
118. Zubareva T.V., Gadakchian K.A. The use of iridoscopy in prophylactic examinations. Oftalmologicheskii Zhumal. 1989;4:233-235.
119. Salles L., Silva M. [Iridology: a systematic review]. Rev Esc Enferm USP. 2008;42(3):596-600.
120. Personal communication, L. Mehlmauer.
121. Jae-Young U., et al. Novel approach of molecular genetic understanding of iridology: relationship between iris constitution and angiotensin converting enzyme gene polymorphism. Am J Chin Med. 2005;33(3):501-505.
122. Andrews J. Polycystic ovary syndrome research and iridology profiles. Advanced Iridology Research Journal. 2006;6:16-20.
123. Dailakis M. New research in Alzheimer’s disease and iridology. Advanced Iridology Research Journal. 2006;6:9-10.
124. Mir M.A. Atlas of clinical diagnosis, 2nd edn. London: Elsevier; 2003.
125. Larsson M., et al. Associations between iris characteristics and personality in adulthood. Biol Psychol. 2007;75:165-175.
126. American Chiropractic Association. The internist. In: Position statement of the Council on Diagnosis and Internal Disorders of the American Chiropractic Association, 1996.
127. Sun S.S., et al. Development of bioelectrical impedance analysis prediction equations for body composition with the use of a multicomponent model for use in epidemiologic surveys [see comment]. Am J Clin Nutr. 2003;77(2):331-340.
128. Jackson W.A. A short guide to humoral medicine. Trends Pharmacol Sci. 2001;22(9):487-489.
129. Earles M.P. Hall’s prescriptions. In: Lane J., editor. John Hall and his patients. Stratford-upon-Avon: The Shakespeare Birthplace Trust, 1996. xxxi–xl
130. Holmes P. The energetics of western herbs. Berkeley: NatTrop Publishing; 1993.
131. O’Brien K., Birch S. A review of the reliability of traditional East Asian medicine diagnoses. J Altern Complement Med. 2009;15(4):353-366.
132. Zhang D. Humoralism and its influence on western medicine. Zhonghua Yi Shi Za Zhi. 2001;31(3):141-147.
133. Chen B-L., editor. Classic of difficulties with explanation in vernacular language. Beijing: People’s Health Press, 1963.
134. Kaptchuk T.J. Chinese medicine: the web that has no weaver. London: Rider Books; 1983.
135. Ross J. Combining western herbs and Chinese medicine: principles, practice and materia medica. Seattle: Greenfields Press; 2006.
[/level-membership-for-internal-medicine-category][not-level-membership-for-internal-medicine-category]
Chapter 2 Naturopathic diagnostic techniques
INTRODUCTION
The diagnostic process should flow from an extensive case history and physical examination to a differential diagnosis that lists possible alternatives for the presentations within the patient. An awareness of different types of pathology that may lead to particular signs and symptoms will assist the naturopath to narrow down the list of possibilities and select the most likely hypothesis.1
Further investigations, including pertinent biochemical evaluations, should then be performed to point to a more definitive diagnosis. This diagnosis, along with any other health issues that may have presented during the investigation, should all be used to address a patient from a holistic perspective and develop an adequate management plan. Clinical methods of diagnosis are best used in combination, and when interpreted alone possess definite disadvantages. Physical signs in conjunction with dietary and biochemical methods may provide a clearer picture of the physiology or pathophysiology at play in each individual. This chapter provides an overview of a variety of physical examination techniques such as anthropometric data, body signs and symptoms, gastrointestinal palpation and iridology, as well as an outline of dietary assessment methods and biochemical evaluations via a variety of pathology testing methods. Some of these types of assays have robust scientific bases, while others that have not been so extensively studied have
been included as an overview of available techniques. The chapter then concludes with some useful traditional Chinese medicine analytical methods that have been adapted for naturopathic diagnostic purposes. A section on factors that affect nutritional status has also been included as a tool to assist with identifying potential confounding variables that should also be taken into consideration.
EVIDENCE-BASED CLINICAL DIAGNOSTIC TECHNIQUES
Physical examination
Naturopathic physical examination should be systematic and precisely recorded, while relating particular signs to standardised definitions. Assessment of a patient begins as soon as the consultation starts. A person’s disposition, facial complexion and expression, body size and shape, mobility, gait and posture, as well as the way they conduct or hold themselves, may provide important clues in relation to their mental and physical states.1 A general inspection of the whole body may reveal external evidence of a disease, for example obesity, wasting, arthritis, abnormal stature or development, presence of pain, jaundice, pallor or cyanosis.2
Warm, sweaty palms on the initial handshake may indicate an overactive thyroid due to increased circulation with blood vessel dilation. In contrast, an underactive thyroid may cause the hands to be cool and dry in texture.3 Persons with alcohol dependence may attempt to conceal their addiction; however, certain signs may provide indicators such as plethoric faces, rhinophymic noses and alcoholic aroma. Smokers may also be revealed by their scent or nicotine-stained fingers. A person’s facial expression may portray psychiatric illness such as depression, while conversation may alert to an anxiety disorder. In developing countries, malnutrition with subsequent wasting and loss of weight is a relatively common occurrence; however, when these signs appear in more developed populations, naturopaths should be alerted to potential underlying pathological conditions such as diabetes, thyrotoxicosis, malabsorption syndromes or chronic infections.4
Anthropometric data
Height and weight should be determined to assess if a person is over- or underweight. Waist to hip ratio (WHR) is the most useful predictor of cardiovascular disease mortality while body mass index (BMI = weight (kg)/height (m2)) may be a better predictor of increased mortality from raised blood pressure (see Table 2.1).5
Table 2.1 Data that predict increased mortality from cardiovascular disease and raised blood pressure5
| FEMALES | MALES |
|---|---|
| WHR > 0.8 | WHR > 0.9 |
| Waist circumference of > 88 | Waist circumference of > 102 |
| BMI > 25 | BMI > 30 |
Some form of body composition analysis, whether via skin fold or BIA, should also be performed to determine lean mass or protein sufficiency. Protein insufficiency may have widespread ramifications. Hypoproteinaemia can cause deviations in circulating levels of certain micronutrients, such as iron,6 zinc, copper7 and potentially selenium.8
Body signs and symptoms
Physical signs may be important aids in identifying nutritional dysfunction, though care should also be taken during case taking as particular signs may not be specific and may relate to non-biological factors (such as injury or excessive sun exposure). Signs may also differ between populations and may also vary over time periods within a population.9 Any findings suggesting an abnormality should be considered a clue rather than a diagnosis. Table 2.2 outlines a variety of signs and symptoms as documented in research literature.
| SYSTEM | SIGN | POSSIBLE NUTRIENT DEFICIENCIES |
|---|---|---|
| Biliary | Fatty liver deposits | Omega-6 EFA10 |
| Cardiovascular |
Bioelectrical impedance analysis
Bioelectrical impedance analysis measures the impedance or opposition to the flow of an electric current (usually 50 kHz) through the body fluids contained mainly in the lean and fat tissue. This is generally low in lean tissue, where intracellular fluid and electrolytes are primarily contained, but high in fat tissue. In practice, a small constant current is passed between electrodes spanning the body and the voltage drop between electrodes provides a measure of impedance. The resulting impedance reading is proportional to the total body water volume. Prediction equations are used to convert impedance to a corresponding estimate of total body water.127 Lean body mass is then calculated from this estimate using an assumed hydration fraction for lean tissue. Fat mass may then be calculated by subtracting lean mass from total body weight. Although commonly accepted as a measure of these markers many naturopathic practitioners adopt novel conclusions from this technique that are yet to build an evidentiary base.
Gastrointestinal palpation
Palpitation of the abdominal area may reveal various underlying organ pathologies such as liver disease or gall bladder insufficiencies (see Figure 2.1a):
Figure 2.1 (a) Normally palpable abdominal structures (b) Palpating the liver
Source: Adapted from Jarvis 200764
Palpation may also locate a mass. If so, it must be distinguished from a normally palpable structure or enlarged organ and note must be taken of its location, size, shape, tenderness, consistency, surface, mobility, pulsatility and tenderness. Gastrointestinal palpation may also be used in conjunction with other abdominal physical examinations, such as auscultation and percussion, to elicit required information. An example of this is that a fluid wave indicates ascites, which may occur with heart failure, portal hypertension, cirrhosis of the liver, hepatitis, pancreatitis and cancer.64
[/not-level-membership-for-internal-medicine-category]
