Chapter 89 Natural and Human-Made Hazards
Disaster Risk Management Issues
For online-only figures, please go to www.expertconsult.com 
Disaster Risk Reduction and Management
Selection of management options depends on the type of hazard and its characteristics. Box 89-1 lists the elements usually found in a disaster preparedness plan for sudden-onset hazards, such as earthquakes, tsunamis, volcanic eruptions, tropical cyclones, and floods. Preparedness measures for slow-onset disasters, such as drought, include early warning systems that alert authorities to precursory conditions and allow preparations to avert food and water shortages.
BOX 89-1 Essentials of a Preparedness Plan for Rapid Onset Disasters
Disaster Mitigation Strategies
Earthquakes
Causal Phenomena
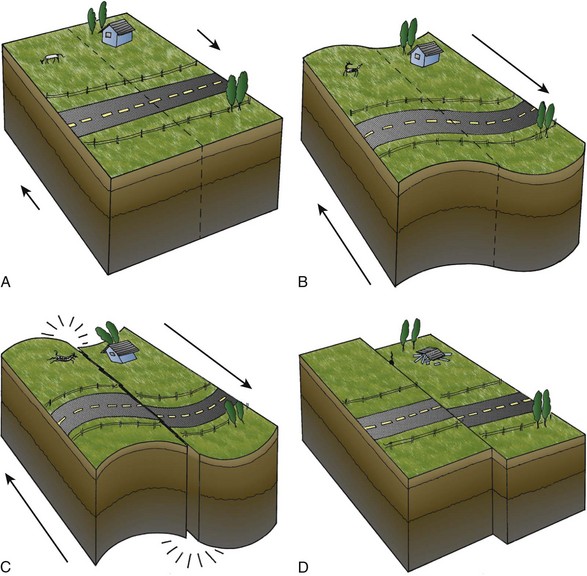
Faults are areas of stress at plate boundaries that release accumulated energy by slipping or rupturing. Elastic rebound occurs when the maximum point of supportable strain is reached and a rupture occurs, allowing the rock to rebound until the strain is relieved (Figure 89-1). Usually, the rock rebounds on both sides of the fault in opposite directions. The point of rupture is called the focus and may be located near the surface or deep below it. The point on the surface directly above the focus is termed the epicenter (Figure 89-2).

Characteristics
There are three types of seismic waves. The body waves (P, or primary, and S, or secondary) penetrate the body of the earth, vibrating quickly (Figure 89-3). P waves travel at about 6 km per second (kps) (3.7 miles per second [mps]) and provide the initial jolt that causes buildings to vibrate up and down. S waves travel about 4 kps (2.5 mps) in a movement similar to the snap of a whip, causing a sharper jolt that vibrates structures from side to side and usually resulting in the most destruction. Surface waves (L waves) vibrate the ground horizontally and vertically and cause swaying of tall buildings, even at great distances from the epicenter.

Earthquake Scales
The earthquake intensity scale measures the effects of an earthquake where it occurs. The most widely used scale of this type is the modified Mercalli scale, which expresses the intensity of earthquake effects on people, structures, and the earth’s surface in values from I to XII (Table 89-1). Another, more explicit, scale used in Europe is the Medvedev-Sponheuer-Karnik (MSK) scale.
| Scale | Description |
|---|---|
| I | Not felt except by very few persons under especially favorable circumstances. |
| II | Felt only by a few persons at rest, especially on upper floors of buildings. Delicately suspended objects may swing. |
| III | Felt quite noticeably indoors, especially on upper floors of buildings, but many people do not recognize it as an earthquake. Standing motor vehicles may rock slightly. Vibration similar to passing of truck. Duration estimated. |
| IV | During the day felt indoors by many but outdoors by few. At night some awakened. Dishes, windows, doors disturbed; walls make creaking sound. Sensation resembles heavy truck striking building. Standing motor vehicles rocked noticeably. |
| V | Felt by nearly everyone; many awakened. Some dishes, windows, etc., broken. A few instances of cracked plaster. Unstable objects overturned. Disturbances of trees, poles, and other tall objects sometimes noticed. Pendulum clocks may stop. |
| VI | Felt by all; many frightened and run outdoors. Some heavy furniture moved; a few instances of fallen plaster or damaged chimneys. Damage slight. |
| VII | Everybody runs outdoors. Damage negligible in buildings of good design and construction, slight to moderate in well-built ordinary structures, considerable in poorly built or badly designed structures. Some chimneys broken. Noticed by persons driving motor vehicles. |
| VIII | Damage slight in specially designed structures, considerable in ordinary substantial buildings with partial collapse, great in poorly built structures. Panel walls thrown out of frame structures. Fall of chimneys, factory stacks, columns, monuments, and walls. Heavy furniture overturned. Sand and mud ejected in small amounts. Changes in well water. Persons driving motor vehicles disturbed. |
| IX | Damage considerable in specially designed structures. Well-designed structures thrown out of plumb, greatly in substantial buildings with partial collapse. Buildings shifted off foundations. Ground cracked conspicuously. Underground pipes broken. |
| X | Some well-built wooden structures destroyed. Most masonry and frame structures with foundations destroyed; ground severely cracked. Rails bent. Landslides considerable from river banks and steep slopes. Shifted sand and mud. Water splashed (slopped) over banks. |
| XI | Few, if any, (masonry) structures remain standing. Bridges destroyed. Broad fissures in ground. Underground pipelines completely out of service. Earth slumps and land slips in soft ground. Rails bent greatly. |
| XII | Damage total. Practically all works of construction are damaged greatly or destroyed. Waves seen on ground surface. Lines of sight and level are distorted. Objects are thrown upward into the air. |
Location and Predictability
Earthquake Hazards
Typical Adverse Effects
The January 2010 Haiti earthquake affected an estimated 3 million people. It killed approximately 100,000 persons and injured approximately 300,000, although estimates of casualties widely vary. More than 1 million Haitians were left homeless. Vital infrastructure necessary to respond to the disaster, including air, sea, and land transport facilities and communication systems, was severely damaged or destroyed. Treatment of the injured was hampered by the lack of hospitals and morgue facilities; bodies were left to decay on the streets for many days. International assistance was offered in abundance, but the logistical capabilities in Haiti to receive emergency aid were limited. Doubtless, more lives were lost as a result of this vulnerability (Figures 89-4 and 89-5, online).

Earthquake Risk Reduction Measures
Tsunamis
Causal Phenomena and Characteristics
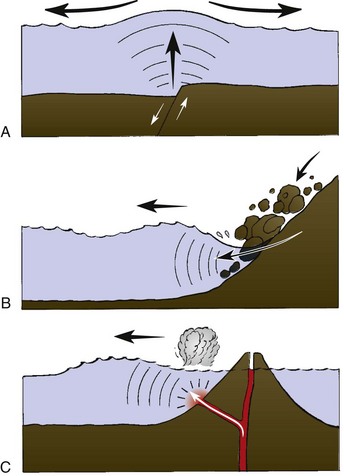
The geologic movements that cause a tsunami are produced in three major ways (Figure 89-7). The foremost cause is fault movement on the sea floor, accompanied by an earthquake. The second most common cause is a landslide occurring underwater or originating above the sea and then plunging into the water. The highest tsunamis ever reported were produced by a landslide at Lituya Bay, Alaska, in 1958. A massive rock slide produced a wave that reached a high water mark of 530 m (1740 feet) above the shoreline. A third cause of a tsunami is volcanic activity, which may uplift the flank of the volcano or cause an explosion.
Vulnerability
The following major factors contribute to vulnerability to tsunamis:
Typical Adverse Effects
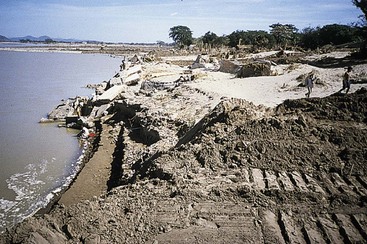
The force of water in a bore, with pressures up to 10,000kg/m2, can raze everything in its path. The flooding from a tsunami, however, affects human settlements most, by water damage to homes, businesses, roads, and infrastructure. Withdrawal of the tsunami also causes significant damage. As the water is dragged back toward the sea, bottom sediments are scoured out, collapsing piers and port facilities and sweeping out foundations of buildings. Entire beaches have disappeared, and houses have been carried out to sea. Water levels and currents may change unpredictably, and boats of all sizes may be swamped, sunk, or battered (Figures 89-8 to 89-10; Figures 89-8 and 89-10, online).
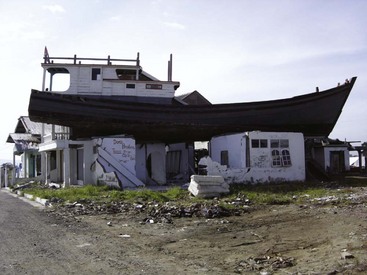
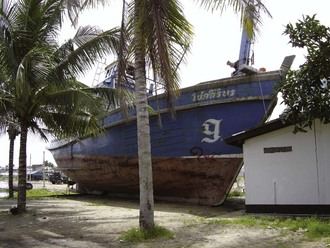
FIGURE 89-8 Ship washed ashore in tsunami, December 2004, in Koh Lanta, Thailand.
(Courtesy Sheila B. Reed.)
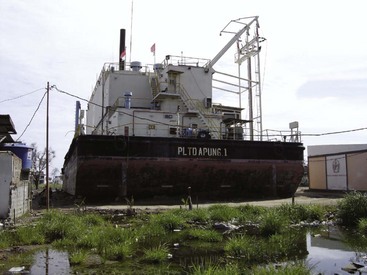
FIGURE 89-10 Generator ship washed ashore 2.3 miles inland, near Banda Aceh, Indonesia.
(Courtesy Sheila B. Reed.)
Casualties and Public Health
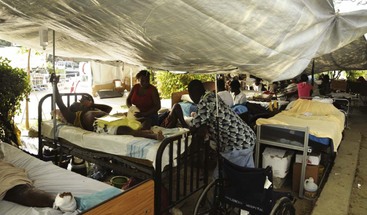
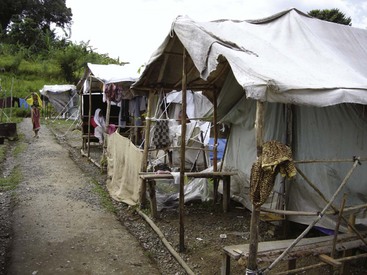
Deaths occur principally from drowning as water inundates homes or neighborhoods. Many people may be washed out to sea or crushed by the giant waves. Injuries occur from battering by debris. Little evidence exists of tsunami flooding directly causing large-scale health problems. Rapid effective assistance to the Banda Aceh (Indonesia) area in early 2005 prevented widespread outbreaks of disease in displacement camps (Figure 89-11). Malaria mosquitoes may increase because of water trapped in pools. Open wells and other groundwater may be contaminated by salt water and debris or sewage. Normal water supplies may be inaccessible for days because of broken water mains.
Volcanic Eruptions
A volcano is a vent or chimney to the earth’s surface from a reservoir of molten rock, called magma, deep in the earth’s crust (see Chapter 15). Approximately 500 volcanoes are active (have erupted in recorded history), and many thousands are dormant (could become active again) or extinct (are not expected to erupt again). On average, about 50 volcanoes erupt every year; only about 150 are routinely monitored. Since 1000 AD, more than 300,000 people have been killed directly or indirectly by volcanic eruptions, and currently about 10% of the world’s population lives on or near potentially dangerous volcanoes.
Types
Volcanic eruptions may be described as follows in descending order of intensity (Figure 89-12).
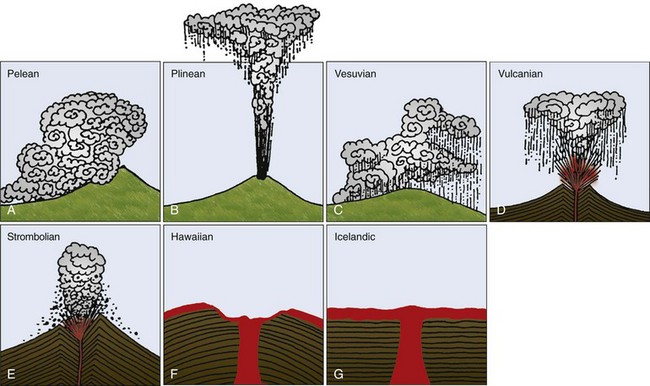
FIGURE 89-12 Eruption types. A, Pelean. B, Plinean. C, Vesuvian. D, Vulcanian. E, Strombolian. F, Hawaiian. G, Icelandic.
(Modified from United Nations Development Program: Introduction to hazards, ed 3, Disaster Management Training Programme, UN Organization for Coordination of Humanitarian Assistance, New York, 1997.)
Characteristics
Landslides
Causal Phenomena
Downslope stress may be caused by the following:
Characteristics
Landslides usually occur as secondary effects of heavy storms, earthquakes, and volcanic eruptions. The materials that compose landslides are divided into two classes: bedrock and soil (Earth and organic matter debris). A landslide may be classified by its type of movement (Figure 89-13).
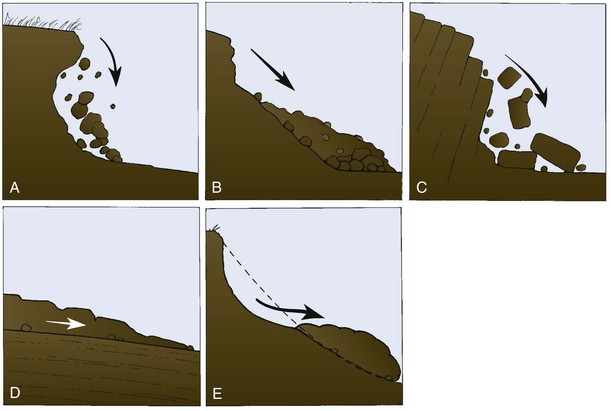
FIGURE 89-13 Landslides classified by type of movement. A, Fall. B, Slide. C, Topple. D, Lateral spread. E, Flow.
Predictability
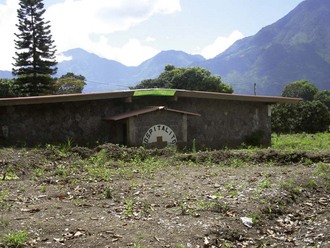
The source, movement, amount of water, and water pressure must be studied. Climatic patterns combined with soil type may cause different types of landslides. For example, when monsoons occur in tropical regions, large debris slides of soils, rocks, and organic matter may occur. Plant cover on slopes may have either a positive or negative stabilizing effect. Roots may decrease water runoff and increase soil cohesion; conversely, they may widen fractures in rock surfaces and promote infiltration. In Nepal in 2002, a heavy monsoon season caused flooding and landslides, killing 500 people. The vulnerability to landslides was increased by the proximity of most communities to slopes and the poor quality of housing. A tragic slide in Santiago Atitlán, Guatemala, which partially buried its hospital and killed hundreds of people, on October 5, 2005 (Figure 89-14) was caused by torrential rains from Hurricane Stan combined with vulnerability of the location on the slopes of a volcano. If climate change predictions are accurate, landslides may be expected to increase in number. Along with more intense and extreme rainfall, the growth in population in many developing countries may increase landslide-related casualties.
Tropical Cyclones
Causal Phenomena
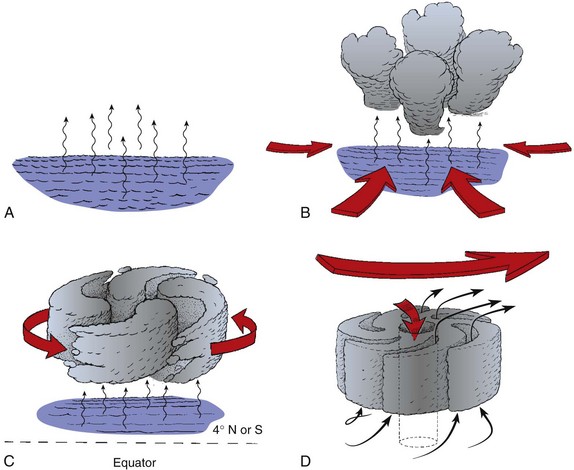
Formation and Initial Development Stage
Four atmospheric and oceanic conditions are necessary for development of a cyclonic storm (Figure 89-15):
Characteristics
Destructive Winds
The Beaufort scale is used to classify the intensity of the storms. It estimates the wind velocity by observations of the effects of winds on the ocean surface and familiar objects. Both the United States (Saffir-Simpson Hurricane Scale; Box 89-2) and Australia (Cyclone Severity Categories) use country-specific scales that estimate potential property damage in five categories. The Philippines recently increased its typhoon warning signal numbers from three ranges of wind speeds to four in order to take into account the lower standards of building structures and regional variations.
BOX 89-2
Saffir-Simpson Potential Hurricane Damage Scale
From The National Oceanic and Atmospheric Administration—National Weather Service, National Hurricane Center, Tropical Prediction Center, Miami, Fla, 2006. http://www.nhc.noaa.gov/aboutsshs.shtml.
Deadly Hurricane Seasons
The 1998 Atlantic hurricane season, from June 1 to November 30, was one of the deadliest in 200 years, killing more than 10,000 people in eight countries and causing billions of dollars in damage. Fourteen named storms, four more than average, formed in the Atlantic Ocean, Caribbean Sea, and the Gulf of Mexico. Of these, ten became hurricanes. Hurricane Georges followed a path across the U.S. Virgin Islands, Puerto Rico, the Dominican Republic, Haiti, and Cuba, killing more than 500 persons and causing $5 billion in damages. Hurricane Mitch moved across Central America, killing an estimated 10,000 persons in Honduras and wiping out the country’s infrastructure (Figure 89-16, online). Mitch regenerated as a tropical storm and then passed over south Florida.
Predictability
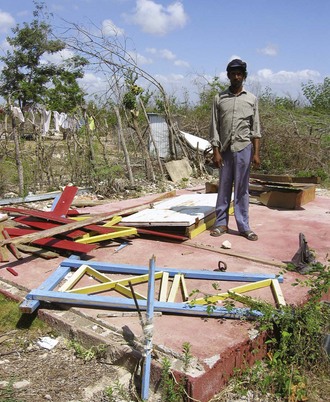
Special warning and preparedness strategies for evacuation from offshore facilities or closure of industrial plants must relate the costs and benefits of those strategies against the uncertainties of precision in the forecasts. For general community purposes that require a minimum 12 hours of preparedness time, the imprecision in forecasting the location of landfall within 24 hours should be generally tolerable, bearing in mind that highly adverse cyclonic weather usually commences about 6 hours before landfall of the cyclone. In the United States, a hurricane watch is issued when a hurricane is likely to strike within 36 hours, and a hurricane warning notifies of possible landfall within 24 hours. In September 2004, a Category 4 hurricane, Ivan, caused heavy damage to Jamaica, Grand Cayman, and the western tip of Cuba, and directly hit the Caribbean island of Grenada, home to 90,000 people. The island had not experienced a major hurricane in 40 years. Citizens received warnings in advance but generally did not have adequate preparedness measures in place. Remarkably few (39) died, but 90% of housing was damaged or destroyed (Figures 89-17 and 89-18; Figure 89-17, online).
Vulnerability
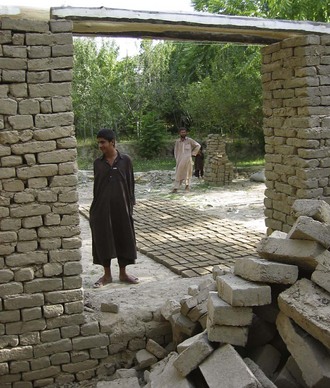
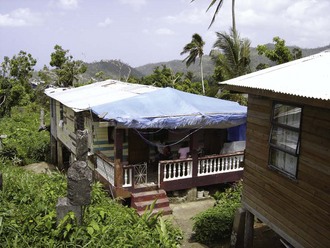
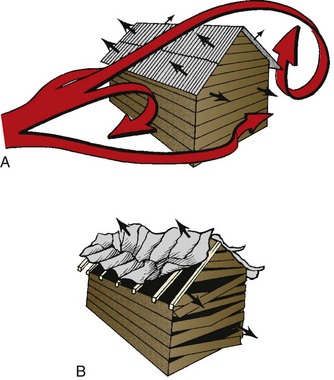
The quality of structures determines resistance to the effects of the cyclone. Those most vulnerable are lightweight structures with wood frames, older buildings with weakened walls, and houses made of unreinforced concrete block (Figure 89-19). Infrastructural elements particularly at risk are telephone and telegraph poles, fishing boats, and other maritime industries. Hospitals may be damaged, reducing access to health care and essential drugs.
Typical Adverse Effects
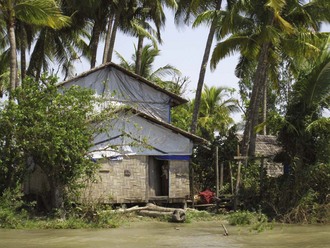
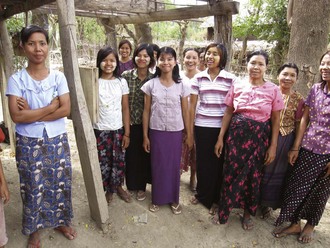
Preparedness Measures Take Root after Cyclone Nargis in Burma
Recovery efforts in the 2 years following Cyclone Nargis helped to restore a large percentage of agricultural productivity in Burma, although rebuilding of houses (Figure 89-20, online) and infrastructure was notably slower due to insufficient resources to implement the national recovery plan. Extensive environmental damage from the cyclone was also weakly addressed. However, disaster risk reduction (DRR) measures were augmented by communities with the support of the government and assistance organizations. Many communities formed disaster management committees, promoted raising awareness, and developed evacuation plans for families and livestock (Figure 89-21, online). Committees and programs were established to replant mangroves and tree plantation barriers. Steps are being taken to strengthen hazard risk mapping, early warning systems, and scientific research to underpin national DRR policy.
Tornadoes
Floods
Types
River
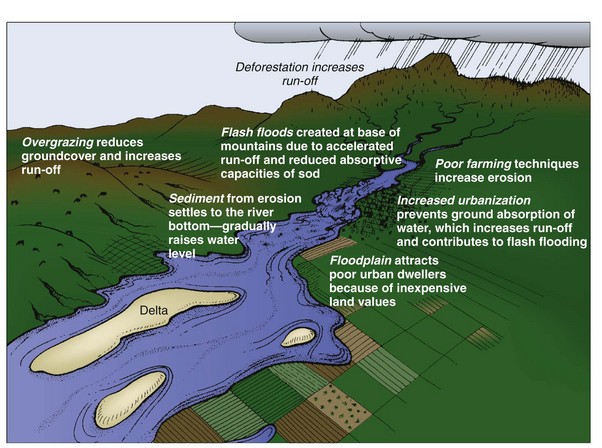
River floods are usually caused by precipitation over large catchment areas, by melting of the winter accumulation of snow, or sometimes by both. The floods take place in river systems with tributaries that may drain large geographic areas and encompass many independent river basins. In contrast to flash floods, river floods normally build up slowly, are often seasonal, and may continue for days or weeks. Factors governing the amount of flooding include ground conditions (the amount of moisture in the soil, vegetation cover, depth of snow, cover by impervious urban surfaces such as concrete), and size of the catchment basin (Figure 89-22).
Drought
Causal Phenomena
Human causes of drought, which include land use practices that give rise to desertification, such as deforestation, overcultivation, overgrazing, and mismanagement of irrigation, are thought to result in greater persistence of drought. Traditional drought-coping systems in Africa, such as pastoralists’ use of seasonal grazing lands and farmers’ use of fallow periods, have been reduced because of population pressures and economic policies (see Desertification, later).
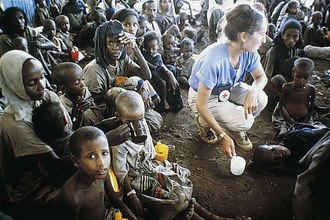
Droughts vary in terms of intensity, duration, and coverage. Droughts tend to be more severe in drier areas of the world because of low mean annual rainfall and longer duration of dry periods. In dry areas, drought builds up slowly over several years of poor rainfall. Dry conditions in the African Sahel over a 16-year period led to widespread famine in 1984 to 1985. The quarter-century of drought conditions in the Sahel was interrupted by heavy rains in 1994. The effect of drought on food security depends, among other factors, on the size of the area affected by drought, as well as the overall size of the country. Larger countries, such as India and Brazil, are rarely completely affected by drought, but smaller countries may be totally affected (Figure 89-23). Worldwide food availability may be adversely affected by drought in grain-exporting nations.
Winter Storms
Causal Phenomena
Environmental Pollution
Ozone Depletion
Ozone is a form of oxygen composed of three atoms of oxygen. Most atmospheric ozone is concentrated in the upper atmosphere, or stratosphere. The ozone layer is 13 to 40 km (8 to 25 miles) above the earth. Ozone screens out harmful wavelengths of ultraviolet radiation (UV-B) that originate from the sun, protecting life on Earth (see Chapter 14). Ultraviolet light is associated with increased nonmelanoma skin cancer, ocular cataracts, and deterioration of the retina and cornea. In addition, oceanic phytoplankton are reduced, with damage to fish larvae and young fish. Because fish provide 14% of the animal protein consumed worldwide (60% of that in Japan), the impact could be significant. A hole in the ozone layer has been detected over Antarctica. This hole appears seasonally and is roughly the size of the United States. Thinning of the ozone layer is caused by chlorofluorocarbons (CFCs), chemicals used in refrigeration, foam products, and aerosol propellants. The CFCs that damage the ozone layer may also contribute to global warming. Although they compose a fraction of greenhouse gases, they account for 20% of the warming trend caused by radioactive trapping potential (10,000 times greater than that of CO2).
Characteristics and Typical Adverse Effects
Air Pollution
Marine Pollution
Freshwater Pollution
Freshwater pollution results in the following adverse effects:
Global Warming
Rise in Sea Level
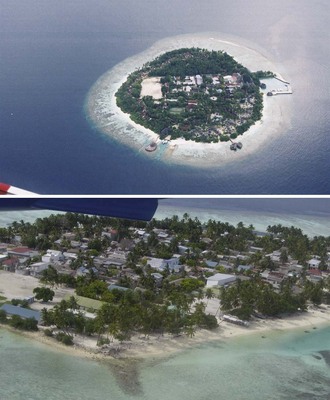
Melting of the Arctic ice sheets and alpine glaciers could cause the seas to expand and sea levels to rise. Depending on the degree of global warming, the seas may rise 30 cm to 2 m (12 inches to 7 feet) by 2075, jeopardizing coastal settlements and marine ecosystems. A rise of 1 m (3.28 feet) in sea level could flood 15% of arable land in Egypt’s Nile Delta and would flood 12% of Bangladesh, displacing 11 million people. The tiny island of the Maldives, inhabited by 200,000, would be submerged (Figure 89-24).
Risk Reduction Measures
Climate Change and Global Warming
Deforestation
Characteristics
Deforestation poses the most immediate danger by its contribution to the following hazards:
Predictability
Desertification
Causal Phenomena
Role of Climate
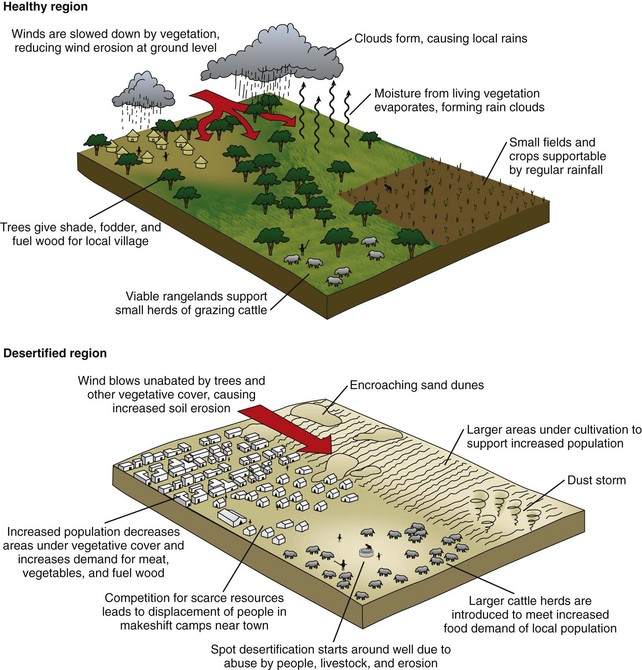
Despite the common misperception that desertification is caused by the desert advancing itself, land degradation can occur at great distances from deserts. Desertification usually begins as a spot on the land where land abuse has been excessive; from that spot, land degradation can spread outward with continued abuse (Figure 89-25). Desertification does not cause drought but may result in greater persistence of or susceptibility to drought. Drought, on the other hand, contributes to desertification and increases the rate of degradation. When the rains return, however, well-managed lands recover from droughts with minimal adverse effects. Land abuse during periods of good rains and its continuation during periods of deficient rainfall contribute to desertification.
Characteristics
1 Borgati L, Mauro S. Landslides and climatic change. In: Alcantara-Ayala I, Goudie A, editors. Geomorphological hazards and disaster prevention. Cambridge University Press; 2010:87-95.
2 Bryant E. Natural hazards. Cambridge: Cambridge University Press; 2005.
3 Dregne HM. Desertification assessment and control. Texas Tech University: International Center for Semi-Arid Land Studies; 1996.
4 Drought—Living with Risk: An Integrated Approach to reducing Societal Vulnerability to Drought, International Strategy for Disaster Reduction (ISDR) Ad Hoc Discussion Group on Drought, 2003.
5 Dudley WC, Lee M. Tsunami,, ed 2. Honolulu: University of Hawaii Press; 1998.
6 Erikson J. Quakes, eruptions and other geologic cataclysms. revised ed. Facts on File, New York, 2001..
7 Food and Agriculture Organization of the United Nations. The State of the world’s forests. Rome: Food and Agriculture Organization; 2005 and 2009.
8 Grainger A. The threatening desert: controlling desertification. London: Earthscan; 1990.
9 Hanley ML. Can the Black Sea be saved? World Dev. 1990;3:6.
10 Schwab JamesC, editor. Hazard mitigation: Integrating best practices into planning. American Planning Association, 2010.
11 Keller EA, Blodgett R. Natural hazards, Earth’s processed as hazards, disasters and catastrophes, ed 2. Pearson Prentice Hall; 2008.
12 Kovach R, McQuire B. Guide to global hazards. Richmond Hill. Ontario: Firefly Books; 2004.
13 Living with Risk: A Global Review of Disaster Reduction Initiatives. New York: United Nations Inter-Agency Secretariat of the International Strategy for Disaster Reduction (ISDR), 2004.
14 Petley D. Landslide hazards. In: Alcantara-Ayala I, Goudie A, editors. Geomorphological hazards and disaster prevention. Cambridge University Press, 2010.
15 Perritano JV. The truth about environmental hazards. DJW Books; 2010.
16 Smith K. Environmental hazards: Assessing risk and reducing disaster, ed 4. London: Routledge; 2004.
17 Tilling RI. Volcanic hazards. In: Marti J, Ernst GJ, editors. Volcanoes and environment. Cambridge University Press, 2005.
18 Twigg J. Disaster risk reduction: Mitigation and preparedness in development and emergency programming. Good Practice. Rev 9, 2004.
19 United States Agency for International Development. Disaster reduction: A practitioner’s guide. Washington, DC: United States Agency for International Development, Bureau for Democracy, Conflict and Humanitarian Assistance; 2002.
20 Vickers DO. Tropical cyclones. Nature Resources. 1991;27:31.
21 Wikipedia: Deepwater Horizons Oil Spill, Droughts, Tornadoes http://www.en.wikipedia.org
22 Wilhite DA, editor. Drought: A global assessment, vols 1 and 2. London: Routledge, 2000.
23 World Meteorological Organization, Integrated Flood Management, 2004.
Federal Emergency Management Agency, http://www.fema.gov.
Global Information and Early Warning System on Food and Agriculture, GIEWS@fao.org.
Hazlit Data Base, University of Colorado, http://www.colorado.edu/hazard/litbase.
International Tsunami Information Center, itic@itic.noaa.gov.
National Earthquake Information Center, quake@gldfs.urgs.gov.
National Oceanic and Atmospheric Association, http://www.noaa.gov.
United Nations Convention to Combat Desertification, http://www.unccd.int.
United Nations Environmental Program, http://www.unep.ch.
United Nations Economic and Social Commission for Asia, http://www.unescap.org.
United States Geological Services, http://www.usgs.gov.
United Nations Office for Coordination of Humanitarian Affairs, Relief Web, http://www.reliefweb.int.
Wikipedia, the Free Encyclopedia, http://www.en.wikipedia.org.