[level-membership-for-internal-medicine-category]
Chapter 17 Myocardial Perfusion
Magnetic Resonance Imaging
INTRODUCTION
The presence of a hemodynamically significant coronary stenosis can be detected by studying its influence on the downstream microcirculation. As the stenosis worsens, myocardial perfusion is preserved via autoregulatory mechanisms that result in dilation of the arteriolar bed.1 When challenged with vasodilators, blood flow will not increase in myocardial segments supplied by a significantly stenosed coronary artery because the perfusion reserve has already been exhausted by autoregulation, whereas perfusion will increase substantially in territories supplied by normal coronary arteries. Myocardial perfusion imaging can therefore identify the presence of a flow-limiting coronary stenosis by detecting regional variations in perfusion reserve.
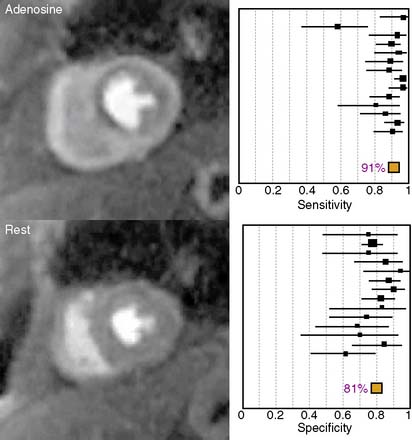
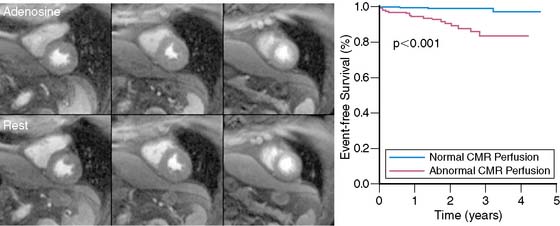
The diagnostic performance of perfusion CMR was recently evaluated in a meta-analysis of 14 studies including a total of 1183 patients.2 When compared to x-ray angiography, the sensitivity and specificity for detecting significant coronary artery disease were 91% and 81%, respectively (Fig. 17-1). In addition to its ability to identify patients with flow-limiting coronary disease, perfusion CMR readily differentiates low-risk from high-risk patients (Fig. 17-2). Three recent studies have prospectively studied the ability of perfusion CMR to identify low-risk patients. In these studies, only 4 of the 625 patients with no evidence of ischemia had a major adverse cardiac event after 1 year of follow-up.3–5 Stress testing in the MR environment is safe. Bernhardt et al. reported on the safety of performing an adenosine stress test in a MRI scanner.6 Of the 3174 patients studied, only one had a major complication (grand mal seizure). Minor side effects were experienced by 35% of the patients (e.g., chest pain, dyspnea, transient AV block, nausea). In this chapter, we will discuss the basic principle of perfusion CMR image acquisition and review various approaches used for image analysis.
BASIC PRINCIPLE OF IMAGE PREPARATION AND ACQUISITION
Regardless of the imaging modality used for assessing myocardial perfusion, the signal measured must adequately differentiate normally perfused myocardial segments from abnormally perfused segments. Contrast-enhanced CMR was initially used to estimate the perfusion reserve by Miller et al. in 1989.7 Atkinson et al. developed a technique a year later in 19908 that enabled a more dynamic evaluation of perfusion using first-pass imaging. Images are serially acquired in one or more preselected imaging planes as an intravenously administered bolus of a gadolinium chelate transits the vasculature and eventually the myocardium. As gadolinium migrates through the right-sided cardiac chambers, the pulmonary vasculature, the left-sided chambers, and ultimately the myocardium, a bright signal is generated. The rate of signal increase as the contrast agent initially perfuses a tissue is a gauge of blood flow.9
The signal generated and how closely it correlates to myocardial blood flow is also a function of the specific CMR pulse sequence parameters used. In order to generate a signal using magnetic resonance, the magnetization must be manipulated by applying a brief radiofrequency pulse to flip the proton alignment into the transverse plane. Once the radiofrequency pulse is completed, the protons return to their previous alignment. The rate at which the proton alignment recovers determines the longitudinal relaxation time, T1, of the tissue. Gadolinium is a paramagnetic contrast agent that shortens the T1 of neighboring protons, ultimately causing increased signal intensity in a concentration-dependent manner for T1-weighted images. In addition to the gadolinium concentration, the magnitude of the T1-weighted signal is dependent on the type of magnetization preparation used. The initial perfusion CMR studies were performed using an inversion recovery sequence.8 Because inversion recovery can be used to null the signal from tissues that are not exposed to gadolinium, a large signal contrast exists between hypoperfused and normally perfused tissues. However, magnetization preparation using inversion recovery is less robust in the presence of arrhythmias and is time- consuming, which compromises temporal resolution and limits the number of left ventricular slices that can be acquired during one cardiac cycle.
A more commonly used magnetization preparation scheme is saturation recovery.10 Saturation recovery is insensitive to arrhythmias, has a shorter acquisition window than inversion recovery, and more readily allows multislice coverage with an improved temporal resolution at the expense of reduced signal contrast between normally perfused and hypoperfused tissues. In experimental models and in clinical practice, the resultant contrast is sufficient to make a diagnosis.11 The amount of signal generated by a given concentration of gadolinium also depends on the time delay between magnetization preparation and image acquisition.12 Specifically, shorter delays allow for improved discrimination of higher concentrations of gadolinium, whereas longer delays allow for improved differentiation between lower concentrations of gadolinium.
Another important component of the CMR pulse sequence is the method of image acquisition. Currently, three approaches are most commonly used: gradient recalled echo (GRE),8 hybrid GRE and echoplanar imaging (GRE-EPI),13 and balanced steady-state free precession (SSFP).14 Each approach has its unique set of advantages and disadvantages. No consensus exists as to the best technique for image acquisition. The use of parallel imaging shortens the time necessary to acquire an image and likely reduces blurring and improves image quality of all three approaches.15,16
Of the three techniques, SSFP-based approaches have the highest contrast-to-noise ratio, and the signal is most linearly related to the underlying gadolinium concentration.17 However, the technique also requires a longer imaging duration, resulting in more blurring and motion artifact; SSFP also suffers most from susceptibility artifact. GRE-EPI has the most extensive spatial coverage and the shortest imaging duration, which results in less blurring and better image quality at higher heart rates. The signal is also linearly correlated with the concentration of gadolinium, but higher gadolinium concentrations are underestimated, and the overall CNR is less than that for SSFP-based images. GRE-based techniques have the lowest contrast-to-noise ratio and the poorest relationship between signal and gadolinium concentration. Its image duration is similar to SSFP, but the image quality may be better than SSFP at higher heart rates.
An important challenge of perfusion CMR is the so-called “dark rim artifact,” which mimics a hypoperfused segment on the subendocardial border of the myocardium.18,19 The etiology of the artifact is not clearly defined but appears to be related to cardiac motion, partial volume effects between the left ventricular cavity and the myocardium, and sudden changes in the concentration of contrast agent in the left ventricular blood pool and the myocardium. Whatever the etiology, the artifact is less pronounced when the hybrid GRE-EPI pulse sequence and parallel imaging are used.
APPROACHES TO IMAGE ANALYSIS
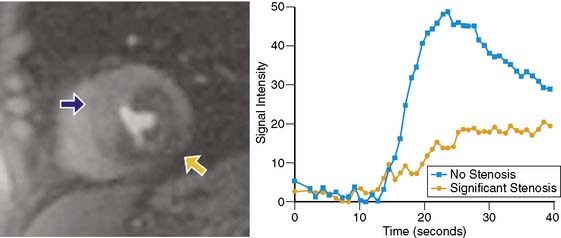
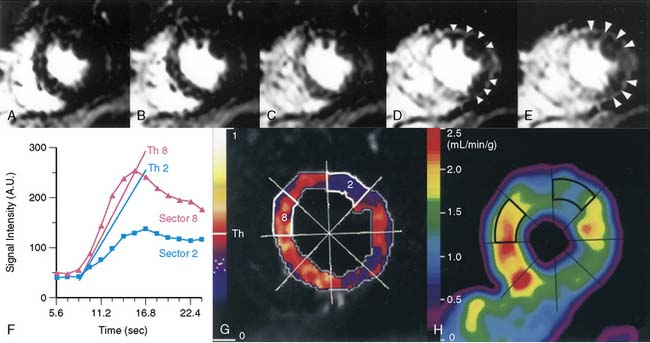
Because of its dynamic nature and versatility, perfusion CMR images can be analyzed qualitatively or quantitatively using time-intensity curves generated as the contrast agent perfuses the myocardium. Because qualitative interpretation can be performed immediately after image acquisition and does not require extensive postprocessing, it has been the most accepted in clinical practice. Atkinson et al. initially used CMR to visually detect first pass of gadolinium in humans in 1990.8 Since then, significant improvements in hardware and pulse sequence development allow for multislice imaging with high temporal resolution. Typically, complete images for at least three left ventricular short-axis slices are acquired during each cardiac cycle. As the contrast agent traverses the cardiac chambers and the myocardium, serial images are acquired for approximately 50 beats. Myocardial segments that are supplied by a severe coronary stenosis have a slower rise in signal intensity and become hypointense compared to normal segments (Fig. 17-3).9 The hypointensity is typically present in a coronary distribution and is most pronounced in the subendocardium and can extend into the midmyocardium.
Although the visual interpretation of these abnormal perfusion patterns is clearly subjective, inter-reader agreement is quite good.20 Because CMR is not limited by attenuation artifacts and has high spatial resolution, perfusion CMR may have an important clinical role for the detection of significant coronary artery disease. The ability of CMR to detect perfusion defects without being hindered by attenuation artifact was initially exploited by McCrohon et al.21 They studied 30 patients with a presumed inferior-wall attenuation artifact on single-photon emission computed tomography (SPECT) imaging. CMR confirmed the absence of a perfusion defect in 77% of patients and detected ischemia in the remaining 23%. In 104 patients with no history of prior myocardial infarction, Ishida et al. reported the diagnostic performance of perfusion CMR for detecting coronary stenoses at greater than 70%.22 In this patient population, the sensitivity was 90% and the specificity was 85%. As anticipated, the sensitivity was higher in patients with three-vessel coronary artery disease and lowest for detecting single-vessel disease. A subgroup of 69 patients also had SPECT imaging. Based on receiver operating characteristic (ROC) analysis, perfusion imaging using CMR performed better than nongated SPECT without attenuation correction. On the other hand, Sakuma et al. also compared x-ray angiography from 40 patients with both CMR and SPECT and found that there was no statistically significant difference in ROC for the two diagnostic tests.23
Although several small studies have evaluated the accuracy of perfusion CMR, it is not clear what the optimal contrast dose is for visual image interpretation. A recent multicenter, multivendor, prospectively designed trial of 234 patients tested five different doses of gadolinium ranging from 0.01 mmol/kg to 0.1 mmol/kg, and concluded that 0.1 mmol/kg was optimal.24 In the subgroup of patients who received this higher dose of gadolinium (n = 42), perfusion CMR performed at least as well as SPECT for detecting significant coronary disease. Based on ROC analysis, the area under the curve was 0.86 ± 0.06 (sensitivity 85%, specificity 67%) for CMR and 0.75 ± 0.09 for nongated SPECT (P = 0.12). In a total of 99 patients, another multicenter trial20 also evaluated the influence of three different doses of gadolinium (0.05 mmol/kg, 0.1 mmol/kg, and 0.15 mmol/kg) on the diagnostic performance of adenosine perfusion CMR. In this trial, the lower contrast agent dose outperformed the two higher doses. The sensitivity for detecting coronary stenoses greater than 70% was 93%, specificity was 75%, and accuracy was 85%. Although the preliminary data evaluating whether visual interpretation of perfusion CMR images are promising, the optimal contrast dose is not clearly defined, and it is unknown whether it will perform significantly better than gated SPECT utilizing attenuation correction. Large prospectively designed multicenter trials comparing the two modalities are still needed.
In addition to comparisons to SPECT imaging, first-pass vasodilator perfusion CMR has been compared to dobutamine functional CMR.25 Paetsch et al. studied 79 patients scheduled for x-ray angiography with both dobutamine and adenosine stress CMR. Adenosine perfusion imaging had a higher sensitivity (91% versus 89%) and a lower specificity (62% versus 80%), but the differences were not statistically significant. However, the development of an adenosine-induced wall motion abnormality was highly specific for the presence of significant coronary artery disease and occurred only in the presence of nearly transmural perfusion defects.
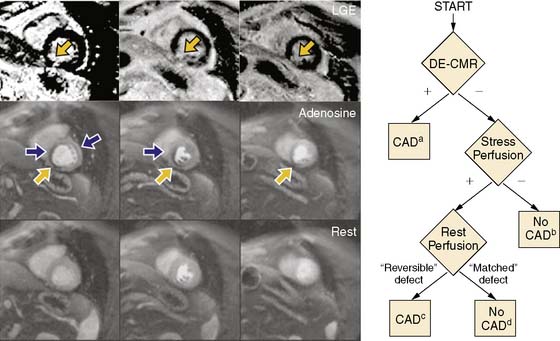
Although advantages of CMR perfusion imaging include its high spatial and temporal resolution, an important limitation is its ability to differentiate the problematic dark rim artifact from ischemia.19 Recently, Klem et al. proposed an algorithm utilizing late gadolinium enhancement scar imaging to help differentiate true perfusion defects from artifacts.26 In the algorithm, late gadolinium enhancement images are evaluated for the presence of a scar in a coronary distribution. Those patients with a subendocardial scar are diagnosed with significant coronary artery disease. If no scar is present, perfusion images acquired during hyperemia are analyzed for the presence of a perfusion defect. If no perfusion defect is present, significant obstructive coronary disease is excluded. If a perfusion defect is present, resting perfusion images are examined. All reversible perfusion defects are considered true ischemia, whereas perfusion abnormalities that persist on the resting images are attributed to artifact, because segments with a scar have already been accounted for earlier in the algorithm (Fig. 17-4). When compared to perfusion imaging alone, the combination of perfusion and scar imaging had an improved sensitivity (89% versus 84%), specificity (87% versus 58%), and diagnostic accuracy (88% versus 68%) in the 92 patients studied. But another study that included patients with a prior history of myocardial infarction27 concluded that the additive value of late gadolinium imaging was not as apparent and may even reduce the specificity for detecting a significant stenosis (87% versus 80%).
An important clinical use of myocardial perfusion imaging is for risk stratification of patients who present with acute chest pain. Kwong et al. evaluated 161 such patients presenting to an emergency department, using with resting first-pass perfusion CMR, left ventricular function analysis, and late gadolinium enhancement imaging.28 In this setting, CMR imaging had a sensitivity of 84% and a specificity of 85% for detecting acute coronary syndromes and outperformed other tests such as electrocardiography, troponin-1 measures, and the TIMI risk score. Although acute coronary syndromes include patients with either unstable angina or non–ST–elevation myocardial infarction (NSTEMI), patients with NSTEMI likely have a higher risk. As such, Plein et al. sought to determine the diagnostic accuracy of adenosine and resting perfusion imaging, scar imaging, and coronary imaging using CMR in 68 NSTEMI patients.29 Once again, CMR perfusion outperformed common clinical variables and had a sensitivity of 88% and a specificity of 83%. When all of the components of the CMR exam (function and coronary imaging) were included, the sensitivity increased to 96%, and the overall accuracy was 94%.
The data published, to date are highly encouraging and suggest that perfusion CMR imaging in combination with visual interpretation is a viable clinical tool for detecting hemodynamically significant coronary artery disease. Preliminary data suggest that combining perfusion CMR with coronary CMR will further improve the diagnostic performance of CMR.29,30 Additionally, the diagnostic accuracy of first-pass CMR perfusion imaging will further improve with the development of new higher spatial-resolution techniques31 and the higher signal-to-noise afforded b y 3-Tesla MRI scanners as compared to 1.5 Tesla.32
Semiquantitative Perfusion Cardiac Magnetic Resonance
An important advantage of perfusion CMR is its ability to quantify myocardial perfusion. Nagel et al. demonstrated that analysis using a myocardial perfusion reserve index outperformed visual interpretation for the detection of significant coronary artery disease.33 Parameters for quantification are derived from time-intensity curves generated as the gadolinium bolus transits the myocardium. The signal intensity initially increases as a function of time and ultimately plateaus as the bolus continues to perfuse the tissue (see Fig. 17-3). The slope at which the signal increases (i.e., upslope) and the peak signal intensity of the plateau are both related to the underlying severity of coronary artery disease9 and myocardial perfusion.7,34,35 A multicenter trial published by Giang et al. studied 80 patients using the upslope parameter acquired only during hyperemia.36 Depending on the dose of gadolinium used, the area under the ROC curve ranged from 0.52 to 0.91 for the detection of significant coronary disease. Another approach is to measure an index of myocardial perfusion reserve (MPRi) by dividing the upslope (or peak signal) acquired during hyperemia by the upslope (or peak signal) acquired during resting conditions. In a study of 84 patients, Nagel et al. found that an upslope-based perfusion reserve index cutoff value of 1.1 adequately discriminated patients with and without significant coronary artery disease.33 These investigators found that the MPRi outperformed stress-only perfusion imaging and was most robust if the hyperemic and resting upslopes were corrected for the left ventricular input. By correcting for the left ventricular input, the effect of the different hemodynamic conditions present during hyperemia and resting conditions on first-pass contrast dynamics could be accounted for. This approach yielded a sensitivity of 88%, a specificity of 90%, and an accuracy of 89%.
Despite the ability of myocardial perfusion imaging to detect significant coronary disease, perfusion is determined by the physiologic significance of a coronary stenosis rather than the anatomic extent of the lesion. In a study of 48 patients, Schwitter et al. demonstrated that the upslope parameter obtained only during hyperemia not only determined the presence of severe coronary stenosis but also readily identified myocardial segments with a reduced perfusion reserve as determined by positron emission tomography (PET) imaging (Fig. 17-5).37 Ibrahim et al. directly compared perfusion derived by CMR and PET to coronary angiography.38 In this study, the authors demonstrated that the MPRi determined using the upslope parameter (and not the peak signal intensity) was correlated to (but underestimated) the perfusion reserve as measured by PET. Additionally, the upslope technique was more closely related to PET than to x-ray angiography. Rieber et al. investigated the ability of perfusion CMR to accurately identify physiologically significant coronary artery disease by comparing the MPRi to invasive fractional flow reserve (FFR) in 43 patients.39 Those patients with a coronary stenosis greater than 50% and an FFR less than 0.75 had significantly lower MPRi than those patients with a coronary stenosis greater than 50% and an FFR greater than 0.75. The presence of MPRi less than1.5 had a sensitivity of 88% and a specificity of 90% (area under the curve of 0.93) for detecting hemodynamically significant stenoses. Only a moderate correlation between diameter stenosis and MPRi existed. In addition to being reduced in the presence of a hemodynamically significant coronary stenosis, the upslope parameter improves substantially following revascularization.40 Patients revascularized with a stent have a greater improvement in the MPRi than those revascularized by balloon angioplasty.41
Fully Quantitative Perfusion CMR
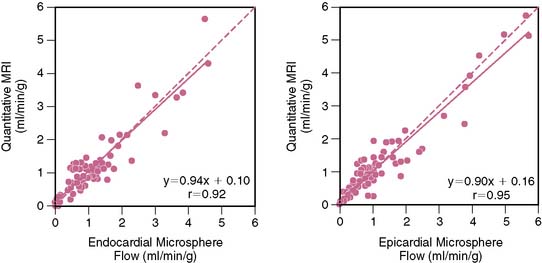
Absolute measures of myocardial blood flow during a myocardial perfusion imaging study would be desirable. In an ideal situation, this can be determined by measuring how quickly a contrast agent flows out of a region of interest (washout or tissue impulse response). However, an accurate measurement requires that the entire contrast bolus arrives instantaneously into the region of interest. Such circumstances necessitate that the contrast agent be injected directly into the coronary artery. When injected peripherally, upstream dispersion distorts the contrast bolus into a bell-shaped curve, preventing the entire bolus from arriving instantaneously into the region of interest. As the “bell-shaped” bolus travels through the myocardium, the concentration of contrast agent entering the tissue initially increases; therefore, as the initial low-concentration part of the contrast agent bolus is washing out, a higher concentration of contrast is simultaneously entering the tissue. Effectively, the changing bolus concentration (AIF, or arterial input function) masks the actual tissue impulse response. In fact, the signal (or time-intensity curve) that is actually generated as the bolus transits the myocardium (TF, or tissue function) is a fusion (or convolution) of the AIF and the tissue impulse response. Using a constrained Fermi function deconvolution, the tissue impulse response can be extracted from the AIF and TF. The amplitude of the tissue impulse response is a measure of absolute myocardial blood flow (Fig. 17-6).42,43 Therefore, a fully quantitative perfusion reserve (PR) is simply a ratio of the impulse response amplitudes obtained during hyperemia and during resting conditions. PR determined using a Fermi function deconvolution measures perfusion more accurately than other simpler methods such as peak contrast enhancement technique or signal upslope technique. The latter methods significantly underestimate higher myocardial blood flows (those > 1.5 to 2 mL/kg/min) as determined by gold-standard radiolabeled microspheres.44
Using a deconvolution technique, Cullen et al. showed that CMR-measured myocardial perfusion reserve was inversely correlated with the severity of underlying coronary stenosis (r = −0.81; P < 0.01).45 Futamatsu et al. prospectively compared the diagnostic performance of deconvolution analysis of perfusion CMR to semiquantitative and visual interpretation.46 Using FFR as the reference standard, perfusion reserve measured using deconvolution most accurately identified the presence of hemodynamically significant coronary stenoses.47 Other fully quantitative techniques have compared favorably to coronary flow reserve measurements made using intracoronary Doppler flow wire.48
An accurate assessment of myocardial blood flow requires precise measurement of the gadolinium concentration in both the left ventricular cavity and the myocardium. This is typically accomplished by using a low concentration of gadolinium; however, a low concentration of gadolinium is suboptimal for visual interpretation of the tissue perfusion. To solve this problem, Christian et al. proposed using a dual-bolus technique in which the arterial input function is separately measured using a very low dose of gadolinium and the tissue function is measured using a full dose.44 When compared to the standard single-bolus technique, the dual technique also resulted in reduced measurement variability.49 Alternatively, dual-contrast techniques simultaneously acquire low-resolution images that do not underestimate the AIF, and high-resolution and higher signal images that provide adequate contrast enhancement for the tissue perfusion.50
Using the dual-bolus technique, our group studied 30 patients referred for an x-ray angiogram.51 By selecting the appropriate perfusion reserve cutoff value, the dual- bolus technique can be optimized to detect the desired severity of coronary stenosis. A higher perfusion reserve cutoff value is better for detecting coronary stenoses greater than 50%, and a lower cutoff value is optimal for detecting stenoses greater than 70%. Furthermore, when compared to fully quantitative perfusion reserve analysis, visual interpretation significantly underestimated the ischemic burden in patients with three-vessel coronary artery disease and did not adequately differentiate single-vessel disease from three-vessel disease.
In addition to accurately defining the ischemic burden of coronary disease, quantitative perfusion analysis can provide new insights into the pathophysiology of ischemic heart disease. Selvanayagam et al. studied 27 patients with known coronary disease and wall-motion abnormalities prior to revascularization.52 They found that the resting myocardial blood flow was impaired in regions of hibernating myocardium and preserved in normal myocardial segments. Following revascularization, both resting myocardial blood flow and regional contraction improved. In another study, the same group evaluated the effects of distal embolization on myocardial perfusion reserve following percutaneous coronary intervention.53 Regions of myocardium that had new late gadolinium enhancement following revascularization had no improvement in perfusion reserve immediately following revascularization. Myocardial segments that were not complicated by distal embolization during revascularization had an acute improvement in the perfusion reserve.
Others have used fully quantitative perfusion CMR to demonstrate that the myocardial perfusion reserve is also reduced in asymptomatic patients with coronary artery calcification54 and other coronary risk factors.55 An important advantage of perfusion CMR is that it has the spatial resolution to resolve transmural differences in blood flow. Under normal circumstances, the resting myocardial blood flow is higher on the subendocardial border than on the subepicardial border, but in disease states such as hypertrophic cardiomyopathy56 and transplant arteriopathy,57 perfusion on the subendocardial border is disproportionately affected. This heterogeneity in myocardial blood flow is readily differentiated using CMR.
FUTURE DIRECTIONS
Unique to CMR perfusion imaging is the ability to determine perfusion without the use of exogenous contrast agents. One approach, arterial spin labeling (ASL), uses endogenous water as a freely diffusible tracer.58 Although numerous implementations are possible, in some approaches, protons in water molecules located proximal to the desired imaging plane are inverted or labeled. As these labeled protons enter the desired imaging slice, an apparent change in the T1 of the imaging slice occurs. Using specific variants of ASL, quantification of myocardial blood flow is feasible.59 An important limitation of ASL is that a large increase in flow results in a relatively small increase in signal. Despite this limitation, when combined with vasodilator stress testing, territories supplied by a stenotic coronary artery have a measurably lower perfusion reserve than segments supplied by normal coronary arteries.60
An alternative approach, blood oxygen level–dependent (BOLD) imaging, takes advantage of the fact that deoxygenated hemoglobin changes proton signals in such a way as to reflect blood oxygenation.61 In normal volunteers, Li et al. used BOLD imaging to detect alterations in the relationship between myocardial oxygen supply and demand caused by vasodilators and inotropes.62 Segments of myocardium distal to a significant stenosis can only maintain adequate tissue oxygenation by increasing myocardial blood volume.63 As the myocardial blood volume increases, the amount of deoxygenated hemoglobin present increases. As such, Wacker et al. showed that under resting conditions, myocardial segments supplied by a stenosed coronary had a significantly lower BOLD signal than normal segments, and this difference could be amplified using vasodilators.64 An important limitation of BOLD imaging is that significant changes in perfusion result in relatively small changes in signal.65 Newer multislice techniques with a more robust signal response are currently under development.66 In addition to its ability to estimate myocardial blood flow without the use of exogenous contrast agents, some investigators have combined ASL with BOLD imaging to quantify the rate of regional myocardial oxygen consumption.67,68
Nephrogenic Systemic Fibrosis
An important consideration in the use of gadolinium-based contrast agents for myocardial perfusion imaging is the potential complication of nephrogenic systemic fibrosis (NSF). NSF is a potentially life threatening and highly debilitating condition (initially described in 1997) that has some similarities to progressive systemic sclerosis and can involve the skin, pleura, pericardium, lungs, joints, and striated muscle. It has been associated with the use of gadolinium in patients with advanced renal disease.69 NSF is rare70 and is most likely to occur in patients on dialysis or those with a glomerular filtration rate less than 15 mL/min/1.73 m2.71 Current recommendations focus on minimizing the use of gadolinium in patients at risk for NSF. If possible, the use of gadolinium should be avoided in patients with a glomerular filtration rate less than 30 mL/min/1.73 m2. If gadolinium-based contrast agents must be used, then the lowest dose needed to reliably provide the sought-after diagnostic information should be utilized. Some have advocated that dialysis patients who have received gadolinium should be dialyzed within 2 hours and possibly again on the next day to help clear any residual contrast agent; however, no conclusive data to support this recommendation currently exist.72 Given that myocardial perfusion imaging can be performed using several alternative techniques, the authors currently recommend that gadolinium-based myocardial perfusion be avoided in patients at risk for NSF.
1. Chilian W.M., Layne S.M., Klausner E.C., et al. Redistribution of coronary microvascular resistance produced by dipyridamole. Am J Physiol Heart Circ Physiol. 1989;256:H383-H390.
2. Nandalur K.R., Dwamena B.A., Choudhri A.F., et al. Diagnostic performance of stress cardiac magnetic resonance imaging in the detection of coronary artery disease: A meta-analysis. J Am Coll Cardiol. 2007;50:1343-1353.
3. Ingkanisorn W.P., Kwong R.Y., Bohme N.S., et al. Prognosis of negative adenosine stress magnetic resonance in patients presenting to an emergency department with chest pain. J Am Coll Cardiol. 2006;47:1427-1432.
4. Jahnke C., Nagel E., Gebker R., et al. Prognostic value of cardiac magnetic resonance stress tests: adenosine stress perfusion and dobutamine stress wall motion imaging. Circulation. 2007;115:1769-1776.
5. Pilz G., Jeske A., Klos M., et al. Prognostic value of normal adenosine-stress cardiac magnetic resonance imaging. Am J Cardiol. 2008;101(10):1408-1412.
6. Bernhardt P., Levenson B., Engels T., et al. Contrast-enhanced adenosine-stress magnetic resonance imaging: Feasibility and practicability of a protocol for detection or exclusion of ischemic heart disease in an outpatient setting. Clin Res Cardiol. 2006;95:461-467.
7. Miller D.D., Holmvang G., Gill J.B., et al. MRI detection of myocardial perfusion changes by gadolinium-DTPA infusion during dipyridamole hyperemia. Magn Reson Med. 1989;10:246-255.
8. Atkinson D.J., Burstein D., Edelman R.R. First-pass cardiac perfusion: evaluation with ultrafast MR imaging. Radiology. 1990;174:757-762.
9. Manning W.J., Atkinson D.J., Grossman W., et al. First-pass nuclear magnetic resonance imaging studies using gadolinium-DTPA in patients with coronary artery disease. J Am Coll Cardiol. 1991;18:959-965.
10. Tsekos N.V., Zhang Y., Merkle H., et al. Fast anatomical imaging of the heart and assessment of myocardial perfusion with arrhythmia insensitive magnetization preparation. Magn Reson Med. 1995;34:530-536.
11. Wilke N., Jerosch-Herold M., Wang Y., et al. Myocardial perfusion reserve: assessment with multisection, quantitative, first-pass MR imaging. Radiology. 1997;204:373-384.
12. Bertschinger K.M., Nanz D., Buechi M., et al. Magnetic resonance myocardial first-pass perfusion imaging: parameter optimization for signal response and cardiac coverage. J Magn Reson Imaging. 2001;14:556-562.
13. Ding S., Wolff S.D., Epstein F.H. Improved coverage in dynamic contrast-enhanced cardiac MRI using interleaved gradient-echo EPI. Magn Reson Med. 1998;39:514-519.
14. Judd R.M., Reeder S.B., Atalar E., et al. A magnetization-driven gradient echo pulse sequence for the study of myocardial perfusion. Magn Reson Med. 1995;34:276-282.
15. Kellman P., Epstein F.H., McVeigh E.R. Adaptive sensitivity encoding incorporating temporal filtering (TSENSE). Magn Reson Med. 2001;45:846-852.
16. Griswold M.A., Jakob P.M., Heidemann R.M., et al. Generalized autocalibrating partially parallel acquisitions (GRAPPA). Magn Reson Med. 2002;47:1202-1210.
17. Lyne J.C., Gatehouse P.D., Assomull R.G., et al. Direct comparison of myocardial perfusion cardiovascular magnetic resonance sequences with parallel acquisition. J Magn Reson Imaging. 2007;26:1444-1451.
18. Storey P., Chen Q., Li W., et al. Band artifacts due to bulk motion. Magn Reson Med. 2002;48:1028-1036.
19. Di Bella E.V.R., Parker D.L., Sinusas A.J. On the dark rim artifact in dynamic contrast-enhanced MRI myocardial perfusion studies. Magn Reson Med. 2005;54:1295-1299.
20. Wolff S.D., Schwitter J., Coulden R., et al. Myocardial first-pass perfusion magnetic resonance imaging: a multicenter dose-ranging study. Circulation. 2004;110:732-737.
21. McCrohon J.A., Lyne J.C., Rahman S.L., et al. Adjunctive role of cardiovascular magnetic resonance in the assessment of patients with inferior attenuation on myocardial perfusion SPECT. J Cardiovasc Magn Reson. 2005;7:377-382.
22. Ishida N., Sakuma H., Motoyasu M., et al. Noninfarcted myocardium: correlation between dynamic first-pass contrast-enhanced myocardial MR imaging and quantitative coronary angiography. Radiology. 2003;229:209-216.
23. Sakuma H., Suzawa N., Ichikawa Y., et al. Diagnostic accuracy of stress first-pass contrast-enhanced myocardial perfusion MRI compared with stress myocardial perfusion scintigraphy. AJR Am J Roentgenol. 2005;185:95-102.
24. Schwitter J., Wacker C.M., van Rossum A.C., et al. MR-IMPACT: comparison of perfusion-cardiac magnetic resonance with single-photon emission computed tomography for the detection of coronary artery disease in a multicentre, multivendor, randomized trial. Eur Heart J. 2008;29:480-489.
25. Paetsch I., Jahnke C., Wahl A., et al. Comparison of dobutamine stress magnetic resonance, adenosine stress magnetic resonance, and adenosine stress magnetic resonance perfusion. Circulation. 2004;110:835-842.
26. Klem I., Heitner J.F., Shah D.J., et al. Improved detection of coronary artery disease by stress perfusion cardiovascular magnetic resonance with the use of delayed enhancement infarction imaging. J Am Coll Cardiol. 2006;47:1630-1638.
27. Cury R.C., Cattani C.A., Gabure L.A., et al. Diagnostic performance of stress perfusion and delayed-enhancement MR imaging in patients with coronary artery disease. Radiology. 2006;240:39-45.
28. Kwong R.Y., Schussheim A.E., Rekhraj S., et al. Detecting acute coronary syndrome in the emergency department with cardiac magnetic resonance imaging. Circulation. 2003;107:531-537.
29. Plein S., Greenwood J.P., Ridgway J.P., et al. Assessment of non-ST-segment elevation acute coronary syndromes with cardiac magnetic resonance imaging. J Am Coll Cardiol. 2004;44:2173-2181.
30. Bunce N.H., Reyes E., Keegan J., et al. Combined coronary and perfusion cardiovascular magnetic resonance for the assessment of coronary artery stenosis. J Cardiovasc Magn Reson. 2004;6:527-539.
31. Plein S., Kozerke S., Suerder D., et al. High spatial resolution myocardial perfusion cardiac magnetic resonance for the detection of coronary artery disease. Eur Heart J. 2008;29(17):2148-2155.
32. Cheng A.S., Pegg T.J., Karamitsos T.D., et al. Cardiovascular magnetic resonance perfusion imaging at 3-tesla for the detection of coronary artery disease: a comparison with 1.5-tesla. J Am Coll Cardiol. 2007;49:2440-2449.
33. Nagel E., Klein C., Paetsch I., et al. Magnetic resonance perfusion measurements for the noninvasive detection of coronary artery disease. Circulation. 2003;108:432-437.
34. Wilke N., Simm C., Zhang J., et al. Contrast-enhanced first pass myocardial perfusion imaging: correlation between myocardial blood flow in dogs at rest and during hyperemia. Magn Reson Med. 1993;29:485-497.
35. Epstein F.H., London J.F., Peters D.C., et al. Multislice first-pass cardiac perfusion MRI: validation in a model of myocardial infarction. Magn Reson Med. 2002;47:482-491.
36. Giang T.H., Nanz D., Coulden R., et al. Detection of coronary artery disease by magnetic resonance myocardial perfusion imaging with various contrast medium doses: first European multi-centre experience. Eur Heart J. 2004;25:1657-1665.
37. Schwitter J., Nanz D., Kneifel S., et al. Assessment of myocardial perfusion in coronary artery disease by magnetic resonance: a comparison with positron emission tomography and coronary angiography. Circulation. 2001;103:2230-2235.
38. Ibrahim T., Nekolla S.G., Schreiber K., et al. Assessment of coronary flow reserve: comparison between contrast-enhanced magnetic resonance imaging and positron emission tomography. J Am Coll Cardiol. 2002;39:864-870.
39. Rieber J., Huber A., Erhard I., et al. Cardiac magnetic resonance perfusion imaging for the functional assessment of coronary artery disease: a comparison with coronary angiography and fractional flow reserve. Eur Heart J. 2006;27:1465-1471.
40. Lauerma K., Virtanen K.S., Sipila L.M., et al. Multislice MRI in assessment of myocardial perfusion in patients with single-vessel proximal left anterior descending coronary artery disease before and after revascularization. Circulation. 1997;96:2859-2867.
41. Al Saadi N., Nagel E., Gross M., et al. Improvement of myocardial perfusion reserve early after coronary intervention: assessment with cardiac magnetic resonance imaging. J Am Coll Cardiol. 2000;36:1557-1564.
42. Jerosch-Herold M., Wilke N., Stillman A.E. Magnetic resonance quantification of the myocardial perfusion reserve with a Fermi function model for constrained deconvolution. Med Phys. 1998;25:73-84.
43. Axel L. Tissue mean transit time from dynamic computed tomography by a simple deconvolution technique. Invest Radiol. 1983;18:94-99.
44. Christian T.F., Rettmann D.W., Aletras A.H., et al. Absolute myocardial perfusion in canines measured by using dual-bolus first-pass MR imaging. Radiology. 2004;232:677-684.
45. Cullen J.H.S., Horsfield M.A., Reek C.R., et al. A myocardial perfusion reserve index in humans using first-pass contrast-enhanced magnetic resonance imaging. J Am Coll Cardiol. 1999;33:1386-1394.
46. Futamatsu, Wilke, Klassen, et al. Evaluation of cardiac magnetic resonance imaging parameters to detect anatomically and hemodynamically significant coronary artery disease. Am Heart J. 2007;154:298-305.
47. Costa M.A., Shoemaker S., Futamatsu H., et al. Quantitative magnetic resonance perfusion imaging detects anatomic and physiologic coronary artery disease as measured by coronary angiography and fractional flow reserve. J Am Coll Cardiol. 2007;50:514-522.
48. Kurita T., Sakuma H., Onishi K., et al. Regional myocardial perfusion reserve determined using myocardial perfusion magnetic resonance imaging showed a direct correlation with coronary flow velocity reserve by Doppler flow wire. Eur Heart J. 2009;30(4):444-452.
49. Utz W., Greiser A., Niendorf T., et al. Single- or dual-bolus approach for the assessment of myocardial perfusion reserve in quantitative MR perfusion imaging. Magn Reson Med. 2008;59(6):1373-1377.
50. Gatehouse P.D., Elkington A.G., Ablitt N.A., et al. Accurate assessment of the arterial input function during high-dose myocardial perfusion cardiovascular magnetic resonance. J Magn Reson Imaging. 2004;20:39-45.
51. Patel A.R., Antkowiak P., Nandalur K.R., et al. Differentiating moderate from severe coronary artery stenosis using quantitative myocardial perfusion imaging. J Cardiovasc Magn Reson. 2008;11:239.
52. Selvanayagam J.B., Jerosch-Herold M., Porto I., et al. Resting myocardial blood flow is impaired in hibernating myocardium: A magnetic resonance study of quantitative perfusion assessment. Circulation. 2005;112:3289-3296.
53. Selvanayagam J.B., Cheng A.S.H., Jerosch-Herold M., et al. Effect of distal embolization on myocardial perfusion reserve after percutaneous coronary intervention: A quantitative magnetic resonance perfusion study. Circulation. 2007;116:1458-1464.
54. Wang L., Jerosch-Herold M., Jacobs D.R.Jr, et al. Coronary artery calcification and myocardial perfusion in asymptomatic adults: The MESA (Multi-Ethnic Study of Atherosclerosis). J Am Coll Cardiol. 2006;48:1018-1026.
55. Wang L., Jerosch-Herold M., Jacobs D.R.Jr, et al. Coronary risk factors and myocardial perfusion in asymptomatic adults: The Multi-Ethnic Study of Atherosclerosis (MESA). J Am Coll Cardiol. 2006;47:565-572.
56. Petersen S.E., Jerosch-Herold M., Hudsmith L.E., et al. Evidence for microvascular dysfunction in hypertrophic cardiomyopathy. New insights from multiparametric magnetic resonance imaging. Circulation. 2007;115:2418-2425.
57. Muehling O.M., Wilke N.M., Panse P., et al. Reduced myocardial perfusion reserve and transmural perfusion gradient in heart transplant arteriopathy assessed by magnetic resonance imaging. J Am Coll Cardiol. 2003;42:1054-1060.
58. Williams D.S., Detre J.A., Leigh J.S., et al. Magnetic resonance imaging of perfusion using spin inversion of arterial water. Proc Natl Acad Sci U S A. 1992;89:212-216.
59. Reeder S.B., Atalay M.K., McVeigh E.R., et al. Quantitative cardiac perfusion: a noninvasive spin-labeling method that exploits coronary vessel geometry. Radiology. 1996;200:177-184.
60. Wacker C.M., Fidler F., Dueren C., et al. Quantitative assessment of myocardial perfusion with a spin-labeling technique: preliminary results in patients with coronary artery disease. J Magn Reson Imaging. 2003;18:555-560.
61. Ogawa S., Lee T.M., Kay A.R., et al. Brain magnetic resonance imaging with contrast dependent on blood oxygenation. Proc Natl Acad Sci U S A. 1990;87:9868-9872.
62. Li D., Dhawale P., Rubin P.J., et al. Myocardial signal response to dipyridamole and dobutamine: demonstration of the BOLD effect using a double-echo gradient-echo sequence. Magn Reson Med. 1996;36:16-20.
63. Lindner J.R., Skyba D.M., Goodman N.C., et al. Changes in myocardial blood volume with graded coronary stenosis. Am J Physiol. 1997;272:H567-H575.
64. Wacker C.M., Hartlep A.W., Pfleger S., et al. Susceptibility-sensitive magnetic resonance imaging detects human myocardium supplied by a stenotic coronary artery without a contrast agent. J Am Coll Cardiol. 2003;41:834-840.
65. Friedrich M.G., Niendorf T., Schulz-Menger J., et al. Blood oxygen level-dependent magnetic resonance imaging in patients with stress-induced angina. Circulation. 2003;108:2219-2223.
66. Fieno D.S., Shea S.M., Li Y., et al. Myocardial perfusion imaging based on the blood oxygen level–dependent effect using T2-prepared steady-state free-precession magnetic resonance imaging. Circulation. 2004;110:1284-1290.
67. Reeder S.B., Holmes A.A., McVeigh E.R., et al. Simultaneous noninvasive determination of regional myocardial perfusion and oxygen content in rabbits: Toward direct measurement of myocardial oxygen consumption at MR imaging. Radiology. 1999;212:739-747.
68. McCommis K.S., Zhang H., Herrero P., et al. Feasibility study of myocardial perfusion and oxygenation by noncontrast MRI: comparison with PET study in a canine model. Magn Reson Imaging. 2008;26:11-19.
69. Cowper S.E., Su L.D., Bhawan J., et al. Nephrogenic fibrosing dermopathy. Am J Dermatopathol. 2001;23(5):383-393.
70. Janus N., Launay-Vacher V., Karie S., et al. Prevalence of nephrogenic systemic fibrosis in renal insufficiency patients: Results of the FINEST study. Eur J Radiol. 2009.
71. Perez-Rodriguez J., Lai S., Ehst B.D., et al. Nephrogenic systemic fibrosis: incidence, associations, and effect of risk factor assessment—report of 33 cases. Radiology. 2009;250(2):371-377.
72. Shellock F.G., Spinazzi A. MRI safety update 2008: part 1, MRI contrast agents and nephrogenic systemic fibrosis. Am J Roentgenol. 2008;191(4):1129-1139.
[/level-membership-for-internal-medicine-category][not-level-membership-for-internal-medicine-category]
Chapter 17 Myocardial Perfusion
Magnetic Resonance Imaging
INTRODUCTION
The presence of a hemodynamically significant coronary stenosis can be detected by studying its influence on the downstream microcirculation. As the stenosis worsens, myocardial perfusion is preserved via autoregulatory mechanisms that result in dilation of the arteriolar bed.1 When challenged with vasodilators, blood flow will not increase in myocardial segments supplied by a significantly stenosed coronary artery because the perfusion reserve has already been exhausted by autoregulation, whereas perfusion will increase substantially in territories supplied by normal coronary arteries. Myocardial perfusion imaging can therefore identify the presence of a flow-limiting coronary stenosis by detecting regional variations in perfusion reserve.
The diagnostic performance of perfusion CMR was recently evaluated in a meta-analysis of 14 studies including a total of 1183 patients.2 When compared to x-ray angiography, the sensitivity and specificity for detecting significant coronary artery disease were 91% and 81%, respectively (Fig. 17-1). In addition to its ability to identify patients with flow-limiting coronary disease, perfusion CMR readily differentiates low-risk from high-risk patients (Fig. 17-2). Three recent studies have prospectively studied the ability of perfusion CMR to identify low-risk patients. In these studies, only 4 of the 625 patients with no evidence of ischemia had a major adverse cardiac event after 1 year of follow-up.3–5 Stress testing in the MR environment is safe. Bernhardt et al. reported on the safety of performing an adenosine stress test in a MRI scanner.6 Of the 3174 patients studied, only one had a major complication (grand mal seizure). Minor side effects were experienced by 35% of the patients (e.g., chest pain, dyspnea, transient AV block, nausea). In this chapter, we will discuss the basic principle of perfusion CMR image acquisition and review various approaches used for image analysis.
BASIC PRINCIPLE OF IMAGE PREPARATION AND ACQUISITION
Regardless of the imaging modality used for assessing myocardial perfusion, the signal measured must adequately differentiate normally perfused myocardial segments from abnormally perfused segments. Contrast-enhanced CMR was initially used to estimate the perfusion reserve by Miller et al. in 1989.7 Atkinson et al. developed a technique a year later in 19908 that enabled a more dynamic evaluation of perfusion using first-pass imaging. Images are serially acquired in one or more preselected imaging planes as an intravenously administered bolus of a gadolinium chelate transits the vasculature and eventually the myocardium. As gadolinium migrates through the right-sided cardiac chambers, the pulmonary vasculature, the left-sided chambers, and ultimately the myocardium, a bright signal is generated. The rate of signal increase as the contrast agent initially perfuses a tissue is a gauge of blood flow.9
The signal generated and how closely it correlates to myocardial blood flow is also a function of the specific CMR pulse sequence parameters used. In order to generate a signal using magnetic resonance, the magnetization must be manipulated by applying a brief radiofrequency pulse to flip the proton alignment into the transverse plane. Once the radiofrequency pulse is completed, the protons return to their previous alignment. The rate at which the proton alignment recovers determines the longitudinal relaxation time, T1, of the tissue. Gadolinium is a paramagnetic contrast agent that shortens the T1 of neighboring protons, ultimately causing increased signal intensity in a concentration-dependent manner for T1-weighted images. In addition to the gadolinium concentration, the magnitude of the T1-weighted signal is dependent on the type of magnetization preparation used. The initial perfusion CMR studies were performed using an inversion recovery sequence.8 Because inversion recovery can be used to null the signal from tissues that are not exposed to gadolinium, a large signal contrast exists between hypoperfused and normally perfused tissues. However, magnetization preparation using inversion recovery is less robust in the presence of arrhythmias and is time- consuming, which compromises temporal resolution and limits the number of left ventricular slices that can be acquired during one cardiac cycle.
A more commonly used magnetization preparation scheme is saturation recovery.10 Saturation recovery is insensitive to arrhythmias, has a shorter acquisition window than inversion recovery, and more readily allows multislice coverage with an improved temporal resolution at the expense of reduced signal contrast between normally perfused and hypoperfused tissues. In experimental models and in clinical practice, the resultant contrast is sufficient to make a diagnosis.11 The amount of signal generated by a given concentration of gadolinium also depends on the time delay between magnetization preparation and image acquisition.12 Specifically, shorter delays allow for improved discrimination of higher concentrations of gadolinium, whereas longer delays allow for improved differentiation between lower concentrations of gadolinium.
Another important component of the CMR pulse sequence is the method of image acquisition. Currently, three approaches are most commonly used: gradient recalled echo (GRE),8 hybrid GRE and echoplanar imaging (GRE-EPI),13 and balanced steady-state free precession (SSFP).14 Each approach has its unique set of advantages and disadvantages. No consensus exists as to the best technique for image acquisition. The use of parallel imaging shortens the time necessary to acquire an image and likely reduces blurring and improves image quality of all three approaches.15,16
Of the three techniques, SSFP-based approaches have the highest contrast-to-noise ratio, and the signal is most linearly related to the underlying gadolinium concentration.17 However, the technique also requires a longer imaging duration, resulting in more blurring and motion artifact; SSFP also suffers most from susceptibility artifact. GRE-EPI has the most extensive spatial coverage and the shortest imaging duration, which results in less blurring and better image quality at higher heart rates. The signal is also linearly correlated with the concentration of gadolinium, but higher gadolinium concentrations are underestimated, and the overall CNR is less than that for SSFP-based images. GRE-based techniques have the lowest contrast-to-noise ratio and the poorest relationship between signal and gadolinium concentration. Its image duration is similar to SSFP, but the image quality may be better than SSFP at higher heart rates.
An important challenge of perfusion CMR is the so-called “dark rim artifact,” which mimics a hypoperfused segment on the subendocardial border of the myocardium.18,19 The etiology of the artifact is not clearly defined but appears to be related to cardiac motion, partial volume effects between the left ventricular cavity and the myocardium, and sudden changes in the concentration of contrast agent in the left ventricular blood pool and the myocardium. Whatever the etiology, the artifact is less pronounced when the hybrid GRE-EPI pulse sequence and parallel imaging are used.
APPROACHES TO IMAGE ANALYSIS
Because of its dynamic nature and versatility, perfusion CMR images can be analyzed qualitatively or quantitatively using time-intensity curves generated as the contrast agent perfuses the myocardium. Because qualitative interpretation can be performed immediately after image acquisition and does not require extensive postprocessing, it has been the most accepted in clinical practice. Atkinson et al. initially used CMR to visually detect first pass of gadolinium in humans in 1990.8 Since then, significant improvements in hardware and pulse sequence development allow for multislice imaging with high temporal resolution. Typically, complete images for at least three left ventricular short-axis slices are acquired during each cardiac cycle. As the contrast agent traverses the cardiac chambers and the myocardium, serial images are acquired for approximately 50 beats. Myocardial segments that are supplied by a severe coronary stenosis have a slower rise in signal intensity and become hypointense compared to normal segments (Fig. 17-3).9 The hypointensity is typically present in a coronary distribution and is most pronounced in the subendocardium and can extend into the midmyocardium.
Although the visual interpretation of these abnormal perfusion patterns is clearly subjective, inter-reader agreement is quite good.20 Because CMR is not limited by attenuation artifacts and has high spatial resolution, perfusion CMR may have an important clinical role for the detection of significant coronary artery disease. The ability of CMR to detect perfusion defects without being hindered by attenuation artifact was initially exploited by McCrohon et al.21 They studied 30 patients with a presumed inferior-wall attenuation artifact on single-photon emission computed tomography (SPECT) imaging. CMR confirmed the absence of a perfusion defect in 77% of patients and detected ischemia in the remaining 23%. In 104 patients with no history of prior myocardial infarction, Ishida et al. reported the diagnostic performance of perfusion CMR for detecting coronary stenoses at greater than 70%.22 In this patient population, the sensitivity was 90% and the specificity was 85%. As anticipated, the sensitivity was higher in patients with three-vessel coronary artery disease and lowest for detecting single-vessel disease. A subgroup of 69 patients also had SPECT imaging. Based on receiver operating characteristic (ROC) analysis, perfusion imaging using CMR performed better than nongated SPECT without attenuation correction. On the other hand, Sakuma et al. also compared x-ray angiography from 40 patients with both CMR and SPECT and found that there was no statistically significant difference in ROC for the two diagnostic tests.23
Although several small studies have evaluated the accuracy of perfusion CMR, it is not clear what the optimal contrast dose is for visual image interpretation. A recent multicenter, multivendor, prospectively designed trial of 234 patients tested five different doses of gadolinium ranging from 0.01 mmol/kg to 0.1 mmol/kg, and concluded that 0.1 mmol/kg was optimal.24 In the subgroup of patients who received this higher dose of gadolinium (n = 42), perfusion CMR performed at least as well as SPECT for detecting significant coronary disease. Based on ROC analysis, the area under the curve was 0.86 ± 0.06 (sensitivity 85%, specificity 67%) for CMR and 0.75 ± 0.09 for nongated SPECT (P = 0.12). In a total of 99 patients, another multicenter trial20 also evaluated the influence of three different doses of gadolinium (0.05 mmol/kg, 0.1 mmol/kg, and 0.15 mmol/kg) on the diagnostic performance of adenosine perfusion CMR. In this trial, the lower contrast agent dose outperformed the two higher doses. The sensitivity for detecting coronary stenoses greater than 70% was 93%, specificity was 75%, and accuracy was 85%. Although the preliminary data evaluating whether visual interpretation of perfusion CMR images are promising, the optimal contrast dose is not clearly defined, and it is unknown whether it will perform significantly better than gated SPECT utilizing attenuation correction. Large prospectively designed multicenter trials comparing the two modalities are still needed.
In addition to comparisons to SPECT imaging, first-pass vasodilator perfusion CMR has been compared to dobutamine functional CMR.25 Paetsch et al. studied 79 patients scheduled for x-ray angiography with both dobutamine and adenosine stress CMR. Adenosine perfusion imaging had a higher sensitivity (91% versus 89%) and a lower specificity (62% versus 80%), but the differences were not statistically significant. However, the development of an adenosine-induced wall motion abnormality was highly specific for the presence of significant coronary artery disease and occurred only in the presence of nearly transmural perfusion defects.
Although advantages of CMR perfusion imaging include its high spatial and temporal resolution, an important limitation is its ability to differentiate the problematic dark rim artifact from ischemia.19 Recently, Klem et al. proposed an algorithm utilizing late gadolinium enhancement scar imaging to help differentiate true perfusion defects from artifacts.26 In the algorithm, late gadolinium enhancement images are evaluated for the presence of a scar in a coronary distribution. Those patients with a subendocardial scar are diagnosed with significant coronary artery disease. If no scar is present, perfusion images acquired during hyperemia are analyzed for the presence of a perfusion defect. If no perfusion defect is present, significant obstructive coronary disease is excluded. If a perfusion defect is present, resting perfusion images are examined. All reversible perfusion defects are considered true ischemia, whereas perfusion abnormalities that persist on the resting images are attributed to artifact, because segments with a scar have already been accounted for earlier in the algorithm (Fig. 17-4). When compared to perfusion imaging alone, the combination of perfusion and scar imaging had an improved sensitivity (89% versus 84%), specificity (87% versus 58%), and diagnostic accuracy (88% versus 68%) in the 92 patients studied. But another study that included patients with a prior history of myocardial infarction27 concluded that the additive value of late gadolinium imaging was not as apparent and may even reduce the specificity for detecting a significant stenosis (87% versus 80%).
