Chapter 18 Myocardial Perfusion Imaging with Contrast Echocardiography
ULTRASOUND CONTRAST AGENTS
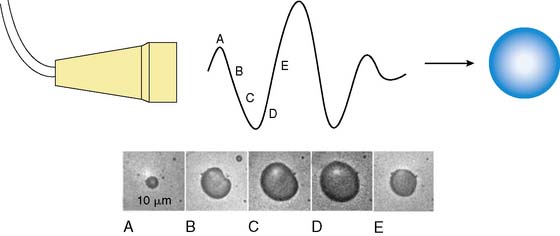
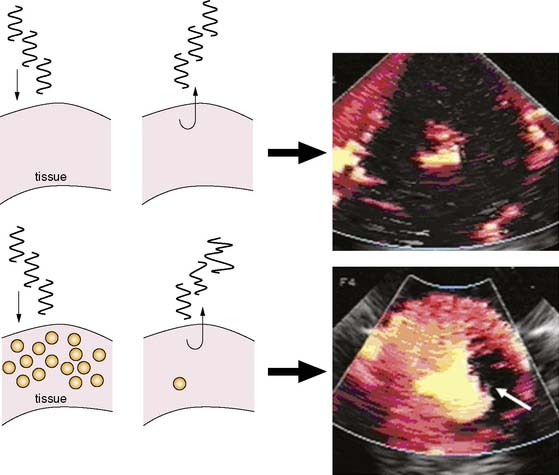
MCE is performed by combining ultrasound imaging with simultaneous intravascular injection of microbubbles that produce ultrasonic backscatter. Microbubbles undergo oscillation in an acoustic field whereby they compress and expand at the pressure peaks and nadirs, respectively (Fig. 18-1).1,2 Radial oscillation of microbubbles results in the generation of acoustic signals that greatly exceed backscatter produced solely by reflection or alteration in acoustic impedance. The ultrasound frequency required to produce backscatter depends on both the compressibility and size of the microbubble and fortuitously is within the range of frequencies routinely used for diagnostic ultrasound.2
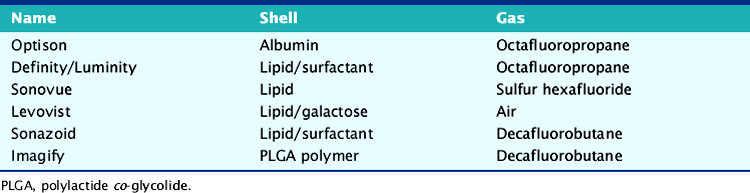
There has been substantial progress in the formulation of microbubble contrast agents that can be used to opacify the left heart after intravenous administration. These advancements have resulted from the development of stable encapsulated microbubbles with a narrow size distribution, typically between 2 and 6 μm in diameter, that are able to pass freely through pulmonary and systemic capillaries (Table 18-1). The stability and size optimization for these newer agents has occurred from the modification of the microbubble gas content and shell. Inert biologically safe gases have been used that have low diffusion coefficients and low solubility in water or blood, which reduces bubble collapse.3,4 These include octafluoropropane (C3F8), decafluorobutane (C4F10), dodecafluoropentane (C5F12) and sulfur hexafluoride (SF6). Shells are typically composed of protein (albumin), lipid surfactants, or biopolymers (e.g., lactide polymers). In addition to controlling size, the presence of a shell reduces outward diffusion and surface tension, thereby improving in vivo stability as well as shelf life. The use of air or nitrogen alone rather than high-molecular-weight gases in microbubble contrast agents is still possible, provided that the shell is relatively impermeable to low-molecular-weight gases. Strategies to decrease permeability can adversely affect the compressibility of microbubbles and, hence, their signal generation in an acoustic field.5
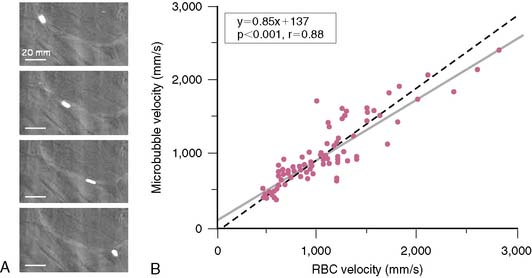
Since microbubbles can be directly visualized by microscopy, their in vivo behavior in the microcirculation can be assessed by intravital microscopy (Fig. 18-2). Studies have demonstrated that after intravenous injection, microbubbles transit the microcirculation of normal muscle beds unimpeded. These agents do not coalesce or aggregate, do not affect microvascular hemodynamics, and have a velocity profile similar to erythrocytes in arterioles, venules, and capillaries.6,7 After venous injection, any microbubbles larger than the average capillary dimension become entrapped by the pulmonary circulation. The extent of retention is directly related to the proportion of microbubbles that are larger than approximately 5 μm, which is relatively low (<1% to 2%) for most commercial microbubble agents. Moreover, entrapment of microbubbles in pulmonary capillaries or very small arterioles is transient, owing to gradual gas loss and deformability of the microbubbles, which allow their eventual release.6 As a result, venous injection at clinically relevant doses produces no significant alterations in pulmonary or hemodynamics or myocardial blood flow.7,8
Concerns regarding the safety of ultrasound contrast agents were raised with the announcement of a safety warning by the U.S. Food and Drug Administration (FDA) in 2007 that included a temporary placement of new contraindications to microbubble agents. These actions were prompted based on the report of several deaths that occurred within 30 minutes of contrast administration. These events, however, occurred mostly in critically ill patients against a background of more than 2 million doses administered in the United States. The FDA action triggered multiple large safety studies that have in aggregate examined hundreds of thousands of patients in whom ultrasound contrast agents have been administered. These studies indicate an excellent safety profile with no significant mortality risk with ultrasound contrast agents.9 Based on these findings and their own internal review, the FDA withdrew the contraindications in 2008.
Microbubble contrast agents have the potential to activate complement at their surface, similar to liposomal drugs and almost any therapy or diagnostic procedure that involves microparticle or nanoparticle administration. This response is in part responsible for clearance of microparticles. For lipid-encapsulated ultrasound contrast agents, the extent of complement activation is influenced by the net charge and presence of protective polymers such as polyethylene glycol, on the shell surface.10 This complement activation is likely responsible for reports of anaphylactoid reactions in patients receiving microbubble contrast agents, although the incidence of these reactions is very small (1 in 10,000),11 resulting in a safety profile that is favorable compared to most other contrast agents and cardiovascular diagnostic procedures.
IMAGING MICROBUBBLES IN TISSUE
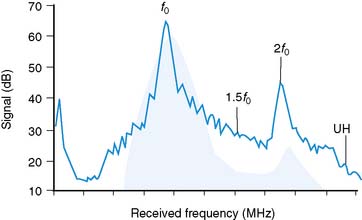
As stated earlier, the ability of microbubbles to compress and expand in the alternating pressure environment of an acoustic field forms the basis for their use as contrast agents. The magnitude of bubble vibration is dependent on the compressibility and density of the gas, the viscosity and density of the surrounding medium, the frequency and power of ultrasound applied, and initial microbubble radius.12,13 The degree of signal enhancement and signal-to-noise ratio during MCE is not, however, simply related to the degree of vibration in a monotonic fashion. When exposed to ultrasound at sufficient power and within the diagnostic frequency range for echocardiography, oscillation of microbubbles will occur in a nonlinear fashion in relation to acoustic pressure, meaning that even a small acoustic input will produce a large effect. At very high power, exaggerated microbubble oscillation will lead to microbubble disruption.2,14 Nonlinear oscillation and microbubble destruction produce a broad band of acoustic frequencies that occur outside the bandwidth of the transmission (fundamental) frequency. This broadband signal includes intensity peaks at the harmonic frequencies (multiples of the transmit frequency) and, in certain circumstances, subharmonics (even fractions of the transmit frequency) (Fig. 18-3). Because these harmonic signals emanate preferentially from microbubbles rather than tissue, the signal-to-noise ratio during MCE is improved when receiving at harmonic or subharmonic frequencies.14,15 In a similar fashion, it is also possible to improve signal-to-noise for ultrasound contrast agents by filtering for signals between the harmonic peaks where the difference between bubble and tissue signal is even greater.
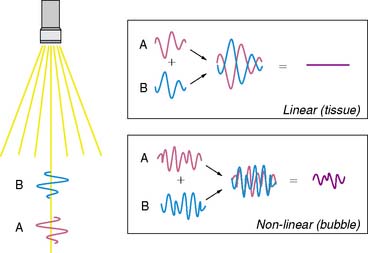
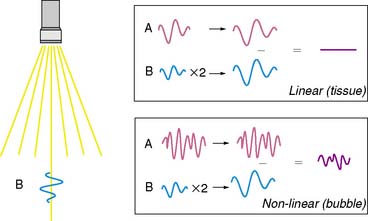
Imaging at low to intermediate acoustic powers produces nonlinear oscillation without microbubble destruction. This response produces harmonic signals at a low amplitude so that it becomes desirable to eliminate all tissue signal in order to maximize signal-to-noise ratio. Signal processing techniques have been developed for this purpose. One technique termed pulse-inversion or phase-inversion is depicted schematically in Figure 18-4.15 For each transmitted line, two successive pulses of ultrasound (A and B) are sent that are phase-inverted. Tissue produces linear signals that have equal amplitudes and 180-degree phase shifted for the two pulses. Thus summing these up results in no signal. In contradistinction, microbubbles produce nonlinear signals, and their summation does not cancel the signal, resulting in signal only from bubbles and not from tissue. Tissue signal can also be eliminated by alternating acoustic power rather than phase, termed amplitude or power modulation (Fig. 18-5).15 Successive in-phase pulses are transmitted for each line, alternating between intermediate power and half amplitude or low power. Linear signals that return from tissue are similar in phase and frequency. Accordingly, these can be eliminated by doubling the half-amplitude signal and subtracting this from the intermediate power signal. Since microbubbles produce a nonlinear signal at only the intermediate power, doubling the low-power linear signal will not result in complete cancellation of signal. Signals that are not cancelled are displayed according to amplitude, and since non-cancellation occurs even at the fundamental frequency, receive bandwidth can be broadened to include relatively stronger fundamental frequencies.
A final method for amplifying microbubble signal-to-noise relative to tissue relies on multipulse decorrelation analysis (Fig. 18-6).15 With these methods, a series of high-power pulses are transmitted for each line of ultrasound. The initial pulse(s) will return with nonlinear microbubble signal. Subsequent pulses return with less or no microbubble signal because of destruction from the initial pulse(s). The decorrelation or degree of difference between pulses is determined either by subtraction of the radiofrequency pulse (rate subtraction imaging) or by demodulation from Doppler processing (termed power Doppler imaging). The amplitude of decorrelation is displayed as pixel brightness and reflects the number of microbubbles present in tissue that were destroyed.
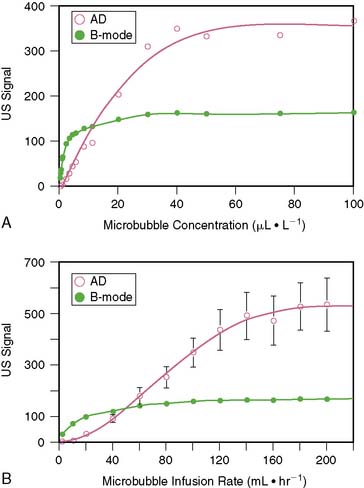
Because of the limited dynamic range of ultrasound transducers, the relation between microbubble concentration and signal intensity is linear only at low to medium concentrations (Fig. 18-7).16 The flat portion of the relation at higher concentrations is due in part to saturation by the upper limit of the dynamic range. Since ultrasound backscatter has to be displayed on a signal screen with an even smaller dynamic range (30 to 40 dB) than the received signal, some compression of the received signal must occur. Accordingly, direct assessment of digital data and imaging modalities that have a broad dynamic range (such as acoustic densitometry) are generally used during perfusion imaging when quantitative information on perfusion is desired.
QUANTIFICATION OF MYOCARDIAL BLOOD FLOW
Quantification of myocardial blood flow with MCE takes advantage of two key features of microbubbles: the rheology of microbubbles is identical to that of erythrocytes and the ability to destroy microbubbles with ultrasound. At steady state, when microbubble concentration in the blood pool is constant, the numbers of microbubbles entering or leaving any microcirculation within the ultrasound beam profile are equal; hence, the acoustic intensity from microbubbles or amount of myocardial contrast enhancement reflects myocardial blood volume (MBV).17 Microbubbles within the ultrasound beam can then be destroyed by high-power ultrasound, after which their rate of replenishment, measured by the rate of increase in acoustic signal, reflects blood velocity or transfer rate through tissue. Perfusion at the microvascular level can be derived by the product of microvascular blood velocity and MBV.17
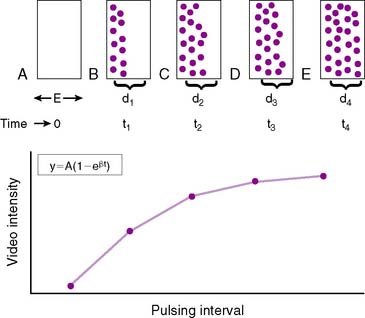
This concept is diagrammatically represented in Figure 18-8. The elevation (or thickness) of the ultrasound beam is represented by a rectangle with a thickness of E (panel A). After microbubbles are destroyed at t0 by a pulse of ultrasound (panel A), new microbubbles will begin to replenish the ultrasound beam elevation. As the pulsing interval (PI) is increased (panels B to E), there is more time for replenishment to occur between each destructive pulse of ultrasound, and the degree of microbubble replenishment into the elevation increases. Signal intensity will progressively increase at longer PIs (panel F). The rate of rise of signal intensity depicts myocardial blood flow velocity.17 When the PI is long enough for the entire ultrasound beam elevation to be completely replenished with microbubbles (panel E), the PI versus signal intensity relation plateaus. Steady state plateau signal intensity represents MBV, which is largely capillary blood volume. The PI versus signal intensity relation can be fitted to an exponential function: y = A(1−e−βt), where y is myocardial VI at a PI of t, A is the plateau VI representing MBV, and β is the rate constant representing the mean microbubble velocity. MCE can therefore determine both specific components of blood flow—flow velocity (β) and MBV.
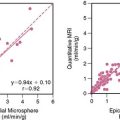
The plateau intensity, or the A-value, derived from replenishment curves described does not represent the MBV in absolute terms, since it is dependent on the concentration of microbubbles in blood and on regional attenuation. However, it is possible to normalize signal intensity values from the myocardium to that from adjacent parts of the left ventricular (LV) cavity to derive MBV fraction.18 This approach requires that the microbubble concentration in the LV cavity is still within the linear range, a condition that is difficult to ensure by visual inspection. The product of MBV fraction and microbubble velocity provides a quantitative assessment of myocardial blood flow (MBF). This has been validated in animals using radiolabeled microspheres and in humans using positron emission tomography.18,19
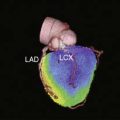
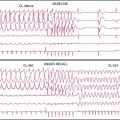
Figures 18-9 and 18-10 illustrate examples of how separate analysis of MBF velocity and MBV can provide better pathophysiologic insights into disease than simply measuring total MBF. Figure 18-9 illustrates time versus acoustic intensity (AI) curves that are obtained at rest during normal (panel A) and reduced MBF (panels B to D), where the reduction in MBF can be either due to decrease in MBV alone (such as non-transmural infarction when the infarct-related artery is patent with minimal stenosis, panel B), a decrease in blood velocity alone (such as during subtotal occlusion or total coronary occlusion with collateral-flow hibernating myocardium, panel C), or a combination of both a decrease in MBV and blood velocity, such as that seen in an infarcted myocardium supplied either by an artery with a very severe flow-limiting stenosis or by collaterals (panel D).
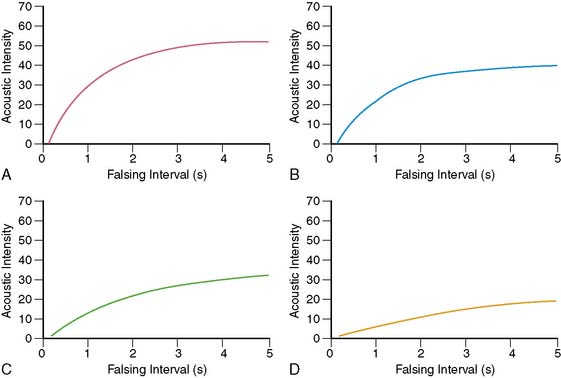
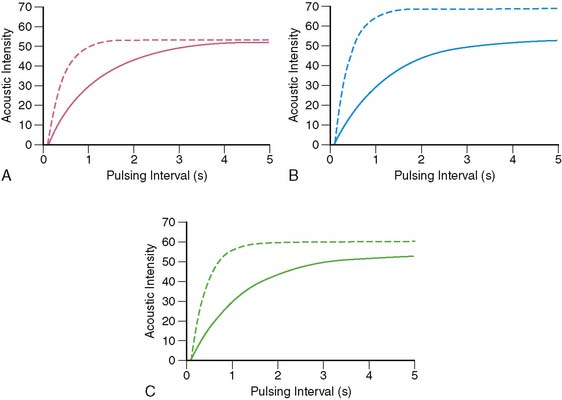
Figure 18-10 illustrates time versus AI curves obtained from the normal myocardium during rest and different forms of stress. Panel A depicts curves before and during intracoronary infusion of adenosine, where MBV remains constant, and blood flow velocity increases.20 At rest, the myocardium replenishes in 4 to 5 seconds after microbubble destruction. In the presence of intracoronary adenosine, MBF increases 4 to 5 times, solely because of an increase in MBF velocity without any change in MBV. Therefore, instead of taking 4 to 5 seconds to replenish, the myocardium now replenishes in 1 second.
Panel B shows curves before and during intracoronary infusion of dobutamine (where both MBV and velocity increase21). Panel C illustrates curves obtained before and during venous administration of either a vasodilator or dobutamine. The increase in MBV during intravenous compared to intracoronary administration of adenosine occurs from increase in myocardial oxygen demand that results from mild systemic hypotension and resultant reflex tachycardia.22 Similar curves can also be obtained during supine bicycle exercise.23
MYOCARDIAL CONTRAST ECHOCARDIOGRAPHY FOR CAD DETECTION
In the absence of prior infarction, the detection of coronary artery disease (CAD) on myocardial perfusion imaging is based on the occurrence of reversible perfusion defects during pharmacologic or exercise stress. Experimental studies had previously demonstrated the ability of MCE to detect coronary stenosis and to quantify the degree of MBF mismatch during pharmacologic stress.17 Studies also showed that coronary stenosis can be detected24,25 and abnormal coronary blood flow reserve can be accurately measured20 with MCE in humans using venous administration of microbubbles.
The conventional wisdom had been that a reversible perfusion defect results from MBF mismatch that is seen at stress and not at rest. Using MCE it has been shown that reversible perfusion defects are actually caused by a decrease in MBV distal to a stenosis during stress.32 When flow increases through a stenosis during stress, the coronary perfusion pressure falls. In order to maintain a constant capillary hydrostatic pressure, capillary derecruitment occurs, leading to a decrease in MBV. In the case of nuclear tracers, the resultant decrease in capillary surface area causes less tracer uptake and hence a perfusion defect.26 Thus the site of abnormal flow reserve in CAD is not at the level of the stenosis but actually at the level of the microcirculation.
The decrease in MBV during stress is seen only with moderate to severe stenosis. With less severe stenosis, the only abnormality seen on MCE is the inability of the MBF velocity to increase by the desired amount. As shown Figure 18-10, MBF velocity increases 4 to 5 times in the normal myocardium during stress. The inability of the MBF velocity to increase by this amount during stress indicates a reduction in MBF reserve. What discriminates the attenuation of flow reserve in the presence of a stenosis compared to other causes such as hyperlipidemia, and so forth, is its regional nature.20
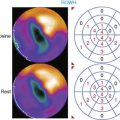
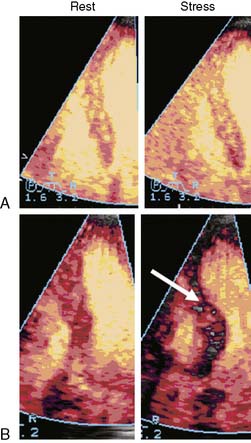
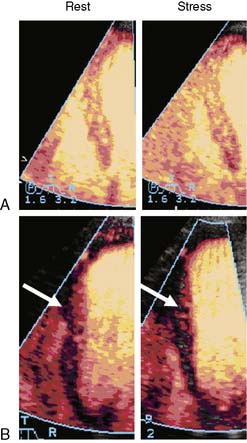
Figures 18-11 and 18-12 demonstrate normal perfusion (top panel) and either a reversible (Fig. 18-11) or a fixed (Fig. 18-12) defect (bottom panel) in patients undergoing dipyridamole stress imaging. The imaging protocol is based on the principles depicted in Figure 18-10. At rest, microbubble replenishment should occur in 4 to 5 seconds if MBF is normal. Therefore, the rest images (left panels) are captured at the fourth heartbeat after bubble destruction. If MBF reserve is normal, then at stress the myocardium should replenish within 1 second. Hence the stress images are captured at the first heartbeat after bubble destruction (right panels). In the normal setting, these two images (rest and stress) should look similar (panel A in both figures). If there is a significant stenosis in the absence of prior infarction, the stress image should show a relative defect compared to the rest image (indicated by arrows in panel B in Fig. 18-11). In the presence of infarction, where MBV is markedly reduced due to capillary loss, a fixed defect (present at both rest and stress) should be noted (indicated by arrows in panel B in Fig. 18-12). The images shown here were obtained using power Doppler, described earlier, with each wall in each view imaged separately because of the narrow imaging sector necessary for a high pulse-repetition frequency required to minimize motion artifacts.
Diagnosis of CAD with echocardiography conventionally relies on the detection of abnormal wall-motion in response to exercise or pharmacologic stress. Perfusion imaging with MCE has the potential to enhance sensitivity for detection of single-vessel and multivessel CAD. The relationship between MBF and wall thickening during peak inotropic stress has been shown to be nonlinear.27 In the presence of a mild to moderate stenosis, there is little impairment in wall thickening during peak dobutamine infusion, despite a substantial reduction in flow reserve. Accordingly, perfusion imaging has been shown in animal models to improve the sensitivity for detecting moderate stenosis, to detect stenosis at lower workload, to more accurately define the ischemic territory, and to detect multivessel disease more accurately.27 Clinical studies have recently confirmed that MCE during dobutamine stress can detect the presence of significant CAD even when wall-motion response is normal.28
MCE IN ACUTE MYOCARDIAL INFARCTION
Clinical predictors for the diagnosis of acute myocardial infarction (AMI) have well-recognized limitations in terms of their sensitivity and specificity.29–31 Although the use of cardiac-specific troponins has improved diagnosis of AMI and ability to assess higher risk, these tests may not be elevated at time of presentation of a patient in the emergency department and can be nonspecific in certain populations or disease conditions such as pulmonary embolism, pericarditis, myocarditis, and the like. MCE has been used to risk stratify patients with chest pain and nondiagnostic ECG in the emergency department.32,33 In these studies, MCE improved accuracy for detecting acute coronary syndromes and for predicting risk for short-term and long-term cardiac events, compared to conventional clinical information.33 A particular strength of this approach is its negative predictive value. Normal wall motion and perfusion during or soon after resolution of symptoms accurately exclude myocardial ischemia and portend an excellent prognosis. The positive predictive value is most accurate in those without prior ischemic events in whom a wall-motion abnormality or perfusion defect may not reflect a new event.
Even in patients with recognized AMI, assessment of the risk area size and extent may be helpful in risk assessment and treatment decision. The risk area is the region of the myocardium subtended an occluded coronary artery that is destined to undergo necrosis in the absence of reperfusion. The assessment of myocardial perfusion rather than wall motion is more accurate for defining the risk area, owing to contractile dysfunction that occurs in regions that are supplied by collateral perfusion.27 Since MCE can be performed rapidly and at the patient bedside, it is possible to measure risk area in patients who present with acute coronary syndromes prior to reperfusion therapy. It has provided important information in clinical trials testing the efficacy of therapies aimed at improving microvascular salvage by measuring the final infarct size proportional to the original area at risk.34
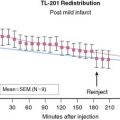
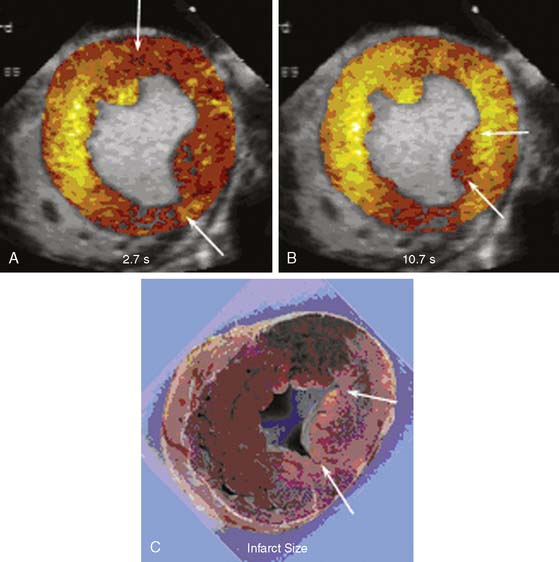
Implicit in the ability to measure the risk area with MCE is the ability to evaluate the extent of collateral blood flow. Myocardial necrosis does not occur unless MBF is less than about 25% of normal resting flow (approximately 0.20 to 0.25 mL/min/g).35,36 Sufficient flow for maintaining viability can be achieved through collateral circuits. However, perfusion in collateral-supplied regions is usually not normal, and these regions are usually characterized by slow microvascular blood velocity.37 An example of slow collateral blood flow is illustrated in Figure 18-13, where a perfusion defect in the territory of an occluded left circumflex is seen at low pulsing intervals (panel A) but is not seen at higher pulsing intervals (panel B) because of slow microbubble replenishment velocities through collateral circuits. As shown in the figure, the extent of collateral flow is important for predicting ultimate infarct size. Regions with adequate collateral flow did not exhibit infarction 6 hours later, while the region with very reduced flow (arrows in panels B and C) showed necrosis. In patients presenting with acute ST-elevation MI undergoing primary percutaneous intervention (PCI), myocardial salvage and functional recovery can be expected in areas supplied by collaterals that are detected by MCE prior to PCI.38 Because slow microvascular velocity can also represent resting hypoperfusion from a critical stenosis with antegrade flow, the presence of collateral flow is best determined by combining MCE data with the information on coronary anatomy.
In the setting of AMI, clinical indicators of reperfusion offer little spatial information on salvage. The excellent spatial resolution and bedside capabilities of MCE make it a practical method to assess the success of reperfusion. It is particularly valuable because flow is assessed at the capillary level. The spatial extent where capillary perfusion is absent is predictive of the eventual infarct zone, although the extent of reperfusion in the first few hours after reflow may not accurately estimate the ultimate infarct size due to temporal variation of flow and hyperemia in areas ultimately destined to undergo necrosis.39–41
ASSESSMENT OF MYOCARDIAL VIABILITY
In patients with recent AMI, wall motion does not recover in regions with poor microvascular flow after reperfusion therapy, and almost all segments that recover function have myocardial perfusion.42–45 The presence of perfusion on MCE does not, however, guarantee that resting contractile function will always recover.38,43,44,46,47 This seeming lack of “positive predictive value” is because segments with patchy or subendocardial infarction that have detectable perfusion will not regain resting wall motion if there is subendocardial necrosis. However, these segments do demonstrate contractile reserve during low-dose dobutamine challenge.38 Spatial patterns of flow by MCE have recently been shown to correlate well with delayed-enhanced gadolinium magnetic resonance imaging, which is also characterized by excellent spatial resolution in terms of discriminating viable from nonviable myocardial tissue.48 It is therefore not surprising that MCE in patients with recent acute MI can identify patients with a sufficient amount of myocardial salvage to protect against subsequent left ventricular remodeling.49 Patients with low or no reflow, regardless of thrombolysis in myocardial infarction (TIMI) score, have poor functional recovery of left ventricular function and greater infarct expansion, remodeling, and left ventricular dilation.50,51 Moreover, patients with poor microvascular reperfusion have a significantly higher incidence of cardiac events, including cardiac death, nonfatal myocardial infarction, and congestive heart failure, over a 1-year follow-up period.51
In patients with chronic CAD, determining the extent of myocardial viability is valuable for determining prognosis and deciding whether revascularization is warranted. A consistent, causative link exists between the extent of viability and survival, symptoms (angina and heart failure), exercise tolerance, and likelihood for remodeling after revascularization.52–55 Traditionally, echocardiographic evaluation of myocardial viability relies on the assessment of contractile reserve. This approach is limited both because of the confounding influence of ischemia on wall-motion response and the traditional use of low-dose dobutamine protocols to evaluate contractile response, which predominately tests viability of the endocardial segment. MCE has been applied to determine the spatial extent of myocardial viability in patients with chronic CAD at rest. In patients undergoing myocardial biopsy at the time of surgical revascularization, microvascular perfusion patterns on MCE reliably differentiate the presence of scar, which contains a paucity of microvessels, from viable muscle.56 When using recovery of resting function as an endpoint, MCE is characterized by an excellent sensitivity but somewhat low specificity.57–59 The low specificity finding is consistent with the idea that MCE can detect viability in regions other than the endocardium that do not necessarily contribute to resting function. Integration of perfusion data with DSE has been shown to improve both the sensitivity and specificity of viability diagnosis.60
1. Dayton P.A., Morgan K.E., Klibanov A.L., et al. Optical and acoustical observations of the effects of ultrasound on contrast agents. IEEE Trans Ultrason Ferroelect Freq Contr. 1999;46:220-232.
2. deJong N., Ten Cate F.J., Lancee C.T., et al. Principles and recent developments in ultrasound contrast agents. Ultrasonics. 1991;29:324-330.
3. Epstein P.S., Plesset M.S. On the stability of gas bubbles in liquid-gas solutions. J Chem Phys. 1950;18:1505-1509.
4. Kabalnov A., Klein D., Pelura T., Schutt E., Weers J. Dissolution of multicomponent microbubbles in the bloodstream: 1. Theory. Ultrasound Med Biol. 1998;24(5):739-749.
5. Leong-Poi H., Song J., Rim S.J., Christiansen J., Kaul S., Lindner J.R. Influence of microbubble shell on ultrasound signal during real-time myocardial contrast echocardiography. J Am Soc Echocardiogr. 2002;15:1269-1276.
6. Lindner J.R., Song J., Jayaweera A.R., et al. Microvascular rheology of Definity microbubbles following intra-arterial and intravenous administration. J Am Soc Echocardiogr. 2002;15:396-403.
7. Skyba D.M., Camarano G., Goodman N.C., et al. Hemodynamic characteristics, myocardial kinetics and microvascular rheology of FS-069, a second generation contrast agent capable of producing myocardial opacification from a venous injection. J Am Coll Cardiol. 1996;28:1292-1300.
8. Lindner J.R., Firschke C., Wei K., et al. Myocardial perfusion characteristics and hemodynamic profile of MRX-115, a venous echocardiographic contrast agent, during acute myocardial infarction. J Am Soc Echocardiogr. 1998;11:36-46.
9. Main M.L., Ryan A.C., Davis T.E., Albano M.P., Kusnetzky L.L., Hibberd M. Acute mortality in hospitalized patients undergoing echocardiography with and without an ultrasound contrast agent (multicenter registry results in 4,300,966 consecutive patients). Am J Cardiol. 2008. (e-publication)
10. Fisher N.G., Christiansen J.P., Klibanov A.L., et al. Influence of surface charge on capillary transit and myocardial contrast enhancement. J Am Coll Cardiol. 2002;40:811-819.
11. Wei K., Mulvagh S.L., Carson L., et al. The safety of Definity and Optison for ultrasound image enhancement: a retrospective analysis of 78,383 administered contrast doses. J Am Soc Echocardiogr. 2008;21:1202-1206.
12. Forsberg F., Shi W.T. Physics of contrast microbubbles. In: Goldberg B.B., Raichlen J.S., Forsberg. Ultrasound contrast agents. 2nd ed. London: Martin Dunitz; 2001:15-24.
13. DeJong N., Hoff L., Skotland T., Bom N. Absorption and scatter of encapsulated gas filled microspheres: theoretical considerations and some measurements. Ultrasonics. 1992;30(2):95-103.
14. Wei K., Skyba D.M., Firschke C., et al. Interactions between microbubbles and ultrasound: in vitro and in vivo observations. J Am Coll Cardiol. 1997;29:1081-1088.
15. Kaul S. Myocardial contrast echocardiography: Basic principles. Prog Cardiovasc Dis. 2001;44:1-11.
16. Le D.E., Bin J.P., Coggins M., Lindner J., Wei K., Kaul S. Relation between myocardial oxygen consumption and myocardial blood volume: A study using myocardial contrast echocardiography. J Am Soc Echocardiogr. 2002;15:857-863.
17. Wei K., Jayaweera A.R., Firoozan S., et al. Ultrasound-induced destruction of intravenously administered microbubbles: a novel method for the quantification of myocardial blood flow with echocardiography. Circulation. 1998;97:473-483.
18. Yano A., Ito H., Iwakura K., et al. Myocardial contrast echocardiography with a new calibration method can estimate myocardial viability in patients with myocardial infarction. J Am Coll Cardiol. 2004;43:1799-1806.
19. Vogel R., Indermuhle A., Reinhardt J., et al. The quantification of absolute myocardial perfusion in humans by contrast echocardiography: algorithm and validation. J Am Coll Cardiol. 2005;45:754-762.
20. Wei K., Ragosta M., Thorpe J., Coggins M., Moos S., Kaul S. Noninvasive quantification of coronary blood flow reserve in humans using myocardial contrast echocardiography. Circulation. 2001;103:2560-2565.
21. Bin J.P., Le D.E., Jayaweera A.R., Coggins M.P., Wei K., Kaul S. Direct effects of dobutamine on the coronary microcirculation: comparison with adenosine using myocardial contrast echocardiography. J Am Soc Echocardiogr. 2003;16:871-879.
22. Bin J.P., Pelberg R.A., Coggins M.P., Wei K., Kaul S. Mechanism of inducible regional dysfunction during dipyridamole stress. Circulation. 2002;106:112-117.
23. Miszalski-Jamka T., Kuntz-Hehner S., Schmidt H., et al. Real time myocardial contrast echocardiography during supine bicycle stress and continuous infusion of contrast agent: cutoff values for myocardial contrast replenishment discriminating abnormal myocardial perfusion. Echocardiography. 2007;24:638-648.
24. Kaul S., Senior R., Dittrich H., Raval U., Khattar R., Lahiri A. Detection of coronary artery disease using myocardial contrast echocardiography: comparison with 99mTc-sestamibi single photon emission computed tomography. Circulation. 1997;96:785-792.
25. Porter T.R., Li S., Jiang L., Grayburn P., Deligonul U. Real-time visualization of myocardial perfusion and wall thickening in human beings with intravenous ultrasonographic contrast and accelerated intermittent harmonic imaging. J Am Soc Echocardiogr. 1999;12:266-271.
26. Wei K., Ragosta M., Thorpe J., Moos S., Kaul S. Noninvasive measurement of coronary blood flow reserve myocardial contrast echocardiography. Circulation. 2001;103:2560-2565.
27. Leong-Poi H., Rim S.J., Le D.E., Fisher N.G., Wei K., Kaul S. Perfusion versus function: the ischemic cascade in demand ischemia: implications of single-vessel versus multivessel stenosis. Circulation. 2002;105:987-992.
28. Elhendy A., O’Leary E.L., Xie F., McGrain A.C., Anderson J.R., Porter T.R. Comparative accuracy of real-time myocardial contrast perfusion imaging and wall motion analysis during dobutamine stress echocardiography for the diagnosis of coronary artery disease. J Am Coll Cardiol. 2004;44:2185-2191.
29. Sabia P., Afrookteh A., Touchstone D.A., Keller M.W., Esquivel L., Kaul S. Value of regional wall motion abnormality in the emergency room diagnosis of acute myocardial infarction. A prospective study using two-dimensional echocardiography. Circulation. 1991;84(3 Suppl):I85-I92.
30. Short D. The earliest electrocardiographic evidence of myocardial infarction. Br Heart J. 1970;32:6-15.
31. Zarling E.J., Sexton H., Milnor P.Jr. Failure to diagnose acute myocardial infarction. The clinicopathologic experience at a large community hospital. JAMA. 1983;250:1177-1181.
32. Rinkevich D., Kaul S., Wang X.Q., et al. Regional left ventricular perfusion and function in patients presenting to the emergency department with chest pain and no ST-segment elevation. Eur Heart J. 2005;26:1606-1611.
33. Tong K.L., Kaul S., Wang X.Q., et al. Myocardial contrast echocardiography versus Thrombolysis In Myocardial Infarction score in patients presenting to the emergency department with chest pain and a nondiagnostic electrocardiogram. J Am Coll Cardiol. 2005;46:920-927.
34. Micari A., Belcik T.A., Balcells E.A., et al. Improvement in microvascular reflow and reduction of infarct size with adenosine in patients undergoing primary coronary stenting. Am J Cardiol. 2005;96:1410-1415.
35. Schaper W., Frenzel H., Hort W. Experimental coronary artery occlusion. I. Measurement of infarct size. Basic Res Cardiol. 1979;74:46-53.
36. Gewirtz H., Fischman A.J., Abraham S., Gilson M., Strauss H.W., Alpert N.M. Positron emission tomographic measurements of absolute regional myocardial blood flow permits identification of nonviable myocardium in patients with chronic myocardial infarction. J Am Coll Cardiol. 1994;23:851-859.
37. Coggins M.P., Sklenar J., Le D.E., Wei K., Lindner J.R., Kaul S. Noninvasive prediction of ultimate infarct size at the time of acute coronary occlusion based on the extent and magnitude of collateral-derived myocardial blood flow. Circulation. 2001;104:2471-2477.
38. Balcells E., Powers E.R., Lepper W., et al. Detection of myocardial viability by contrast echocardiography in acute infarction predicts recovery of resting function and contractile reserve. J Am Coll Cardiol. 2003;41:827-833.
39. Villanueva F.S., Glasheen W.P., Sklenar J., Kaul S. Assessment of risk area during coronary occlusion and infarct size after reperfusion with myocardial contrast echocardiography using left and right atrial injections of contrast. Circulation. 1993;88:596-604.
40. Ragosta M., Camarano G., Kaul S., Powers E.R., Sarembock I.J., Gimple L.W. Microvascular integrity indicates myocellular viability in patients with recent myocardial infarction. New insights using myocardial contrast echocardiography. Circulation. 1994;89:2562-2569.
41. Sakuma T., Okada T., Hayashi Y., Otsuka M., Hirai Y. Optimal time for predicting left ventricular remodeling after successful primary coronary angioplasty in acute myocardial infarction using serial myocardial contrast echocardiography and magnetic resonance imaging. Circ J. 2002;66:685-690.
42. Kamp O., Lepper W., Vanoverschelde J.L., et al. Serial evaluation of perfusion defects in patients with a first acute myocardial infarction referred for primary PTCA using intravenous myocardial contrast echocardiography. Eur Heart J. 2001;22:1485-1495.
43. Swinburn J.M., Lahiri A., Senior R. Intravenous myocardial contrast echocardiography predicts recovery of dyssynergic myocardium early after acute myocardial infarction. J Am Coll Cardiol. 2001;38:19-25.
44. Andrassy P., Zielinska M., Busch R., Schomig A., Firschke C. Myocardial blood volume and the amount of viable myocardium early after mechanical reperfusion of acute myocardial infarction: prospective study using venous contrast echocardiography. Heart. 2002;87:350-355.
45. Janardhanan R., Swinburn J.M., Greaves K., Senior R. Usefulness of myocardial contrast echocardiography using low-power continuous imaging early after acute myocardial infarction to predict late functional left ventricular recovery. Am J Cardiol. 2003;92:493-497.
46. Lepper W., Hoffmann R., Kamp O., et al. Assessment of myocardial reperfusion by intravenous myocardial contrast echocardiography and coronary flow reserve after primary percutaneous transluminal coronary angioplasty [correction of angiography] in patients with acute myocardial infarction. Circulation. 2000;101:2368-2374.
47. Main M.L., Magalski A., Chee N.K., Coen M.M., Skolnick D.G., Good T.H. Full-motion pulse inversion power Doppler contrast echocardiography differentiates stunning from necrosis and predicts recovery of left ventricular function after acute myocardial infarction. J Am Coll Cardiol. 2001;38:1390-1394.
48. Janardhanan R., Moon J.C., Pennell D.J., Senior R. Myocardial contrast echocardiography accurately reflects transmurality of myocardial necrosis and predicts contractile reserve after acute myocardial infarction. Am Heart J. 2005;149:355-362.
49. Jeetley P., Swinburn J., Hickman M., Bellenger N.G., Pennell D.J., Senior R. Myocardial contrast echocardiography predicts left ventricular remodelling after acute myocardial infarction. J Am Soc Echocardiogr. 2004;17:1030-1036.
50. Ito H., Maruyama A., Iwakura K., et al. Clinical implications of the ‘no reflow’ phenomenon. A predictor of complications and left ventricular remodeling in reperfused anterior wall myocardial infarction. Circulation. 1996;93:223-228.
51. Sakuma T., Hayashi Y., Sumii K., Imazu M., Yamakido M. Prediction of short- and intermediate-term prognoses of patients with acute myocardial infarction using myocardial contrast echocardiography one day after recanalization. J Am Coll Cardiol. 1998;32:890-897.
52. Pasquet A., Robert A., D’hondt A.M., Dion R., Melin J.A., Vanoverschelde J.L. Prognostic value of myocardial ischemia and viability in patients with chronic left ventricular ischemic dysfunction. Circulation. 1999;100:141-148.
53. Afridi I., Grayburn P.A., Panza J.A., Oh J.K., Zoghbi W.A., Marwick T.H. Myocardial viability during dobutamine echocardiography predicts survival in patients with coronary artery disease and severe left ventricular systolic dysfunction. J Am Coll Cardiol. 1998;32:921-926.
54. Senior R., Kaul S., Lahiri A. Myocardial viability on echocardiography predicts long-term survival after revascularization in patients with ischemic congestive heart failure. J Am Coll Cardiol. 1999;33:1848-1854.
55. Samady H., Elefteriades J.A., Abbott B.G., Mattera J.A., McPherson C.A., Wackers F.J. Failure to improve left ventricular function after coronary revascularization for ischemic cardiomyopathy is not associated with worse outcome. Circulation. 1999;100:1298-1304.
56. Shimoni S., Frangogiannis N.G., Aggeli C.J., et al. Microvascular structural correlates of myocardial contrast echocardiography in patients with coronary artery disease and left ventricular dysfunction: implications for the assessment of myocardial hibernation. Circulation. 2002;106:950-956.
57. Shimoni S., Frangogiannis N.G., Aggeli C.J., et al. Identification of hibernating myocardium with quantitative intravenous myocardial contrast echocardiography: comparison with dobutamine echocardiography and thallium-201 scintigraphy. Circulation. 2003;107:538-544.
58. Nagueh S.F., Vaduganathan P., Ali N., et al. Identification of hibernating myocardium: comparative accuracy of myocardial contrast echocardiography, rest-redistribution thallium-201 tomography and dobutamine echocardiography. J Am Coll Cardiol. 1997;29:985-993.
59. Korosoglou G., Hansen A., Hoffend J., et al. Comparison of real-time myocardial contrast echocardiography for the assessment of myocardial viability with fluorodeoxyglucose-18 positron emission tomography and dobutamine stress echocardiography. Am J Cardiol. 2004;94:570-576.
60. Meza M.F., Ramee S., Collins T., et al. Knowledge of perfusion and contractile reserve improves the predictive value of recovery of regional myocardial function postrevascularization: a study using the combination of myocardial contrast echocardiography and dobutamine echocardiography. Circulation. 1997;18(96):3459-3465.