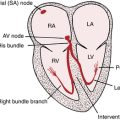
Chapter 9 Myocardial Infarction and Ischemia, II Non–ST Segment Elevation and Non–Q Wave Syndromes
Please go to expertconsult.com for supplemental chapter material.
Myocardial infarction (MI) may be associated with abnormal Q waves associated with the typical progression of ST segment elevation myocardial infarction (STEMI) and T wave inversions described in Chapter 8. In many cases, however, myocardial ischemia (with or without actual infarction) may be limited primarily to the subendocardium (inner layer) of the ventricle, often associated with ST segment depressions, rather than primary ST elevations.
Subendocardial Ischemia
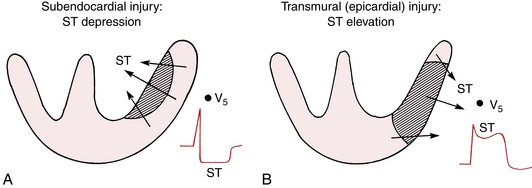
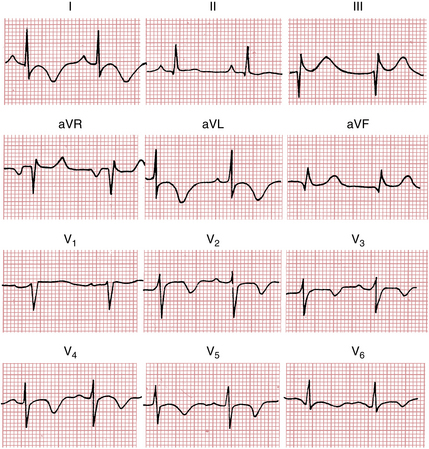
The most common ECG change with subendocardial ischemia is ST segment depression (Fig. 9-1). The ST depression may be limited to the anterior leads (I, aVL, and V1 to V6) or to the inferior leads (II, III, and aVF), or it may be seen more diffusely in both groups of leads. As shown in Figure 9-1, the ST segment depression with subendocardial ischemia has a characteristic squared-off shape. (ST segment elevation is usually seen in lead aVR.)
Recall from Chapter 8 that acute transmural ischemia produces ST segment elevation, a current of injury pattern. This results from epicardial injury. With pure subendocardial ischemia, just the opposite occurs; that is, the ECG shows ST segment depression (except in lead aVR, which often shows ST elevation).
In summary, myocardial ischemia involving primarily the subendocardium usually produces ST segment depression, whereas acute ischemia involving the epicardium usually produces ST elevation. This difference in the direction of the injury current vector is depicted in Figure 9-2.
ECG Changes with Angina Pectoris
Many (but not all) patients with classic angina have an ECG pattern of subendocardial ischemia, with ST segment depressions seen during an attack. When the pain disappears, the ST segments generally return to the baseline. (Fig. 9-3 shows ST depressions during a spontaneous episode of angina.)
Exercise (Stress) Testing and Coronary Artery Disease
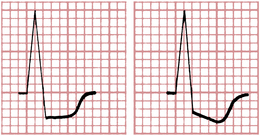
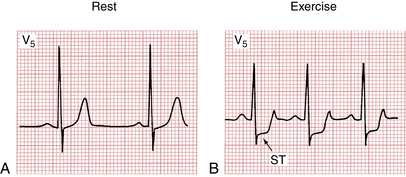
Figure 9-4A is the normal resting ECG of a patient, whereas Figure 9-4B shows the marked ST depressions recorded while the patient was exercising. The appearance of ST segment depressions constitutes a positive (abnormal) result. Most cardiologists accept horizontal or downward ST depressions of at least 1 mm or more, lasting at least 0.08 sec (two small boxes) as a positive (abnormal) test result (see Fig. 9-4B). ST depressions of less than 1 mm (or depressions of only the J point) with a rapid upward sloping of the ST segment are considered a negative (normal) test response (Fig. 9-5).

The finding of prominent ischemic ST changes, with or without symptoms, occurring at a low level of activity is particularly ominous. Sometimes, these changes will be associated with a drop in blood pressure. These findings may indicate severe three-vessel coronary disease and sometimes high-grade obstruction of the left main coronary artery.
False-positive tests (defined here as ST depressions without obstructive coronary disease) can also be seen in patients who are taking digitalis and in patients who have hypokalemia, left ventricular hypertrophy (LVH), ventricular conduction disturbances, or a Wolff-Parkinson-White pattern (see Chapter 12).
“Silent” Myocardial Ischemia
A patient with coronary artery disease may have episodes of myocardial ischemia without angina, hence the term silent ischemia. Silent ischemia is sometimes detected during exercise testing. Ambulatory ECG (Holter) monitoring is the most useful way of assessing silent myocardial ischemia (see Chapter 3). The 24-hour ECG monitoring of patients with coronary artery disease reveals a surprisingly high frequency of ST depressions not associated with angina. This important topic is discussed again later in this chapter.
Subendocardial Infarction
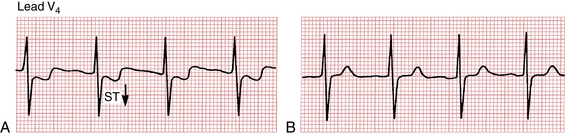
Figure 9-6 shows an example of a non–Q wave infarction with persistent ST depressions. Is it possible for Q waves to appear with pure subendocardial infarction? The answer is that if only the inner half of the myocardium is infarcted, abnormal Q waves usually do not appear. Subendocardial infarction generally affects ventricular repolarization (ST-T complex) and not depolarization (QRS complex). However, as discussed at the end of this chapter, important exceptions may occur, and so-called nontransmural infarctions, particularly larger ones, may be associated with Q waves.
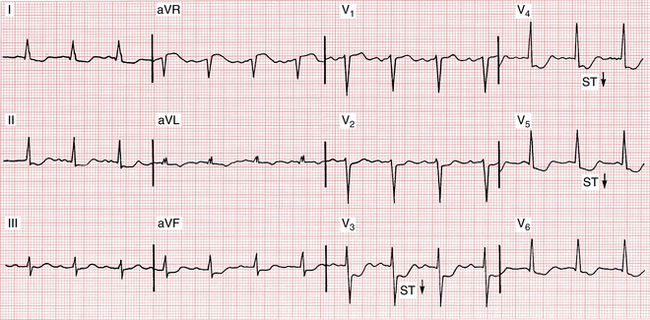
Another ECG pattern sometimes seen in non–Q wave infarction is T wave inversions with or without ST segment depressions. Figure 9-7 shows an infarction pattern with deep T wave inversions. (T wave inversions may also be seen in some cases of noninfarctional ischemia.)
Variety of ECG Changes Seen with Myocardial Ischemia
ECG Changes Associated with Noninfarction Ischemia
Myocardial ischemia does not always cause diagnostic ST-T changes. Several other patterns may be seen. In some patients the ECG may remain entirely normal during episodes of ischemia. In others the ST-T complex may display only subtle changes. For example, you may see just slight T wave flattening or minimal T wave inversions. These are nonspecific ST-T changes (see Chapter 10).
Patients with Prinzmetal’s angina are also atypical because their chest pain often occurs at rest or at night. In contrast, patients with classic angina pectoris usually have chest pain with exertion or emotional stress. Prinzmetal’s angina pattern is significant because it is a marker of coronary artery spasm that causes transient transmural ischemia. These episodes of spasm may occur in patients with otherwise normal coronary arteries. In most cases, spasm is associated with high-grade coronary obstruction (Fig. 9-8). Increasing evidence implicates cocaine as another cause of coronary spasm, sometimes leading to MI.
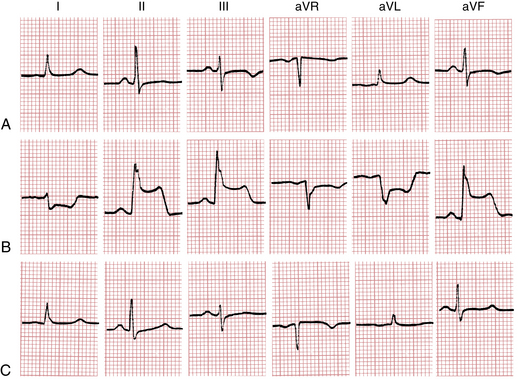
Figure 9-8 Prinzmetal’s (variant) angina with transient ST elevations in a 30-year-old man with a history of angina with exertion and at rest. A, The baseline resting ECG shows nonspecific inferior lead ST-T changes. B, With chest pain, marked ST segment elevations occur in leads II, III, and aVF, and reciprocal ST depressions are seen in leads I and aVL. The rightward axis shift and slight widening of the QRS complex are consistent with left posterior fascicular block (see Chapter 7). C, The ST segments return to baseline after the patient is given nitroglycerin. Cardiac catheterization showed severe right coronary obstruction with intermittent spasm producing total occlusion and transient ST elevations.
(From Goldberger AL: Myocardial Infarction: Electrocardiographic Differential Diagnosis, 4th ed. St. Louis, Mosby, 1991.)
Figure 9-9 shows the diverse ECG changes found in myocardial ischemia.
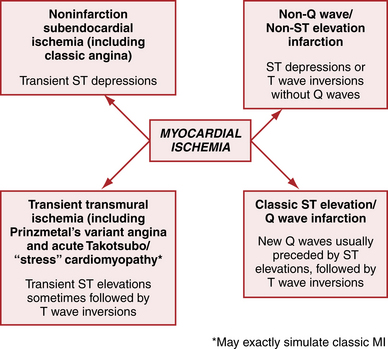
Figure 9-9 Myocardial ischemia/myocardial infarction (MI) in acute coronary artery syndromes (ACS) produces diverse ECG changes. T wave inversions may also occur with noninfarctional ischemia (see Fig. 9-11). Sometimes the ECG may be normal or show only nonspecific ST-T changes.


ST Segment Elevations: Differential Diagnosis
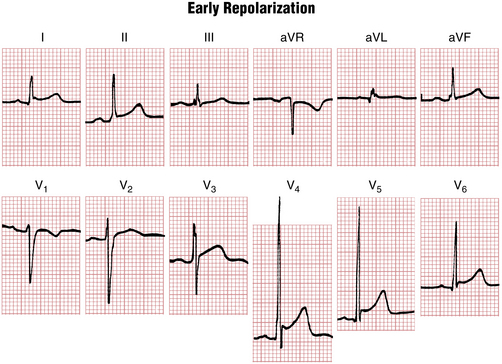
In Figure 9-10 (the ECG of a normal young adult), notice the marked elevation of the ST segments. This is a benign variant known as the early repolarization pattern. With early repolarization the ST segments in the chest leads may rise to 2 to 3 mm above the baseline. Although most common in young people, these ST elevations can also occur in older persons, simulating the pattern seen with acute pericarditis or MI. However, the elevations are stable and do not undergo the evolutionary sequence seen with acute pericarditis (Chapter 11). Furthermore, they are not associated with reciprocal ST depressions (except in lead aVR), contrary to what is often observed with acute MI.
ST segment elevations, resembling MI or pericarditis, may also occur with acute myocarditis (Chapter 11).
Chronic ST elevations are often seen in leads V1 and V2 in association with the patterns of LVH or left bundle branch block (LBBB) (Chapter 7).
Other causes of ST elevations include systemic hypothermia (J waves or Osborn waves, Chapter 10) and the Brugada pattern (Chapter 19).
A more comprehensive Instant Review summary of the differential diagnosis of ST segment elevations is given in Chapter 24.
ST Segment Depressions: Differential Diagnosis
Subendocardial ischemia is usually characterized by ST segment depression. However, not all ST depressions are indicative of subendocardial ischemia. For example, the ST-T changes associated with LVH (formerly referred to as the “strain” pattern) were discussed in Chapter 6. As shown in Figure 6-12, the ST segment may be slightly depressed with LVH. Acute transmural ischemia is another cause of ST segment depressions.
The ST segment may also be depressed by two important and common factors: the digitalis effect and hypokalemia (see Chapter 10). Digitalis may produce scooping of the ST-T complex with slight ST depression (see Fig. 18-1). The ST segment may also be slightly depressed in the ECGs of patients with a low serum potassium level (see Fig. 10-5). Prominent U waves may also appear. In some cases it may be difficult to sort out which factors are responsible for the ST depressions you are seeing. For example, a patient with LVH may be taking digitalis and may also be having acute subendocardial ischemia.
A comprehensive Instant Review summary of the differential diagnosis of ST segment depressions is given in Chapter 24.
Deep T Wave Inversions: Differential Diagnosis
Deep T wave inversions, as described previously, usually occur during the evolving phase of a Q wave MI (see Fig. 8-4B) and also sometimes with a non–Q wave MI (see Fig. 9-7). These deep inversions are the result of a delay in regional repolarization produced by the ischemic injury.
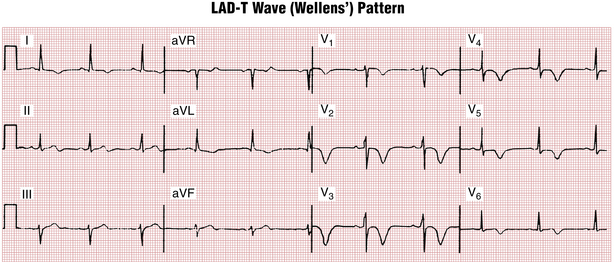
An important subset of patients with ischemic chest pain present with deep “coronary” T wave inversions in multiple precordial leads (e.g., V1 or V2 to V4 or V5) with or without cardiac enzyme elevations and with minimal or no ST elevations (Fig. 9-11). This pattern, called the Wellens’ syndrome or the LAD-T wave inversion pattern, is typically caused by a tight stenosis (blockage) in the left anterior descending (LAD) coronary artery system.
However, just as not all ST segment elevations reflect ischemia, not all deep T wave inversions are abnormal. For example, T wave inversions may be seen normally in leads with a negative QRS complex (e.g., in lead aVR). In adults the T wave may be normally negative in lead V1 and sometimes also in lead V2. Furthermore, as mentioned in Chapter 4, some adults have a persistent juvenile T wave inversion pattern, with negative T waves in the right and middle chest leads (typically V1 to V3).
In addition, not all abnormal T wave inversions are caused by MI. T wave inversions in the right chest leads may be caused by right ventricular overload and in the left chest leads by left ventricular overload (Chapter 6). Diffusely inverted T waves are seen during the evolving phase of pericarditis. Prominent T wave inversions may occur with the takotsubo (stress) cardiomyopathy (see earlier discussion).
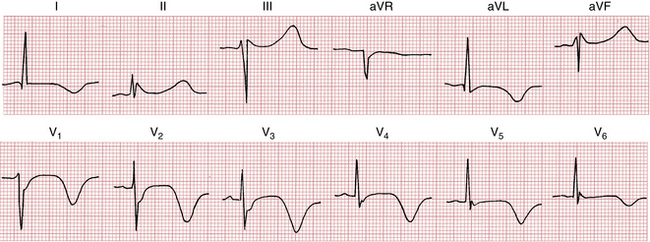
Very deep, widely splayed T wave inversions (with a long QT interval and sometimes prominent U waves) have been described in some patients with cerebrovascular accident (CVA), particularly subarachnoid hemorrhage (CVA T wave pattern) (Fig. 9-12). The cause of these marked repolarization changes in some types of cerebrovascular injury is not certain, but they probably reflect changes in the autonomic nervous system.
As described in Chapter 7, secondary T wave inversions (resulting from abnormal depolarization) are seen in the right chest leads with right bundle branch block (RBBB) and in the left chest leads with LBBB. Deep T wave inversions (V1-V4) may occur after electronic right ventricular pacing (called postpacemaker or memory T wave pattern; Chapter 21).
This list of noninfarctional factors that cause T wave inversions is by no means complete. However, it should convey the point that T wave inversions are not always indicative of myocardial ischemia. In some cases, deep diffuse (global) T wave inversions may occur without any identifiable cause. A more comprehensive “instant review” summary of the differential diagnosis of T wave inversions is given in Chapter 24.
Complications of Myocardial Infarction
The major complications can be either mechanical/structural or electrical. The mechanical complications include heart failure, cardiogenic shock, left ventricular aneurysm, rupture of the heart, pericarditis, papillary muscle dysfunction, infarct extension and expansion, and embolism. The electrical complications include the arrhythmias and conduction disturbances that occur as a consequence of ischemia or infarction. MI can cause virtually any arrhythmia, including sustained ventricular tachycardia or ventricular fibrillation leading to cardiac arrest. (The general subject of arrhythmias is discussed in Part II.) The conduction disturbances include atrioventricular block (heart block) and intraventricular block (bundle branch block) (see Chapters 7 and 17).
ECG after Coronary Revascularization
ECG recognition of acute MIs is important because such patients are generally candidates for emergency coronary revascularization with catheterization/angioplasty-related procedures or with intravenous thrombolytic therapy. As noted in Chapter 8, thrombolytic therapy has only proved helpful in cases of ST segment elevation MI (STEMI). Current evidence suggests that acute angioplasty is even more efficacious in this setting and it may also be useful in the emergency management of selected patients with non–ST segment elevation MI (non-STEMI).
The ECG in Myocardial Infarction: A Clinical Perspective
One final note of caution should be emphasized: The ECG is a reasonably sensitive but hardly perfect indicator of acute MI. Most patients with an acute MI or severe ischemia show the ECG changes described in Chapters 8 and 9. However, particularly during the early minutes or hours after an infarction, the ECG may be relatively nondiagnostic or even normal. Furthermore, an LBBB or pacemaker pattern may completely mask the changes of an acute infarct.