Chapter 8 Myocardial Infarction and Ischemia, I ST Segment Elevation and Q Wave Syndromes
Please go to expertconsult.com for supplemental chapter material.
This chapter and the next (forming one unit) examine one of the most important topics in clinical electrocardiography and clinical medicine—the diagnosis of myocardial ischemia and infarction∗ (ischemic heart disease), including ST segment elevation myocardial infarction (STEMI). Basic terms and concepts are briefly discussed first.
Transmural and Subendocardial Ischemia
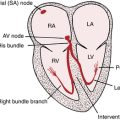
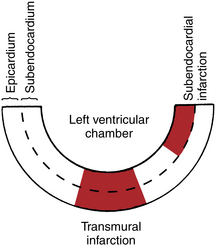
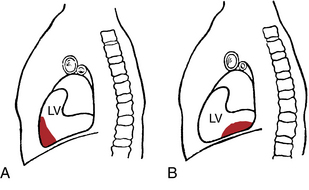
A simplified cross-sectional diagram of the left ventricle is presented in Figure 8-1. Notice that the left ventricle consists of an outer layer (epicardium or subepicardium) and an inner layer (subendocardium). This distinction is important because myocardial ischemia may be limited to just the inner layer, or it may affect virtually the entire thickness of the ventricular wall (transmural ischemia).
Myocardial Blood Supply
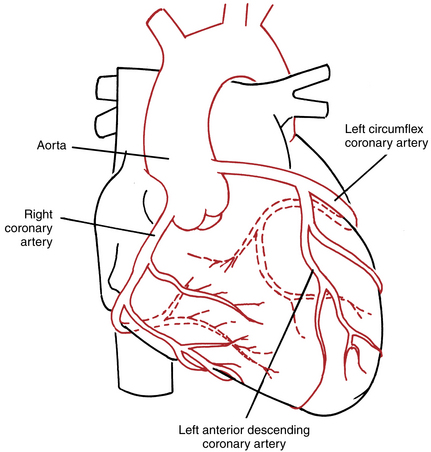
The cardiac blood supply is delivered by the three main coronary arteries and their branches (Fig. 8-2). The right coronary artery supplies both the inferior (diaphragmatic) portion of the heart and the right ventricle. The left main coronary artery is short and divides into the left anterior descending coronary artery, which generally supplies the ventricular septum and a large part of the left ventricular free wall, and the left circumflex coronary artery, which supplies the lateral wall of the left ventricle. This circulation pattern may be variable. Sometimes, for example, the circumflex artery also supplies the inferoposterior portion of the left ventricle. MIs tend to be localized to the region (e.g., anterior or inferior) of the left ventricle supplied by one of these arteries or their branches.
The serial, typical effects involving STEMI and Q wave MI on the ECG are examined in this chapter. Chapter 9 discusses the diversity of ECG patterns associated with non–ST segment elevation ischemia and non–Q wave infarctions.
ST Segment Elevation, Transmural Ischemia, and Acute Myocardial Infarction
The earliest ECG changes seen with an acute transmural ischemia/infarction typically occur in the ST-T complex in sequential phases:
1. The acute phase is marked by the appearance of ST segment elevations and sometimes tall positive (hyperacute) T waves in multiple (usually two or more) leads. The term “STEMI” refers to this phase.
2. The evolving phase occurs hours or days later and is characterized by deep T wave inversions in the leads that previously showed ST elevations.
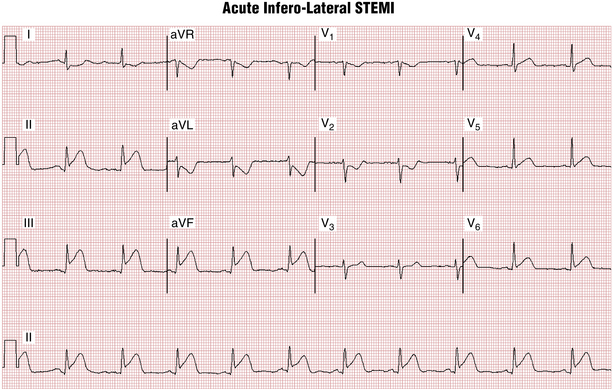
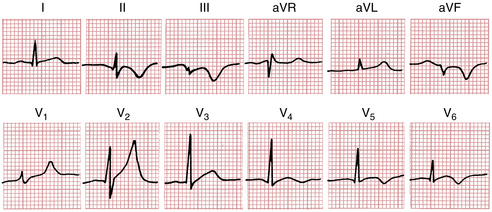
Transmural MIs can also be described in terms of the location of the infarct. Anterior means that the infarct involves the anterior or lateral wall of the left ventricle, whereas inferior indicates involvement of the inferior (diaphragmatic) wall of the left ventricle (Fig. 8-3). The anatomic location of the infarct determines the leads in which the typical ECG patterns appear. For example, with an acute anterior wall MI, the ST segment elevations and tall hyperacute T waves appear in one or more of the anterior leads (chest leads V1 to V6 and extremity leads I and aVL) (Fig. 8-4). With an inferior wall MI the ST segment elevations and tall hyperacute T waves are seen in inferior leads II, III, and aVF (Fig. 8-5).
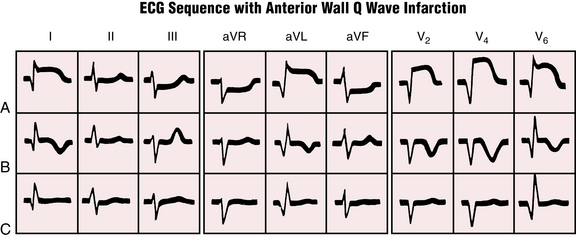
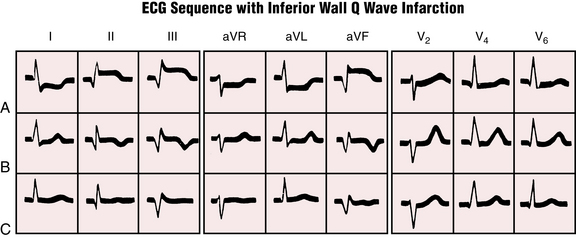
An important (but not always present) feature of the ST-T changes seen with STEMI is their reciprocity. The anterior and inferior leads tend to show inverse patterns. Thus in an anterior infarction with ST segment elevations in two or more of leads V1 to V6, I, and aVL, ST segment depression is often seen in leads II, III, and aVF. Conversely, with an acute inferior wall infarction, leads II, III, and aVF show ST segment elevation, with reciprocal ST depressions often seen in one or more of leads V1 to V3, I, and aVL. Reciprocal changes are illustrated in Figures 8-4 and 8-5.
The ST segment elevation seen with acute MI is called a current of injury and indicates that damage has occurred to the epicardial (outer) layer of the heart as a result of severe ischemia. The exact reasons that acute MI produces ST segment elevation are complex and not fully understood. Normally the ST segment is isoelectric (neither positive nor negative) because no net current flow is occurring at this time. MI alters the electrical charge on the myocardial cell membranes in a number of ways. As a result, current flow becomes abnormal (current of injury) and produces ST segment deviations.
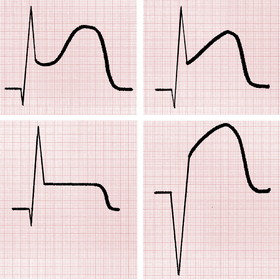
The ST segment elevation seen with acute MI may have different shapes and appearances (Fig. 8-6). Notice that the ST segment may be plateau-shaped or dome-shaped. Sometimes it is obliquely elevated.
The ST segment elevations (and reciprocal ST depressions) are the earliest ECG signs of infarction, and are generally seen within minutes of blood flow occlusion. Tall, positive (hyperacute) T waves may also be seen at this time (Figs. 8-7 and 8-8). These T waves have the same significance as the ST elevations. In some cases, hyperacute T waves actually precede the ST elevations.
Guidelines for assessing whether ST segment (and usually J point) elevations are due to acute ischemia have been suggested. However, strict criteria are limited because of false-positives (due to normal variants, left ventricular hypertrophy, etc., as described in Chapter 9) and false-negatives (e.g., T wave positivity may precede ST elevations or the ST elevations may be less than 1-2 mm).
After a variable time lag (usually hours to a few days) the elevated ST segments start to return to the baseline. At the same time the T waves become inverted in leads that previously showed ST segment elevations. This phase of T wave inversions is called the evolving phase of the infarction. Thus with an anterior wall infarction the T waves become inverted in one or more of the anterior leads (V1 to V6, I, aVL). With an inferior wall infarction the T waves become inverted in one or more of the inferior leads (II, III, aVF). (These T wave inversions are illustrated in Figs. 8-4 and 8-5.)
Key Clinical Correlates


QRS Changes: Q Waves of Infarction

The new Q waves of an MI generally appear within the first day or so of the infarct. With an anterior wall infarction these Q waves are seen in one or more of leads V1 to V6, I, and aVL (see Fig. 8-4). With an inferior wall MI the new Q waves appear in leads II, III, and aVF (see Fig. 8-5).
ECG Localization of Infarctions
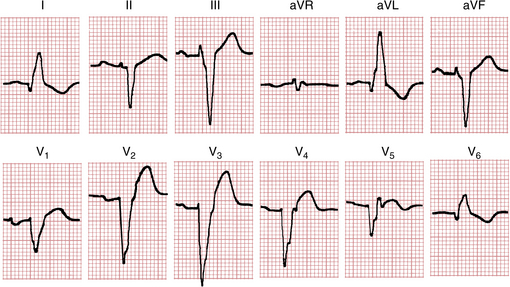
As mentioned earlier, MIs are generally localized to a specific portion of the left ventricle, affecting either the anterior or the inferior wall. Anterior infarctions are sometimes designated as anteroseptal, strictly anterior, or anterolateral/anteroapical, depending on the leads that show signs of the infarction (Figs. 8-9 to 8-11).
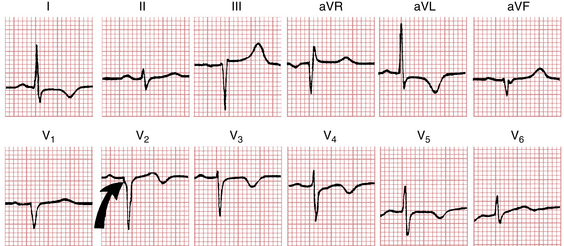
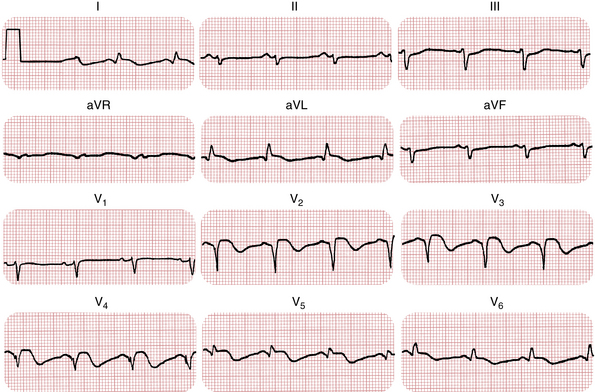
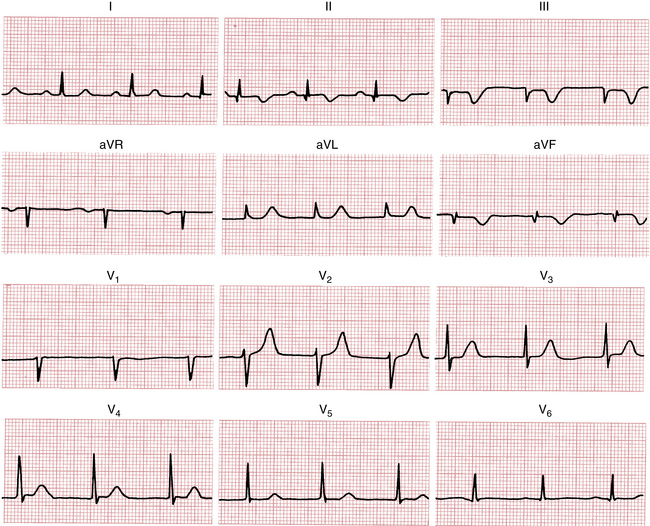
Figure 8-10 Evolving anterior wall infarction. The patient sustained the infarct 1 week earlier. Notice the abnormal Q waves (leads I, aVL, and V2 to V5) with slight ST segment elevations and deep T wave inversions. Marked left axis deviation resulting from left anterior fascicular block is also present (see Chapter 7).
Anterior Wall Q Wave Infarctions
“Anteroseptal” Q Wave Infarctions
Remember from Chapter 4 that the ventricular septum is depolarized from left to right and that leads V1 and V2 show small positive (r) waves (septal r waves). Now consider the effect of damaging the septum. Obviously, septal depolarization voltages are lost. Thus the r waves in leads V1 and V2 may disappear and an entirely negative (QS) complex appears.
“Strictly” Anterior Q Wave Infarctions
Normally leads V3 and V4 show RS- or Rs-type complexes. If an infarction occurs in the anterior wall of the left ventricle, the positive R waves that reflect the voltages produced by this muscle area are lost. Instead, Q waves (as part of QS or QR complexes) are seen in leads V3 and V4. A strictly anterior infarct generally results from occlusion of the left anterior descending coronary artery.
Anterolateral or Anteroapical Q Wave Infarctions
An infarction of the anterolateral or apical wall of the left ventricle produces changes in the more laterally situated chest leads (V5 and V6). With such infarctions, abnormal Q waves, as part of QS or QR complexes, appear in leads V5 and V6 (see Fig. 7-7). The infarcts are often caused by occlusion of the left circumflex coronary artery, but they may also result from occlusion of the left anterior descending coronary artery or even a branch of a dominant right coronary artery.
Inferior Wall Infarctions
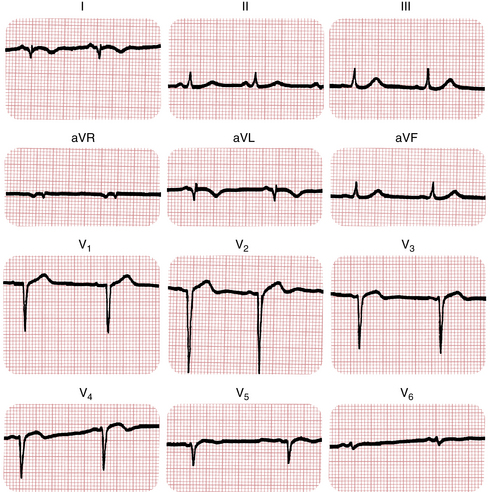
Infarction of the inferior (diaphragmatic) portion of the left ventricle is indicated by changes in leads II, III, and aVF (Figs. 8-12 to 8-14). These three leads, as shown in the diagram of the frontal plane axis, are oriented downward or inferiorly (see Fig. 5-1). Thus they record voltages from the inferior portion of the ventricle. An inferior wall infarction may produce abnormal Q waves in leads II, III, and aVF. This type of infarction is generally caused by occlusion of the right coronary artery. Less commonly it occurs because of a left circumflex coronary obstruction.
(Used with permission from Nathanson LA, McClennen S, Safran C, Goldberger AL: ECG Wave-Maven: Self-Assessment Program for Students and Clinicians. http://ecg.bidmc.harvard.edu.)
Posterior Infarctions
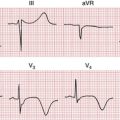
Infarctions can occur in the posterior (back) surface of the left ventricle. These infarctions may be difficult to diagnose because characteristic abnormal ST elevations may not appear in any of the 12 conventional leads. Instead, tall R waves and ST depressions may occur in leads V1 and V2 (reciprocal to the Q waves and ST segment elevations that would be recorded at the back of the heart). During the evolving phase of these infarctions, when deep T wave inversions appear in the posterior leads, the anterior chest leads show reciprocally tall positive T waves (Fig. 8-15).
In most cases of posterior MI the infarct extends either to the lateral wall of the left ventricle, producing characteristic changes in lead V6, or to the inferior wall of that ventricle, producing characteristic changes in leads II, III, and aVF (see Fig. 8-15). Because of the overlap between inferior, lateral, and posterior infarctions, the more general terms inferoposterior or posterolateral are used, depending on which leads are involved.
Right Ventricular Infarctions
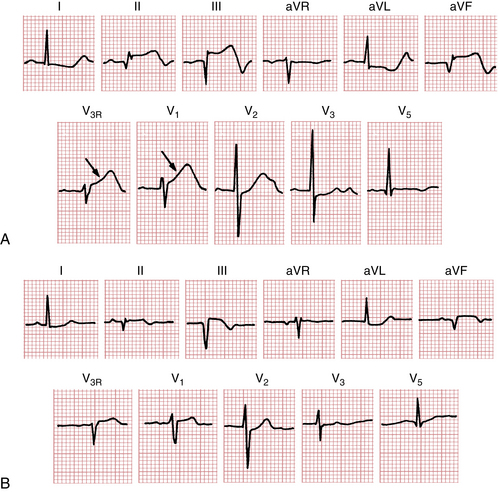
A related topic is right ventricular infarction. Clinical and autopsy studies have shown that patients with an inferoposterior infarct not uncommonly have associated right ventricular involvement. In one postmortem study, right ventricular infarction was found in about one of four cases of inferoposterior MI but not in cases of anterior MI. Clinically, patients with a right ventricular infarct may have elevated central venous pressure (distended neck veins) because of the abnormally high diastolic filling pressures in the right side of the heart. If the damage to the right ventricle is severe, hypotension and even cardiogenic shock may result. Atrioventricular conduction disturbances are not uncommon in this setting. The presence of jugular venous distention in patients with acute inferoposterior wall MIs should always suggest this diagnosis. Many of these patients also have ST segment elevations in leads reflecting the right ventricle, such as V1 and V3R to V5R, as shown in Figure 8-16 (see also Chapter 3).
Classic Sequence of St-T Changes and Q Waves with Stemi
To this point the ventricular depolarization (QRS complex) and repolarization (ST-T complex) changes produced by an acute MI have been discussed separately. As shown in Figures 8-4 and 8-5, these changes often occur sequentially.
Ordinarily, the earliest sign of transmural ischemia is ST segment elevations (with reciprocal ST depressions). The ST elevations (current of injury pattern) usually persist for hours to days. During this same period, Q waves often begin to appear in the leads that show ST elevations. Once these changes have occurred, the ST segments start to return to the isoelectric baseline and the T waves become inverted during the evolving phase.
In the weeks or months after an infarct, what should you expect to happen to the Q waves and the ST-T changes just described? The answer is that you cannot make any certain predictions. In most cases the abnormal Q waves persist for months and even years after the acute infarction. Occasionally, however, the abnormal Q waves diminish in size and even disappear entirely. In some cases, abnormal T wave inversions persist indefinitely. In others, improvement occurs, but minor nonspecific ST-T abnormalities such as slight T wave flattening may persist (see Figs. 8-4 and 8-5).
Normal and Abnormal Q Waves: A Brief Overview
A frequently encountered diagnostic problem is deciding whether Q waves are abnormal. Not all Q waves are indicators of MI. For example, a Q wave is normally seen in lead aVR. Furthermore, small “septal” q waves are normally seen in the left chest leads (V4 to V6) and in one or more of leads I, aVL, II, III, and aVF. Recall from Chapter 4 the significance of these septal q waves. The ventricular septum depolarizes from left to right. Left chest leads record this spread of voltages toward the right as a small negative deflection (q wave) that is part of a qR complex in which the R wave represents the spread of left ventricular voltages toward the lead. When the electrical axis is horizontal, such qR complexes are seen in leads I and aVL. When the electrical axis is vertical, qR complexes appear in leads II, III, and aVF.
What if Q waves with duration of 0.04 sec or more are seen in leads V1 and V2? A large QS complex can be a normal variant in lead V1 and rarely in leads V1 and V2. However, QS waves in these leads may be the only evidence of an anterior septal MI. An abnormal QS complex resulting from infarction sometimes shows a notch as it descends, or it may be slurred instead of descending and rising abruptly (see Fig. 8-9). Further criteria for differentiating normal from abnormal Q waves in these leads lie beyond the scope of this book.
• An inferior wall MI should be diagnosed with certainty only when abnormal Q waves are seen in leads II, III, and aVF. If prominent Q waves appear just in leads III and aVF, the likelihood of MI is increased by the presence of abnormal ST-T changes in all three inferior extremity leads.
• An anterior wall MI should not be diagnosed from lead aVL alone. Look for abnormal Q waves and ST-T changes in the other anterior leads (I and V1 to V6).
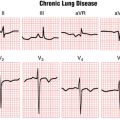
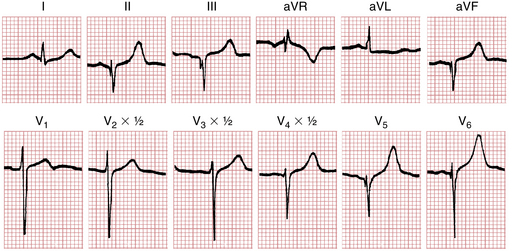
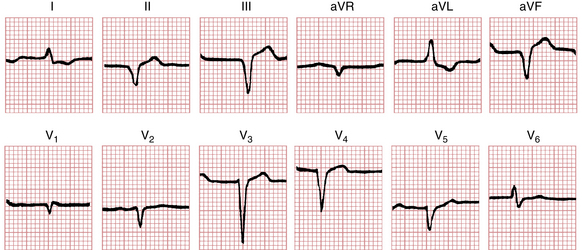
Furthermore, just as not all Q waves are abnormal, all abnormal Q waves are not the result of MI. For example, slow R wave progression in the chest leads, sometimes with actual QS complexes in the right to middle chest leads (e.g., V1 to V3), may occur with left bundle branch block (LBBB), left ventricular hypertrophy, amyloidosis, and chronic lung disease in the absence of MI, in addition to multiple other factors. Prominent noninfarction Q waves are often a characteristic feature in the ECGs of patients with hypertrophic cardiomyopathy (Fig. 8-17). Noninfarction Q waves also occur with dilated cardiomyopathy (see Fig. 11-4). As mentioned previously, the ECGs of normal people sometimes have a QS wave in lead V1 and rarely in leads V1 and V2. Prominent Q waves in the absence of MI are sometimes referred to as a pseudoinfarct pattern (see Chapter 24).
Ventricular Aneurysm
The ECG may be helpful in making the diagnosis of ventricular aneurysm subsequent to an MI. Patients with ventricular aneurysm frequently have persistent ST segment elevations after an infarct. As mentioned earlier, the ST segment elevations seen with acute infarction generally resolve within several days. The persistence of ST segment elevations for several weeks or more is suggestive of a ventricular aneurysm (Fig. 8-18). However, the absence of persisting ST segment elevations does not rule out the possibility of an aneurysm.
Ventricular aneurysms are of clinical importance for several major reasons. They may lead to congestive heart failure. They may be associated with serious ventricular arrhythmias. A thrombus may form in an aneurysm and break off, resulting in a stroke or some other embolic complication.
Multiple Infarctions
Not infrequently, patients may have two or more MIs at different times. For example, a new anterior wall infarct may develop in a patient with a previous inferior wall infarction. In such cases the ECG initially shows abnormal Q waves in leads II, III, and aVF. During the anterior infarct, new Q waves and ST-T changes appear in the anterior leads. (The ECG of a patient with multiple infarcts [anterior and inferior] is presented in Fig. 8-19.)
Diagnosis of Myocardial Infarction In the Presence of Bundle Branch Block
The diagnosis of infarction is more difficult when the patient’s baseline ECG shows a bundle branch block pattern or a bundle branch block develops as a complication of the MI. Then the ECG picture becomes more complex.
Right Bundle Branch Block with Myocardial Infarction
The diagnosis of an MI can be made relatively easily in the presence of right bundle branch block (RBBB). Remember that RBBB affects primarily the terminal phase of ventricular depolarization, producing a wide R′ wave in the right chest leads and a wide S wave in the left chest leads. MI affects the initial phase of ventricular depolarization, producing abnormal Q waves. When RBBB and an infarct occur together, a combination of these patterns is seen: The QRS complex is abnormally wide (0.12 sec or more) as a result of the bundle branch block, lead V1 shows a terminal positive deflection, and lead V6 shows a wide S wave. If the infarction is anterior, the ECG shows a loss of R wave progression with abnormal Q waves in the anterior leads and characteristic ST-T changes. If the infarction is inferior, pathologic Q waves and ST-T changes are seen in leads II, III, and aVF. (An anterior wall infarction with a RBBB pattern is shown in Fig. 8-20.)
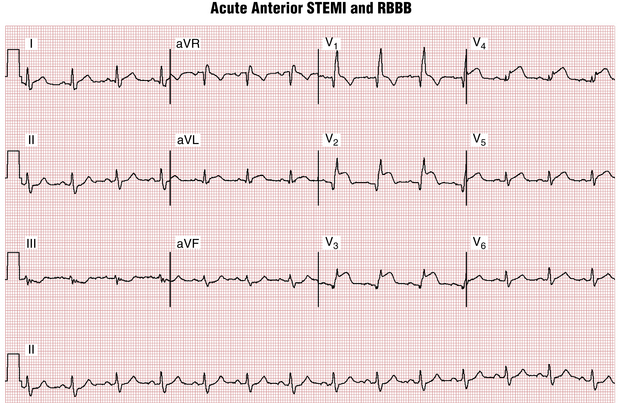
Figure 8-20 Acute anterior wall ST segment elevation myocardial infarction (STEMI) and right bundle branch block (RBBB). The wide QRS (about 120 msec) complexes with terminal R waves in leads V1 and V2 and a prominent S wave in lead V5 indicate the presence of RBBB. The concomitant pattern of acute anterior myocardial infarction (MI) is indicated by the ST segment elevations in leads V1 to V4 (also slightly in leads I and aVL) and Q waves in leads V1 to V3. Reciprocal ST depressions are seen in the inferior limb leads. Borderline left axis deviation is present. This combination points to a very proximal occlusion of the left anterior descending artery, with a large amount of ischemic/infracting myocardium. This finding indicates increased risk of abrupt high-degree atrioventricular (AV) heart block with infranodal conduction block (see Chapter 17).
(Used with permission from Nathanson LA, McClennen S, Safran C, Goldberger AL: ECG Wave-Maven: Self-Assessment Program for Students and Clinicians. http://ecg.bidmc.harvard.edu.)
Left Bundle Branch Block with Myocardial Infarction
The diagnosis of LBBB in the presence of MI is considerably more complicated and confusing than that of RBBB. The reason is that LBBB interrupts both the early and the late phases of ventricular stimulation (see Chapter 7). It also produces secondary ST-T changes. As a general rule, LBBB hides the diagnosis of an infarct. Thus a patient with a chronic LBBB pattern who develops an acute MI may not show the characteristic changes of infarction described in this chapter.
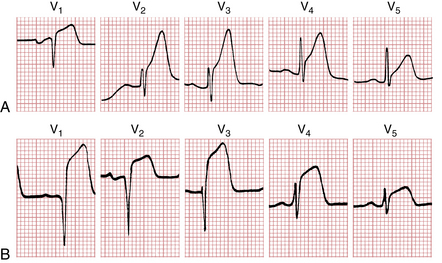
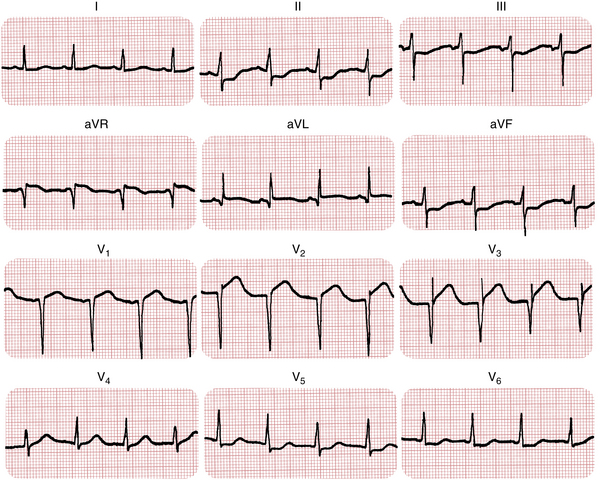
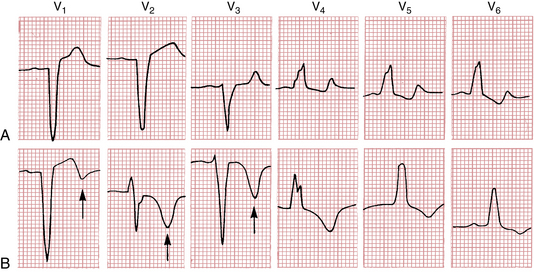
Occasionally, patients with LBBB manifest primary ST-T changes indicative of ischemia or actual infarction. The secondary T wave inversions of uncomplicated LBBB are seen in leads V4 to V6 (with prominent R waves). The appearance of T wave inversions in leads V1 to V3 (with prominent S waves) is a primary abnormality that cannot be ascribed to the bundle branch block itself (Fig. 8-21).
The problem of diagnosing infarction with LBBB is further complicated by the fact that the LBBB pattern has several features that resemble those seen with infarction. Thus an LBBB pattern can mimic an infarct pattern. As discussed in Chapter 7, LBBB typically shows slow R wave progression in the chest leads because of the reversed way the ventricular septum is activated (i.e., from right to left, the opposite of what happens normally). Consequently, with LBBB a loss of the normal septal R waves is seen in the right chest leads. This loss of normal R wave progression simulates the pattern seen with an anterior wall infarct.
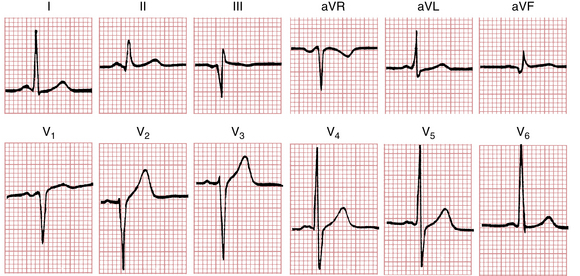
Figure 7-5 shows an example of LBBB with slow R wave progression. In this case, anterior wall infarction was not present. Notice that the ST segment elevations in the right chest leads resemble the pattern seen during the hyperacute or acute phase of an infarction. ST segment elevation in the right chest leads is also commonly seen with LBBB in the absence of infarction.
As a general rule, a patient with an LBBB pattern should not be diagnosed as having had an MI simply on the basis of poor R wave progression in the right chest leads or ST elevations in those leads. However, the presence of Q waves as part of QR complexes in the left chest leads (V5 and V6) with LBBB generally indicates an underlying MI (Fig. 8-22). In addition, the appearance of ST segment elevations in the left chest leads or in other leads with prominent R waves suggests ischemia (see Fig. 8-22, lead V5), as do ST segment depressions in the right leads or other leads with an rS or a QS morphology. (The discussion of the ECG with ischemia and infarction continues in Chapter 9, which focuses on subendocardial ischemia and non–Q wave MI patterns.)