[level-membership-for-radiology-category]Chapter 17
 Microbubble Ultrasound Contrast Agents
Background
The principle of ultrasound microbubble contrast agents is based on the peculiar augmentation of echo strength by small bubbles of gas. Unlike other imaging modalities, the majority of which have benefited from contrast-enhancing agents for many years, contrast enhancement in ultrasound was developed relatively recently. The phenomenon of gas-induced ultrasound contrast was first observed when during echocardiography an injection of indocyanine green through a catheter resulted in transient echo enhancement in the region of the catheter tip.1 This observed enhancement was the result of small air bubbles forming in the catheter tip and strongly scattering ultrasound energy back towards the transducer. Following this there has been progress in understanding the physics of ultrasound contrast enhancement and applying it to the development of encapsulated microbubble agents and imaging technologies for clinical use.
Characteristics of Microbubble Ultrasound Contrast
Ultrasound contrast agents in current use are typically small (3–5 μm diameter) gas-filled bubbles, which are slightly smaller than an erythrocyte (Fig. 17-1). Microbubble contrast agents are physiologically inert, non-toxic and pass through the pulmonary circulation following intravenous injection. The microbubbles contain either air or an inert gas, encapsulated either by a thin shell composed of a biocompatible material such as a lipid, protein or more recently, synthetic polymer.
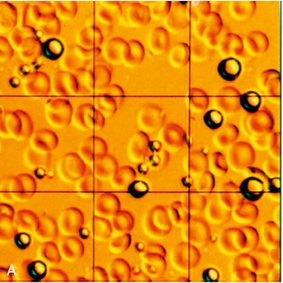
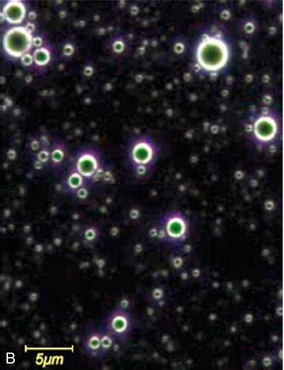
FIGURE 17-1 Contrast agents for ultrasound. (A) Perfluoropropane bubbles with a protein shell (Optison™), seen here against a background of red blood cells. (B) Lipid-coated microbubbles of perfluoropropane gas (Definity™) are seen under a dark field microscope.
The intense echo enhancement observed with microbubbles is a result of the high compressibility of the gas they contain. A microbubble undergoes volumetric oscillation while being insonated, to a greater degree than a rigid sphere of similar size, and consequently scatters more energy. In addition there is a fortuitous relationship between the size of microbubble that is able to pass through a capillary and that which will resonate at the frequencies typically used in general ultrasound imaging (3–5 MHz).2 As such, at the resonant frequency, the returning echoes from a microbubble are maximised in such an effective manner that these microbubbles behave as though they are many orders of magnitude larger than their actual physical size.
When microbubbles are forced by the ultrasound imaging beam into resonant oscillation, they exhibit nonlinear motion, much as does the string of a musical instrument when plucked or struck. This results in the generation of harmonics in the ultrasound echoes, analogous to the overtones produced by a musical instrument. Just as these give the instrument its particular recognizable timbre when playing the same note, so the harmonic echoes from bubbles contain a characteristic pattern of frequencies that allows them to be distinguished from those of tissue, even though they arise from the same ultrasound beam. Ultimately, as acoustic power is increased physical disruption of the microbubbles begins to occur, producing echoes at fractions of harmonic intervals which can also be identified by the receiving instrument. The disruption of bubbles may be used to therapeutic advantage, such as drug delivery and cell membrane poration.3
Safety of Microbubble Contrast
Concern over potential bio-effects associated with the use of ultrasound contrast agents has led to many experimental studies assessing whether the presence of microbubbles can act as cavitation seeds, thereby potentiating bio-effects. This has been reviewed by ter Haar4 and by the World Federation for Ultrasound in Medicine and Biology.5,6 Although it has been shown that adding contrast agents to blood decreases the threshold for cavitation and related bio-effects (e.g., haemolysis, platelet destruction), no significant effects have been reported in circumstances that are comparable to the bubble concentrations and ultrasound exposure used in a low Mechanical Index (MI) diagnostic clinical examination. Nonetheless, it remains prudent to apply the ALARA (As Low As Reasonably Achievable) exposure principle to contrast ultrasound examinations by using the lowest MI, the shortest acoustic exposure time, the lowest contrast agent dose and the highest ultrasound frequency that is consistent with obtaining adequate diagnostic information.
At least 5 million injections of microbubble contrast for clinical diagnosis have been performed worldwide. These injections are very well tolerated and have an excellent safety record, with post-market surveillance suggesting that the predominant cause of severe adverse events is an anaphylactoid reaction, with an estimated rate of 1 in 7000 for both the perflutren microspheres approved for cardiac indications in the United States6 and the sulphur hexafluoride microspheres approved in Europe.7 This level of adverse events is comparable to that of most analgesics and antibiotics and lower than that for other imaging contrast agents, such as those used in CT imaging.8 A study by the Italian Society for Ultrasound in Medicine and Biology of more than 23 000 injections of a sulphur hexafluoride microsphere showed no deaths and two serious adverse events, giving a serious adverse event rate of less than 1:10 000.7
Although there is currently no Food and Drug Administration (FDA)-approved radiologic indication in the United States, there is extensive experience with ultrasound contrast in echo-cardiology. A review of more than 18 671 hospitalised patients undergoing echocardiography in an acute setting in a single centre reported no effect on mortality from using contrast in this group.9 Furthermore, an analysis of registry data from 4 300 966 consecutive patients who underwent transthoracic echocardiography at rest during hospitalisation showed that 58 254 of these patients were given the contrast agent Definity™.10 Acute, crude mortality was no different between groups, but closer analysis revealed that in patients undergoing echocardiography, those receiving the contrast agent were 24% less likely to die within 1 day compared with patients not receiving contrast. Nonetheless, after four deaths of acutely ill cardiac patients, North American labelling currently advises caution when using microbubble agents in patients with severe cardiopulmonary compromise.11 At least one contrast agent is currently undergoing clinical development in the United States and seeking the first FDA approval for a radiologic indication in the USA.
Commercially Available Contrast Agents
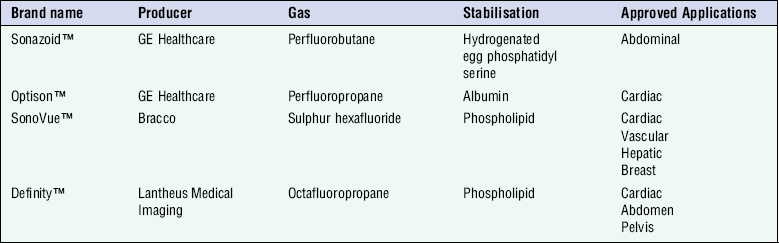
The need to form biologically and physically stable microbubbles in commercial quantities in a simple, cost-effective fashion has led to the development of a variety of microbubble technologies. At the time of writing, commercially available contrast agents approved for intravenous administration include the agents listed in Table 17-1, the majority of experience and data are derived from studies employing Sonovue™ in Europe and Asia, Definity™ in North America and Sonazoid™ in Japan.
Optison™ uses perfluoropropane gas which has slow diffusion into and low solubility in blood, extending the life of the agent. Excretion of the gas is ultimately through the lungs. Albumin provides the soft shell of the microbubble for which the only licensed clinical indication is cardiac imaging.
SonoVue™ consists of sulphur hexafluoride encased by a phospholipid. The microbubbles are prepared by mixing the provided carrier fluid and freeze dried powder. Once prepared, the bubbles remain stable in the vial for several hours. The stability of this formulation in vivo allows real time imaging to occur for several minutes following administration. Licensed clinical indications for use of this agent include cardiac, macrovascular, liver and breast applications.
Definity™ is licensed in the United States for cardiac use and comprises lipid-stabilised octafluoropropane gas. The indications include opacification of the cardiac chambers and improved delineation of the endocardial borders; in Canada, Definity™ is additionally approved for radiological applications in the abdomen and pelvis.
Sonazoid™ is a lipid-stabilised perfluorobutane microbubble that allows both continuous vascular and late-phase Kupffer cell imaging.12 First licensed for use in Japan, it is envisaged that Sonazoid™ will be increasingly employed in the field of focal hepatic lesion detection and follow up post hepatic radio-frequency ablation.
Ultrasound Technologies Used in Contrast Imaging
HARMONIC IMAGING
One simple method to distinguish bubbles from tissue is to excite the bubbles so as to produce harmonics and then detect these in preference to the fundamental frequency echo from tissue (Fig. 17-2A). Key factors in the harmonic response of an agent are the incident pressure of the ultrasound field, the frequency, the size distribution of the bubbles, and the mechanical properties of the bubble capsule – a stiff capsule will dampen oscillations and attenuate the nonlinear response. Although simple and effective, this method halves the bandwidth of the image, reducing its resolution and can be confounded by the propagation of a second ‘tissue’ harmonic echo which results from nonlinear propagation of ultrasound by non-bubble bearing structures, so reducing the image contrast. It is rarely used in modern systems.
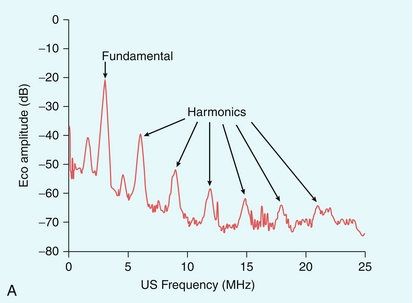
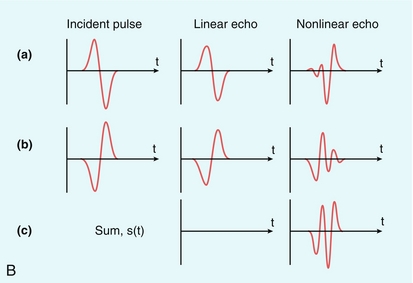
FIGURE 17-2 (A) Harmonic emission from microbubbles. Microbubbles are insonated at 3 MHz and the echo analysed for its frequency content. The largest peak of the energy in the echo is at the 3 MHz fundamental, but that there are clear secondary peaks in the spectrum at 6, 9, 12, 15 and 18 MHz, as well as peaks between these harmonics (‘ultra-harmonics’) and below the fundamental (the ‘sub-harmonic’). Harmonic imaging and Doppler aim to separate and process the second harmonic echo only, which is about 18 dB less than that of the fundamental echo signal. (B) Principle of Pulse Inversion Imaging. A pulse of sound (a) is transmitted into the body and echoes are received from agent and tissue. A second pulse (b), which is an inverted copy of the first, is then transmitted in the same direction and the two resulting echoes summed. Linear echoes from tissue are inverted copies of each other and cancel to zero (c, middle). Microbubble echoes are distorted copies of each other, so that the even nonlinear components of these echoes reinforce each other when summed, producing a strong harmonic signal (c, right side).
PHASE INVERSION IMAGING
Phase or pulse inversion imaging (PII) achieves a better differentiation between bubbles and tissue without loss of resolution.13 PII involves transmission of an initial imaging pulse followed by a second pulse which is an inverted version of the first. The two resulting echoes are then summed: if they are scattered from a linear target, this sum is zero. However, because microbubbles produce non-linear scatter, the sum of the two signals from a microbubble will not be zero (Fig. 17-2B). In addition to allowing a wider bandwidth to be used than in harmonic imaging, PII also allows relatively low insonation pressures (low MI) which reduces the risk of microbubble disruption. This technique allows for continuous real time imaging during vascular phases, allowing detection of vascular patterns peculiar to different liver tumours. Inclusion of a third pulse of lower amplitude than the other two pulses allows detection of nonlinear echoes at the fundamental frequency, which improves penetration of the contrast image. This method is sometimes called ‘power modulation pulse inversion’ (PMPI) or ‘contrast pulse sequence’ (CPS).14
QUANTIFICATION TECHNIQUES
Quantification of microbubbles is complicated by the fact that there is no simple unit of quantification of the contrast echo which can be measured reliably and reproducibly. Furthermore, contrast imaging using the multi-pulse sequences such as PMPI and CPS described above are subject to multiple artifacts including motion artifact from patient or operator movement which can be difficult to avoid in long examinations. Initial work in the field of quantification of microbubbles focused on assessment of a number of variables including time to arrival, wash-in/wash-out characteristics, time to peak and the area under the curve (Fig. 17-3). With advances in technology, quantification techniques have progressed to allow microbubbles to be used for true, functional imaging in the form of dynamic contrast-enhanced ultrasound (DCE-US). Unlike other functional imaging techniques, DCE-US avoids the need for ionising radiation and so may be used repeatedly to monitor, for example, tumour response to treatment.15
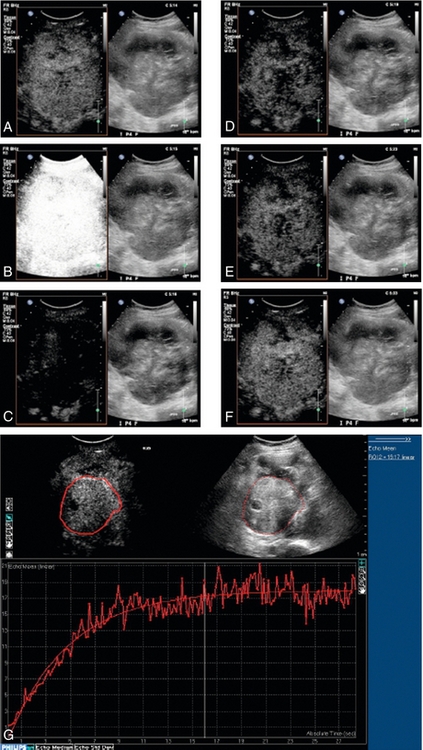
FIGURE 17-3 Dynamic contrast-enhanced ultrasound (DCE-US). Disruption-replenishment imaging used to quantify flow in a renal cell carcinoma in a patient undergoing anti-angiogenic treatment. A sequence of side-by-side contrast images (conventional on right, simultaneous CEUS on left) of a large renal cell carcinoma is made during a steady intravenous infusion of the agent Definity™. (A) t = –1 sec, the tumour is enhanced. (B) t = 0 sec, a brief, high MI ‘flash’ disrupts bubbles within the scan plane. (C) t = 1 sec, new bubbles begin to wash in to the scan plane. (D-F) t = 4 sec, 8 sec and 18 sec after flash, the scan plane is fully replenished. (G) Off-line analysis software measures wash-in for a region-of-interest from the cine-loop record in a similar case. The steeper the slope, the greater the flow rate; the higher the plateau, the greater the vascular volume. Disruption-replenishment imaging thus allows quantitation of tumour flow and total vascular volume.
Artifacts
Artifacts occur predominantly with the older high MI imaging techniques.16 One of the most commonly seen artifacts when using microbubbles to enhance conventional Doppler studies is that of ‘blooming’ in which colour pixels appear to extend beyond the bounds of the vessel (Fig. 17-4). This phenomenon may prove problematic when objective computer analysis of contrast enhancement is required. While the problem arises partly from multiple re-reflections between adjacent microbubbles, it is also in part due to limitations of the hardware analysis of the Doppler signal.
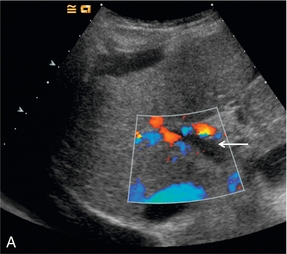
FIGURE 17-4 A commonly seen artifact when using microbubbles is ‘blooming’ in which colour pixels appear to extend beyond the bounds of the vessel. (A) Baseline colour Doppler image at the level of the porta hepatis demonstrating absence of colour signal in the portal vein (arrow) but colour is present in the overlying hepatic artery. (B) Following the administration of SonoVue™ ‘blooming’ from the hepatic artery obscures the portal vein.
Clinical Applications of Microbubble Contrast
CARDIAC
Echocardiography
Patient factors including obesity and lung disease render a significant number of echocardiograms non-diagnostic, particularly in the case of stress echocardiography. Microbubble contrast agents allow improved delineation of the endocardial border and detection of wall motion abnormalities, as a result, up to 74% of otherwise non-diagnostic studies may be ‘rescued’.17 Use of microbubbles allows additional information regarding regional and global left ventricular function to be acquired during a stress echocardiography examination. Furthermore, valvular disease may be more accurately assessed by contrast-enhanced Doppler.
Myocardial Perfusion
Assessment of myocardial perfusion offers potential for the diagnosis of acute myocardial infarction, as well as assessing perfusion during stress testing. The combination of the more robust microbubbles with low MI techniques allows a more comprehensive myocardial assessment. Furthermore, the application of intermittent high-power pulses to destroy the microbubbles allows assessment of the rate of refilling of the myocardial micro-circulation, so providing a measure of micro-circulation perfusion. Studies indicate contrast echocardiography to be highly sensitive for the detection of acute coronary syndrome offering the hope of rapid bedside diagnosis and treatment for this life-threatening condition.18
LIVER
Unenhanced ultrasound is the first-line investigation of liver disease but continues to be perceived as less accurate in terms of detection and staging of focal lesions when compared to contrast-enhanced CT or MR imaging. Nearly all the ultrasound contrast agents available have been used to study liver lesions, consequently much of our understanding regarding in vivo behaviour has been gained from studies of liver abnormalities.19
Focal Liver Lesions
For focal liver lesions, the important aspects of the examination are the detection and then characterisation of lesions into benign and malignant abnormalities. Real-time low MI microbubble imaging is analogous to the phases seen with contrast-enhanced CT, except imaging with microbubbles is in real-time and repeatable. Microbubble ultrasound contrast displays an early (arterial) phase at around 10 to 35 seconds post intravenous administration, followed by a portal venous phase at approximately 30 to 120 seconds (Fig. 17-5). Depending on the formulation of the microbubble contrast agent there may then be a liver-specific phase as the microbubbles are taken up within the Kupffer cells.20
FIGURE 17-5 Characterisation of focal liver lesions is based on the dual blood supply of hepatic artery and the portal vein, with three overlapping vascular phases defined: arterial phase 10–35 seconds (blue line, lesion vascularity), portal-venous phase 30–120 seconds (red line, information on wash-out) and late phase > 120 seconds (green line, sinusoid pooling or cell uptake). Microbubbles disappear 240–360 seconds after injection.
Initial studies employing the high mechanical index imaging technique of stimulated acoustic emission (SAE) showed the potential of microbubbles to improve the detection of liver lesions but this has now been superseded by nonlinear techniques with low MI.21 Imaging of a focal liver lesion during different vascular phases provides clues to the identity of the lesion with good correlation between the findings on microbubble contrast-enhanced ultrasound and CT or MR imaging.22
Current practice when characterising hepatic lesions is as follows: the liver lesion is identified with B-mode imaging then, with the transducer held stationary over the lesion, continuous imaging is performed for 180 seconds after injection of a bolus of microbubble contrast (followed by a saline flush) via a peripheral vein. Using this technique nearly all benign focal hepatic lesions can be confidently characterised, thus negating the need for the patient to proceed to more expensive, time-consuming and potentially harmful investigations.23 There is a growing body of evidence to assist the practitioner when performing such liver lesion characterisation, with pathways firmly established.23,24
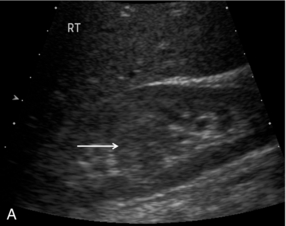
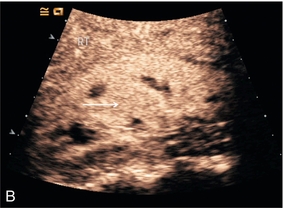
Haemangiomas typically display progressive enhancement from the periphery of the lesion, mirroring that seen on CT and MR imaging (Fig. 17-6).
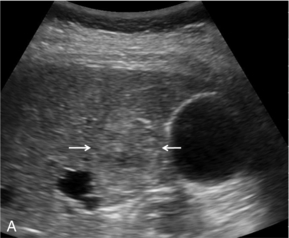
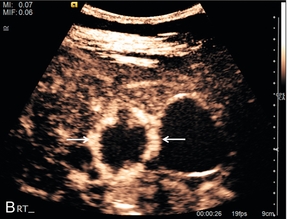
FIGURE 17-6 A haemangioma shows progressive enhancement from the periphery of the lesion. (A) Baseline image of an atypical focal liver lesion (arrows). (B) Microbubble-enhanced image in the late phase demonstrates ‘creeping’ enhancement from the periphery (arrows) typical of a haemangioma.
Focal nodular hyperplasia, a benign vascular anomaly, tends to enhance strongly with microbubble contrast, demonstrating a characteristic central hyper-enhancing ‘star’, often with a non-enhancing central scar (Fig. 17-7).
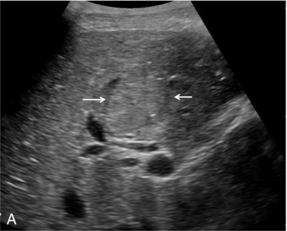
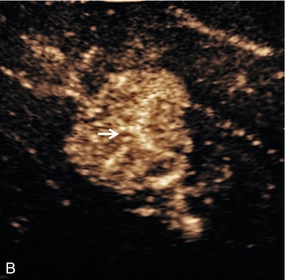
FIGURE 17-7 Focal nodular hyperplasia (FNH). (A) Baseline image of an iso-reflective focal liver lesion (arrows). (B) Microbubble-enhanced image in the arterial phase demonstrates a ‘spoke-wheel’ pattern of rapid enhancement (arrow) typical of an FNH.
Simple liver abscesses are readily diagnosed on B-mode imaging but if there is diagnostic uncertainty, administration of microbubble contrast shows a rim of increased enhancement with a poorly reflective central area. Occasionally enhancing septa may be seen within the abscess and the surrounding liver segment may show increased enhancement secondary to hyperaemia (Fig. 17-8).
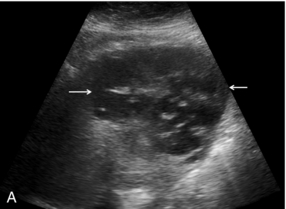
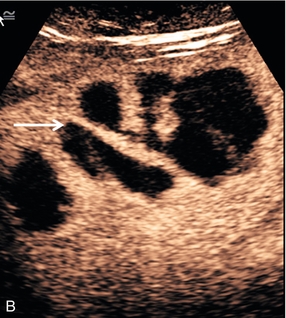
FIGURE 17-8 Liver abscess. (A) Baseline image of a mixed reflective focal liver lesion (arrows). (B) Microbubble-enhanced image in the portal venous phase demonstrates a low reflective ‘liquid’ abscess with septations (arrow) visible.
Differentiating benign from malignant lesions is generally dependent on the ‘wash-out’ of enhancement leaving a ‘black-hole’ in the liver relative to surrounding tissue. As with other imaging modalities the ultrasound characteristics of liver metastases depend on the source of the primary. In general metastases are poorly enhancing in portal-venous and late phases (Fig. 17-9). The early arterial phase may demonstrate either hypervascularity or hypovascularity, but there is still discussion about these features,25 as it is possible that all metastases may demonstrate brief hypervascularity. However, metastases universally ‘wash-out’.26
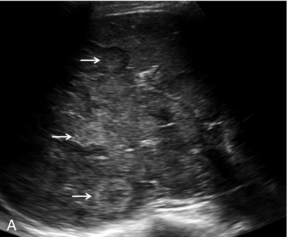
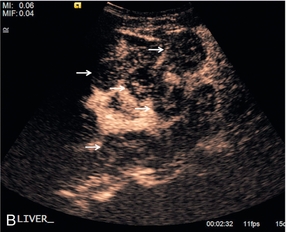
FIGURE 17-9 Malignant lesions washout in the late portal-venous phase to demonstrate the ‘black-holes’ of liver metastases. (A) Baseline image of multiple breast cancer metastases in the right lobe of the liver (arrows). (B) Following administration of microbubble contrast, there is washout at 2 min 32 sec of contrast from the multiple liver lesions (arrows).
Hepato-cellular carcinomas (HCC) can be extremely difficult to identify within a cirrhotic liver on B-mode imaging, thus limiting the effectiveness of surveillance ultrasound imaging in this group of high-risk patients. CEUS may assist in the detection of these tumours although there are no recommendations on guidance for the routine use of CEUS in surveillance ultrasound imaging. With microbubble contrast, HCC tend to be strongly enhancing in the arterial phase (Fig. 17-10), although this is short-lived and imaging of the entire liver in the narrow time window can be difficult. HCC are iso- or hypo-enhancing in the porto-venous phase and hypo-enhancing on delayed imaging.27 An HCC may show some late phase enhancement, depending on the degree of differentiation of the tumour, with the washout prolonged and incomplete.28
Liver Transplantation and Liver Vasculature
Microbubble contrast agents are a useful diagnostic tool for ultrasound imaging in liver transplantation.29
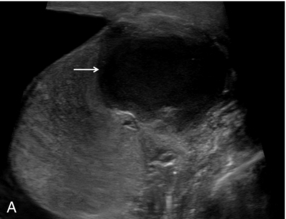
Pre-transplant assessment of the native liver parenchyma and hepatic vasculature is essential but with a cirrhotic, highly attenuating liver, visualisation of the vessels may be problematic. Demonstration of portal vein patency is improved with the use of microbubble contrast (‘Doppler rescue’)30 (Fig. 17-11). If a trans-jugular intra-hepatic portal-systemic shunt (TIPSS) is present and possible occlusion is suspected, the administration of microbubbles will demonstrate low flow that may not be evident on the normal colour Doppler study of the TIPSS.
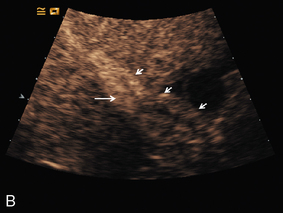
FIGURE 17-11 Confirmation of portal vein patency. (A) No colour flow signal is seen in the portal vein (arrow) despite optimisation of the Doppler parameters. (B) Following CEUS the portal vein is confirmed to be patent (long arrow) with visualisation of a long length of the main hepatic artery (short arrows).
In the post-transplant liver, documentation of the patency of the hepatic artery is paramount since compromise of this vessel may result in bile duct ischaemia, necrosis and bile duct leaks, leading to eventual re-transplantation. If a hepatic artery spectral Doppler trace is not demonstrated using standard Doppler, using microbubble contrast may negate the need for arteriography or CT angiography.31
SPLEEN
The spleen is often a technically difficult organ to visualise adequately on B-mode ultrasound, several conditions within and around the spleen may cause diagnostic confusion. Aside from the assessment of splenic injury, the use of microbubble contrast will enhance the operator’s confidence when assessing focal splenic lesions.32 Splenunculi occur in up to 30% of the population, they may be multiple and can be found at locations remote from the spleen, when they may be mistaken for enlarged lymph nodes, particularly when multiple. Microbubble contrast will accurately demonstrate that the parenchymal enhancement of the splenunculi matches the main spleen and shows a clear vascular hilum.
Focal Splenic Lesions
Simple splenic cysts, either congenital or acquired, rarely cause diagnostic uncertainty. Abscesses in the spleen may have ultrasound appearances ranging from cystic to solid and generally appear avascular on both Doppler ultrasound and microbubble-enhanced ultrasound. Splenic infarction typically occurs in patients with infective endocarditis or myeloproliferative disorders and is often difficult to visualise on initial B-mode ultrasound but may show lack of vascular perfusion on colour Doppler ultrasound and improved conspicuity with the use of CEUS.33
Primary malignant tumours of the spleen, such as lymphoma and angiosarcoma, do occur but they are both rare.34 More common, although still unusual, are metastatic deposits in the spleen. Evidence suggests that malignant splenic disease tends to enhance in the arterial phase, then shows rapid wash out in the delayed phase when compared to adjacent normal spleen.35 The majority of malignant deposits are serosal (causing scalloping of the spleen surface) as opposed to parenchymal, the primary neoplasm is most commonly in the ovary. In cases of known malignant disease within the spleen CEUS may be used to monitor disease response to treatment.
PANCREAS
Whilst CT is the imaging modality for the detection of focal pancreatic lesions, CEUS may be utilised to characterise lesions detected at CT. Adenocarcinoma is the most common primary malignancy of the pancreas and this tends to be hypo-enhancing in all phases when compared to adjacent normal parenchyma.36 In contrast, the highly vascular neuroendocrine tumours tend to hyper-enhance in the arterial phase.37 Cystic pancreatic lesions can present a particular diagnostic challenge with differentiation between mucin-producing tumours, serous cystadenomas and benign or post-inflammatory cysts occasionally being difficult. Improved characterisation of pancreatic lesions has been achieved by combining the high spatial resolution of endoscopic ultrasound with the advantages of CEUS in the form of contrast enhanced endoscopic ultrasound (CE-EUS).38
GASTROINTESTINAL TRACT
The primary use of CEUS in the field of gastroenterology is in the assessment of inflammatory bowel disease, particularly Crohn’s disease. Measurement of bowel wall thickening, luminal narrowing and wall vascularity can diagnose and potentially quantify disease activity, together with the extent of any chronic strictures.39 In addition, some of the complications associated with Crohn’s disease may be assessed with CEUS, including abscess formation and fistula tracks.
RENAL
The main objectives of renal ultrasound are assessment of size, vascular interrogation and exclusion of pelvi-calyceal dilatation. Assessment of renal masses often requires further imaging with CT or MRI. Microbubble contrast administration results in rapid, avid enhancement of the renal cortex within a few seconds, followed by the outer medulla and then gradual filling in of the pyramids. The kidneys of patients with chronic renal impairment generally enhance less avidly and for a shorter period than those with normal renal function.40
Focal Renal Lesions
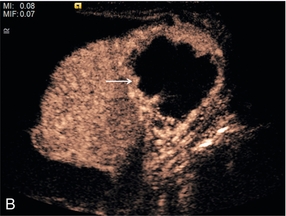
There is now evidence that CEUS is more sensitive than CT in detecting vascularity in hypovascular renal lesions and is as accurate as CT at characterising complex cystic lesions as benign or malignant41 (Fig. 17-12). Renal ‘pseudo-tumours’, such as a prominent column of Bertin, can be difficult to differentiate from real renal masses. CEUS may be of assistance in such cases by confirming or excluding the presence of abnormal vessels and the patency of the renal vein (Fig. 17-13).
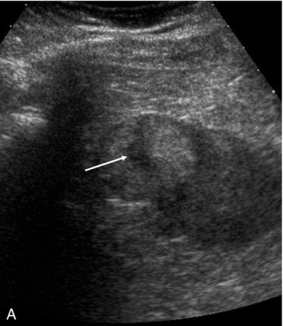
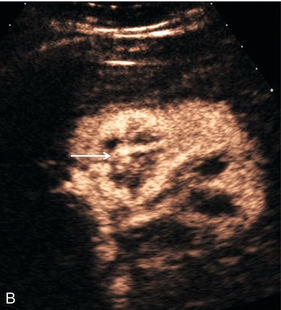
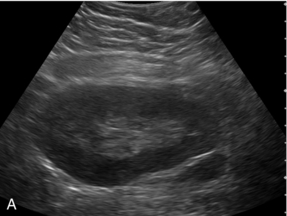
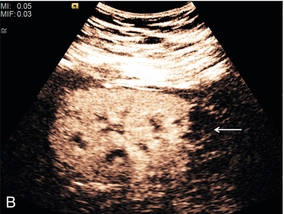
FIGURE 17-12 A renal carcinoma. (A) On the baseline image a complex mass is present at the upper aspect of the left kidney (arrow). (B) Following CEUS abnormal vessels are demonstrated within the tumour (arrow) confirming the malignant nature of the lesion.
Renal Vasculature
Although Doppler ultrasound of the renal arteries is an accepted screening examination for renal artery stenosis, this technique is technically challenging. Problems arise in visualising the entire renal artery, identifying accessory arteries and obtaining accurate spectra due to patient factors and being unable to access a suitable angle on the artery. Microbubble contrast enhancement may overcome some of these problems and increase the success rate of the examination.42 Microbubble contrast is useful in the visualisation of the vessels after renal transplantation. Viability of the transplant is dependent on patency of both the renal artery and vein; microbubble contrast can aid in the diagnosis of renal artery stenosis or renal vein thrombosis, as well as assess the overall perfusion of the transplant and identification of areas of reduced or absent flow43 (Fig. 17-14).
ABDOMINAL TRAUMA
CT remains the modality of choice in poly-trauma but in patients who suffer a site-specific low-energy injury, the radiation burden of a whole-body CT may be difficult to justify and it is often only one or two organs in which injury is suspected, for example the spleen and left kidney with left-flank blunt trauma. CEUS may be used as an adjunct to Focused Assessment with Sonography in Trauma (FAST) to assess the organs in question with studies indicating it to be more sensitive than standard ultrasound in the detection of solid organ injury and almost as sensitive as CT.44 Active hepatic haemorrhage is best visualised in the arterial phase of CEUS imaging, whilst lacerations and haematomas are best seen in the delayed phase, when their lack of enhancement is emphasised by adjacent enhancing parenchyma (Fig. 17-15). The splenic parenchyma generally displays prolonged enhancement which is initially patchy and is then more homogeneous by approximately 40–60 seconds after bolus injection. As in the liver, lacerations of the spleen reveal themselves as linear branching non-enhancing structures whilst sub-capsular haematoma tends to be a curvilinear non-enhancing structure (Fig. 17-16).
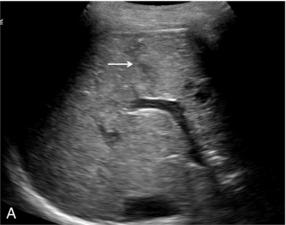
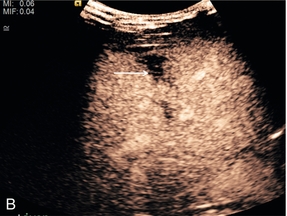
FIGURE 17-15 The subtle abnormality on the B-mode image is seen to be a laceration on the contrast image. (A) An area of reflective inconsistency is seen in the right lobe of the liver (arrow). (B) Following CEUS there is no perfusion of the liver at this site (arrow) demonstrating the presence of a liver laceration.
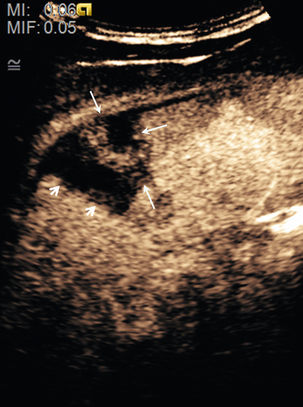
FIGURE 17-16 Splenic laceration: Microbubble contrast enhancement shows no perfusion of the spleen at the site of a laceration (short arrows), with an adjacent area of contusion and haematoma (long arrows) and a thin layer of fluid around the spleen.
Both spleen and kidney enhance avidly with microbubble contrast and therefore the dose used tends to be less than that for liver imaging. The kidneys tend to enhance for a shorter time (approximately 2 minutes) than the spleen.45 As with the spleen and liver, lacerations of the kidneys are generally linear non-enhancing structures whilst complete avulsion of the kidney results in diffusely poorly or non-enhancing renal parenchyma.
Vesico-Ureteric Reflux (VUR)
The standard methods for the investigation of VUR involved ionising radiation. Since the majority of patients are children; this is undesirable and therefore the option of using intra-vesical administration of microbubble contrast is appealing. Early attempts realised the potential for this technique but recognised some of the practical difficulties in the implementation of the method. More recently studies have indicated that the use of microbubbles for the investigation of VUR is a sensitive test and this has now become standard practice in many departments.46
Hystero Contrast Salpingography (HyCoSy)
In the investigation of sub-fertility, Fallopian tube patency has traditionally been established by hysterosalpingography (HSG), a technique requiring both iodinated contrast and irradiation of the pelvic organs. The use of HyCoSy avoids these risks. Instillation of microbubble contrast into the uterine cavity is performed using trans-vaginal ultrasound, the passage of contrast through the Fallopian tubes and spillage into the pelvis may be followed in real time.47 Currently, this may be used as a screening test for tubal patency but it cannot yet provide detailed anatomical delineation of tubal pathology and its positive predictive value for the detection of occluded Fallopian tube remains low.48 Consequently, some would argue that the high negative predictive value of conventional HSG means that this should remain the investigation of choice. Furthermore whilst both HSG and HyCoSy can result in significant patient discomfort some studies have suggested that pain is more common with HyCoSy.49
SCROTUM
Ultrasound is the imaging choice for the testis and is usually sufficient for diagnostic purposes. Occasionally, findings may be equivocal and in such cases CEUS may be of assistance. With small testicular tumours it may be difficult to demonstrate internal vascularity and therefore the lesion could be misinterpreted as benign. CEUS provides operator confidence regarding the true nature of such lesions.50,51 Segmental testicular infarction, trauma to the testis and inflammation may all be demonstrated more effectively through the use of CEUS (Fig. 17-17).52,53
PROSTATE
Whilst trans-rectal ultrasound is routinely used for targeted biopsy of the prostate gland, real time and Doppler US are of limited value in the assessment of prostate tumours with both poor sensitivity and specificity. Low MI endocavity CEUS raises the possibility of improved tumour site detection. Initial data indicate that the technique is of assistance in directing targeted biopsies towards the site of primary tumour but specificity remains a problem; areas of benign hyperplasia may masquerade as malignancy.54
BREAST
Although the superficial nature of breast tissue and the angiogenesis often associated with malignancy should mean that breast tumours would be a suitable subject for interrogation with CEUS, several studies have failed to demonstrate any convincing patterns of enhancement that can reliably differentiate malignant from benign breast lesions.55 Whilst CEUS may not be of benefit in the detection of the primary breast tumour there are hopes that CEUS quantification techniques may assist in assessment of tumour response to treatment. In addition, microbubbles are an effective method for the detection of sentinel lymph nodes prior to surgery.56
Lungs and Pleura
This limited application of CEUS is confined to the assessment of peripheral regions of consolidated or collapsed lung and thickened pleural membranes. Avascular areas of pulmonary infarction resulting from an embolic event may be differentiated from pneumonia and simple collapse.57 In addition, CEUS may be employed when performing targeted biopsy of peripheral lung lesions to distinguish necrotic (and therefore probably non-diagnostic) tissue from vascularised regions of the tumour.
VASCULAR
Trans-Cranial Ultrasound
Assessment of intra-cranial vessels using standard Doppler ultrasound is limited by the severe attenuation of the signal due to the poor temporal bone window (see Chapter 3). Microbubble contrast agents can overcome this problem and allow improved visualisation of these vessels. In one study, CEUS technically improved the images in 77% of patients,58 with the basal arteries of the circle of Willis being adequately depicted in up to 85% of patients.59 Through the use of CEUS and imaging via the foramen magnum, the intra-cranial vertebral arteries, the basilar artery and some of the cerebellar vessels can be imaged more easily.60
Carotid Artery
Microbubble contrast use in the assessment of carotid arteries is focused on three areas. The first is to accurately visualise flow within the carotid artery, a task that is frequently complicated by overlying calcified plaque and vessel tortuosity. In one study, on baseline colour Doppler imaging 21% of vessel stenoses were not identified, compared with only 6% after microbubble contrast.61 The second area is differentiation between vessel occlusion and a high-grade stenosis, a distinction which can be difficult to make with standard colour Doppler but using microbubbles decreases the false-negative rate from 30% to 17%.62 Finally, when MR imaging is contraindicated, CEUS may be employed in the assessment of carotid artery dissection.63 There has also been some interest in the imaging of angiogenesis within plaque with CEUS as a measure of plaque vulnerability.64
Aorta
Patient factors frequently render US imaging of the aorta sub-optimal. CEUS may assist in such situations by improving delineation of the lumen of the aorta, as well as assessment of potential leakage and dissection.65 Endovascular aneurysm repair (EVAR) is now an established technique, although the potential long-term complications remain unknown. Long-term surveillance of these devices with CT imaging carries a significant cumulative radiation dose, therefore the concept of surveillance with CEUS is appealing. Evidence suggests that CEUS surveillance is both safe and effective and in some cases, superior to CT imaging66 (Fig. 17-18).
MUSCULO-SKELETAL
Microbubble contrast is finding applications in the study of articular inflammatory disease. Several studies have shown synovial enhancement in patients with synovial inflammation confirmed with MR imaging.67 Furthermore, CEUS may assist in differentiation between active synovitis and other causes of peri-articular swelling, such as fibrotic pannus and fluid collections, which can be of prognostic value. Adjacent bursae and tendons may also be elegantly demonstrated.68 Microbubbles therefore have a role not only in diagnosis but also in monitoring disease progression and response to therapy.
THERAPY
The currently available microbubbles consist of gas contained within a shell. Potential exists to attach a ‘cargo’ and effectively use the microbubble as a vehicle to transport a therapeutic agent to a specified site. Ultimately this may prove to be a more important application of microbubbles than any of those discussed above. Perhaps the most interesting use would be in the area of gene therapy where the initial hopes of effective treatments have often been limited by lack of suitable delivery mechanisms. Sonoporation, the mechanism by which cell membranes are rendered porous to large molecules by ultrasound, is enhanced in the presence of microbubbles. It has been shown in animal models that this process can deliver gene therapy agents.69 In addition to gene therapy, there are also possibilities for other therapeutic initiatives, including delivery of chemo-therapeutic agents, with the site of delivery being defined by selective microbubble disruption. Evidence suggests this technique could prove particularly effective.70
REFERENCES
1. Gramiak, R., Shah, P. M. Echocardiography of the aortic root. Invest Radiol. 1968; 3:356–366.
2. Stride, E., Saffari, N. Microbubble ultrasound contrast agents: a review. Proc Inst Mech Eng [H]. 2003; 217:429–447.
3. Porter, T. R., Xie, F., Li, S., et al. Increased ultrasound contrast and decreased microbubble destruction rates with triggered ultrasound imaging. J Am Soc Echocardiogr. 1996; 9:599–605.
4. ter Haar, G. Ultrasonic contrast agents: safety considerations reviewed. Eur J Radiol. 2002; 41:217–221.
5. Barnett, S. B., ter Haar, G., Ziskin, M. C., et al. International recommendations and guidelines for the safe use of diagnostic ultrasound in medicine. Ultrasound Med Biol. 2000; 26:355–366.
6. Bouakaz, A., de Jong, N. WFUMB Safety Symposium on Echo-Contrast Agents: nature and types of ultrasound contrast agents. Ultrasound Med Biol. 2007; 33:187–196.
7. Piscaglia, F., Bolondi, L. The safety of SonoVue in abdominal applications: retrospective analysis of 23188 investigations. Ultrasound Med Biol. 2006; 32:1369–1375.
8. International Collaborative Study of Severe Anaphylaxis. Risk of anaphylaxis in a hospital population in relation to the use of various drugs: an international study. Pharmacoepidemiol Drug Saf. 2003; 12:195–202.
9. Kusnetzky, L. L., Khalid, A., Khumri, T. M., et al. Acute mortality in hospitalized patients undergoing echocardiography with and without an ultrasound contrast agent. Results in 18,671 consecutive studies. J Am Coll Cardiol. 2008; 51:1704–1706.
10. Main, M. L., Ryan, R. C., Davis, T. E., et al. Acute mortality in hospitalized patients undergoing echocardiography with and without an ultrasound contrast agent: multicentre registry results in 4,300,966 consecutive patients. Am J Cardiol. 2008; 102:1742–1746.
11. Main, M. L. Ultrasound contrast agent safety: from anecdote to evidence. JACC Cardiovasc Imaging. 2009; 2:1057–1059.
12. Edey, A. J., Ryan, S. M., Beese, R. C., et al. Ultrasound imaging of liver metastases in the delayed parenchymal phase following administration of Sonazoid™ using a destructive mode technique (Agent Detection Imaging™). Clin Radiol. 2008; 63:1112–1120.
13. Tiemann, K., Lohmeier, S., Kuntz, S., et al. Real-time contrast echo assessment of myocardial perfusion at low emission power: first experimental and clinical results using power pulse inversion imaging. Echocardiography. 1999; 16:799–809.
14. Eckersley, R. J., Chin, C. T., Burns, P. N. Optimising phase and amplitude modulation schemes for imaging microbubble contrast agents at low acoustic power. Ultrasound Med Biol. 2005; 31:213–219.
15. Leen, E., Averkiou, M., Arditi, M., et al. Dynamic contrast enhanced ultrasound assessment of the vascular effects of novel therapeutics in early stage trials. Eur Radiol. 2012; 1:10–12.
16. Forsberg, F., Liu, J. B., Burns, P. N., et al. Artifact in ultrasonic contrast agents studies. J Ultrasound Med. 1994; 13:357–365.
17. Nihoyannopoulos, P. Contrast echocardiography. Clin Radiol. 1996; 51:28–30.
18. Senior, R., Becher, H., Monaghan, M. J., et al. Contrast echocardiography: evidence-based recommendations by European Association of Echocardiography. Eur J Echocardiogr. 2009; 10:194–212.
19. Wilson, S. R., Burns, P. N. Microbubble-enhanced US in body imaging: What role? Radiology. 2010; 257:24–39.
20. Forsberg, F., Goldberg, B. B., Liu, J. B., et al. Tissue-specific US contrast agent for evaluation of hepatic and splenic parenchyma. Radiology. 1999; 210:125–132.
21. Blomley, M. J. K., Albrecht, T., Wilson, S. R., et al. Improved detection of metastatic liver lesions using pulse inversion harmonic imaging with Levovist: a multicentre study. Radiology. 1999; 213:491.
22. Burns, P. N., Wilson, S. R. Focal liver masses: enhancement patterns on contrast-enhanced images–concordance of US scans with CT scans and MR images. Radiology. 2007; 242:162–174.
23. Wilson, S. R., Burns, P. N. An algorithm for the diagnosis of focal liver masses using microbubble contrast enhanced pulse inversion sonography. AJR Am J Roentgenol. 2006; 186:1401–1412.
24. Claudon, M., Cosgrove, D., Albrecht, T., et al. Guidelines and good clinical practice recommendations for contrast enhanced ultrasound (CEUS) – update 2008. Ultraschall Med. 2008; 29:28–44.
25. Murphy-Lavallee, J., Jang, H. J., Kim, T. K., et al. Are metastases really hypovascular in the arterial phase? The perspective based on contrast-enhanced ultrasonography. J Ultrasound Med. 2007; 26:1545–1556.
26. Bhayana, D., Kim, T. K., Jang, H. J., et al. Hypervascular liver masses on contrast-enhanced ultrasound: the importance of washout. AJR Am J Roentgenol. 2010; 194:977–983.
27. Nicolau, C., Vilana, R., Bru, C. The use of contrast-enhanced ultrasound in the management of the cirrhotic patient and for the detection of HCC. Eur Radiol. 2004; 14:P63–P71.
28. Claudon, M., Cosgrove, D., Albrecht, T., et al. Guidelines and Good Clinical Practice Recommendations for Contrast Enhanced Ultrasound (CEUS) – Update 2008. Ultraschall Med. 2008; 29:28–44.
29. Berry, J. D., Sidhu, P. S. Microbubble contrast-enhanced ultrasound in liver transplantation. Eur Radiol. 2004; 14:P96–P103.
30. Marshall, M. M., Beese, R. C., Muiesan, P., et al. Assessment of portal venous patency in the liver transplant candidate: a prospective study comparing ultrasound, microbubble-enhanced colour Doppler ultrasound with arteriography and surgery. Clin Radiol. 2002; 57:377–383.
31. Sidhu, P. S., Shaw, A. S., Ellis, S. M., et al. Microbubble ultrasound contrast in the assessment of hepatic artery patency following liver transplantation: role in reducing frequency of hepatic artery arteriography. Eur Radiol. 2004; 14:21–30.
32. Peddu, P., Shah, M., Sidhu, P. S. Splenic abnormalities: a comparative review of ultrasound, microbubble enhanced ultrasound and computed tomography. Clin Radiol. 2004; 59:777–792.
33. Gorg, C., Bert, T. Contrast enhanced sonography of focal splenic lesions with a second generation contrast agent. Ultraschall Med. 2005; 26:470–477.
34. von Herbay, A., Barreiros, A. P., Ignee, A., et al. Contrast-enhanced ultrasonography with SonoVue: differentiation between benign and malignant lesions of the spleen. J Ultrasound Med. 2009; 28:421–434.
35. Yu, X., Yu, J., Liang, P., et al. Real-time contrast-enhanced ultrasound in diagnosing of focal spleen lesion. Eur J Radiol. 2012; 81:430–436.
36. Numata, K., Ozawa, Y., Kobayashi, N., et al. Contrast-enhanced sonography of pancreatic carcinoma; correlations with pathological findings. J Gastroenterol. 2005; 40:631–640.
37. Dietrich, C. F., Braden, B., Hocke, M., et al. Improved characterisation of solitary pancreatic tumours using contrast enhanced transabdominal ultrasound. J Cancer Res Clin Oncol. 2008; 134:635–643.
38. Dietrich, C. F. Contrast-enhanced low mechanical index endoscopic ultrasound (CELMI-EUS). Endoscopy. 2009; 41:E43–E45.
39. Ripolles, T., Martinez, M. J., Paredes, J. M., et al. Crohn disease: correlation of findings at contrast-enhanced US with severity at endoscopy. Radiology. 2009; 253:241–248.
40. Correas, J. M., Claudon, M., Tranquart, F., et al. The kidney: imaging with microbubble contrast agents. Ultrasound Q. 2006; 22:53–66.
41. Quaia, E., Bertolotto, M., Cioffi, V., et al. Comparison of contrast-enhanced sonography with unenhanced sonography and contrast-enhanced CT in the diagnosis of malignancy in complex cystic renal masses. AJR Am J Roentgenol. 2008; 191:1239–1249.
42. Claudon, M., Plouin, P. F., Baxter, G. M., et al. Renal arteries in patients at risk of renal arterial stenosis: multicentre evaluation of the Echo-enhancer SH U 508A at color and spectral Doppler US. Radiology. 2000; 214:737–746.
43. Harvey, C. J., Sidhu, P. S. Ultrasound contrast agents in genito-urinary imaging. Ultrasound Clin North Am. 2011; 5:489–506.
44. Catalano, O., Aiani, L., Barozzi, L., et al. CEUS in abdominal trauma: multi-centre study. Abdom Imaging. 2009; 34:225–234.
45. Piscaglia, F., Nolsøe, C., Dietrich, C., et al. The EFSUMB Guidelines and Recommendations on the Clinical Practice of Contrast Enhanced Ultrasound (CEUS). Update 2011 on non-hepatic applications. Ultraschall Med. 2012; 32:33–59.
46. Darge, K. Voiding urosonography with US contrast agents for the diagnosis of vesicureteric reflux in children. II. Comparison with radiological examinations. Pediatr Radiol. 2008; 38:54–63.
47. Ayida, G., Harris, P., Kennedy, S., et al. Hysterosalpingo-contrast sonography (HyCoSy) using Echovist-200 in the outpatient investigation of infertility patients. Br J Radiol. 1996; 69:910–913.
48. Lanzani, C., Savasi, V., Leone, F. P., et al. Two-dimensional HyCoSy with contrast tuned imaging technology and a second generation contrast media for the assessment of tubal patency in an infertility program. Fertil-Steril. 2009; 92:1158–1161.
49. Stacey, C., Brown, C., Manhire, A., et al. HyCoSy – as good as claimed? Br J Radiol. 2000; 73:133–136.
50. Lock, G., Schmidt, C., Helmich, F., et al. Early experience with contrast enhanced ultrasound in the diagnosis of testicular masses; a feasibility study. Urology. 2011; 77:1049–1053.
51. Patel, K., Sellars, M. E., Clarke, J. L., et al. Features of testicular epidermoid cysts on contrast enhanced ultrasound and real time elastography. J Ultrasound Med. 2012; 31:1115–1122.
52. Bertolotto, M., Derchi, L. E., Sidhu, P. S., et al. Acute segmental testicular infarction at contrast-enhanced ultrasound: early features and changes during follow-up. AJR Am J Roentgenol. 2011; 196:834–841.
53. Lung, P. F., Jaffer, O. S., Sellars, M. E., et al. Contrast enhanced ultrasound (CEUS) in the evaluation of focal testicular complications secondary to epidiymitis. AJR Am J Roentgenol. 2012; 199:W345–W354.
54. Strazdina, A., Krumina, G., Sperga, M. The value and limitations of contrast-enhanced ultrasound in detection of prostate cancer. Anticancer Res. 2011; 31:1421–1426.
55. Sorelli, P. G., Cosgrove, D. O., Svensson, W. E., et al. Can contrast-enhanced sonography distingush benign from malignant breast masses. J Clin Ultrasound. 2010; 38:177–181.
56. Sever, A. R., Mills, P., Jones, S. E., et al. Preoperative sentinel node identification with ultrasound using microbubbles in patients with breast cancer. AJR Am J Roentgenol. 2011; 196:251–256.
57. Gorg, C. Transcutaneous contrast-enhanced sonography of pleural-based pulmonary lesions. Eur J Radiol. 2007; 64:213–221.
58. Otis, S. M., Rush, M., Boyajian, R. Contrast-enhanced transcranial imaging. Results of an American phase-two study. Stroke. 1995; 26:203–209.
59. Postert, T., Braun, B., Meves, S., et al. Contrast-enhanced transcranial color-coded sonography in acute hemispheric brain infarction. Stroke. 1999; 30:1819–1826.
60. Seidel, G., Kaps, M. Harmonic imaging of the vertebrobasilar system. Stroke. 1997; 28:1610–1613.
61. Sitzer, M., Rose, G., Furst, G., et al. Characteristics and clinical value of an intravenous echo-enhancement agent in evaluation of high-grade internal carotid stenosis. J Neuroimaging. 1997; 7:S22–S25.
62. Furst, G., Saleh, A., Wenserski, F., et al. Reliability and validity of noninvasive imaging of internal carotid artery pseudo-occlusion. Stroke. 1999; 30:1444–1449.
63. Clevert, D. A., Sommer, W. H., Zengel, P., et al. Imaging of carotid arterial diseases with contrast-enhanced ultrasound (CEUS). Eur J Radiol. 2011; 80:68–76.
64. Shalhoub, J., Owen, D. R. J., Gauthier, T., et al. The use of contrast enhanced ultrasound in carotid arterial disease. Eur J Vasc Endovasc Surg. 2010; 39:381–387.
65. Clevert, D. A., Stickel, M., Johnson, T., et al. Imaging of aortic abnormalities with contrast-enhanced ultrasound. A pictorial comparison with CT. Eur Radiol. 2007; 17:2991–3000.
66. Clevert, D. A., Sommer, W. H., Meimerakis, G., et al. Contrast-enhanced ultrasound compared with multislice computed tomography for endovascular aneurysm repair surveillance. Ultrasound. 2011; 19:11–19.
67. Carotti, M., Salaffi, F., Manganelli, P., et al. Power Doppler sonography in the assessment of synovial tissue of the knee joint in rheumatoid arthritis: a preliminary experience. Ann Rheum Dis. 2002; 61:877–882.
68. Klauser, A. S., Franz, M., Arora, R., et al. Detection of vascularity in wrist tenosynovitis: power Doppler ultrasound compared with contrast-enhanced grey-scale ultrasound. Arthritis Res Ther. 2010; 12:R209.
69. Price, R. J., Skyba, D. M., Kaul, S., et al. Delivery of colloidal particles and red blood cells to tissue through microvessel ruptures created by targeted microbubble destruction with ultrasound. Circulation. 1998; 98:1264–1267.
70. Lentacker, I., Geers, B., Demeester, J., et al. Design and evaluation of doxorubicin-containing microbubbles for ultrasound triggered doxorubicin delivery: cytotoxicity and mechanisms involved. Mol Ther. 2010; 18:101–108.
[/level-membership-for-radiology-category][not-level-membership-for-radiology-category]Chapter 17
Microbubble Ultrasound Contrast Agents
Background
The principle of ultrasound microbubble contrast agents is based on the peculiar augmentation of echo strength by small bubbles of gas. Unlike other imaging modalities, the majority of which have benefited from contrast-enhancing agents for many years, contrast enhancement in ultrasound was developed relatively recently. The phenomenon of gas-induced ultrasound contrast was first observed when during echocardiography an injection of indocyanine green through a catheter resulted in transient echo enhancement in the region of the catheter tip.1 This observed enhancement was the result of small air bubbles forming in the catheter tip and strongly scattering ultrasound energy back towards the transducer. Following this there has been progress in understanding the physics of ultrasound contrast enhancement and applying it to the development of encapsulated microbubble agents and imaging technologies for clinical use.
Characteristics of Microbubble Ultrasound Contrast
Ultrasound contrast agents in current use are typically small (3–5 μm diameter) gas-filled bubbles, which are slightly smaller than an erythrocyte (Fig. 17-1). Microbubble contrast agents are physiologically inert, non-toxic and pass through the pulmonary circulation following intravenous injection. The microbubbles contain either air or an inert gas, encapsulated either by a thin shell composed of a biocompatible material such as a lipid, protein or more recently, synthetic polymer.
FIGURE 17-1 Contrast agents for ultrasound. (A) Perfluoropropane bubbles with a protein shell (Optison™), seen here against a background of red blood cells. (B) Lipid-coated microbubbles of perfluoropropane gas (Definity™) are seen under a dark field microscope.
The intense echo enhancement observed with microbubbles is a result of the high compressibility of the gas they contain. A microbubble undergoes volumetric oscillation while being insonated, to a greater degree than a rigid sphere of similar size, and consequently scatters more energy. In addition there is a fortuitous relationship between the size of microbubble that is able to pass through a capillary and that which will resonate at the frequencies typically used in general ultrasound imaging (3–5 MHz).2 As such, at the resonant frequency, the returning echoes from a microbubble are maximised in such an effective manner that these microbubbles behave as though they are many orders of magnitude larger than their actual physical size.
When microbubbles are forced by the ultrasound imaging beam into resonant oscillation, they exhibit nonlinear motion, much as does the string of a musical instrument when plucked or struck. This results in the generation of harmonics in the ultrasound echoes, analogous to the overtones produced by a musical instrument. Just as these give the instrument its particular recognizable timbre when playing the same note, so the harmonic echoes from bubbles contain a characteristic pattern of frequencies that allows them to be distinguished from those of tissue, even though they arise from the same ultrasound beam. Ultimately, as acoustic power is increased physical disruption of the microbubbles begins to occur, producing echoes at fractions of harmonic intervals which can also be identified by the receiving instrument. The disruption of bubbles may be used to therapeutic advantage, such as drug delivery and cell membrane poration.3
Safety of Microbubble Contrast
Concern over potential bio-effects associated with the use of ultrasound contrast agents has led to many experimental studies assessing whether the presence of microbubbles can act as cavitation seeds, thereby potentiating bio-effects. This has been reviewed by ter Haar4 and by the World Federation for Ultrasound in Medicine and Biology.5,6 Although it has been shown that adding contrast agents to blood decreases the threshold for cavitation and related bio-effects (e.g., haemolysis, platelet destruction), no significant effects have been reported in circumstances that are comparable to the bubble concentrations and ultrasound exposure used in a low Mechanical Index (MI) diagnostic clinical examination. Nonetheless, it remains prudent to apply the ALARA (As Low As Reasonably Achievable) exposure principle to contrast ultrasound examinations by using the lowest MI, the shortest acoustic exposure time, the lowest contrast agent dose and the highest ultrasound frequency that is consistent with obtaining adequate diagnostic information.
At least 5 million injections of microbubble contrast for clinical diagnosis have been performed worldwide. These injections are very well tolerated and have an excellent safety record, with post-market surveillance suggesting that the predominant cause of severe adverse events is an anaphylactoid reaction, with an estimated rate of 1 in 7000 for both the perflutren microspheres approved for cardiac indications in the United States6 and the sulphur hexafluoride microspheres approved in Europe.7 This level of adverse events is comparable to that of most analgesics and antibiotics and lower than that for other imaging contrast agents, such as those used in CT imaging.8 A study by the Italian Society for Ultrasound in Medicine and Biology of more than 23 000 injections of a sulphur hexafluoride microsphere showed no deaths and two serious adverse events, giving a serious adverse event rate of less than 1:10 000.7
Although there is currently no Food and Drug Administration (FDA)-approved radiologic indication in the United States, there is extensive experience with ultrasound contrast in echo-cardiology. A review of more than 18 671 hospitalised patients undergoing echocardiography in an acute setting in a single centre reported no effect on mortality from using contrast in this group.9 Furthermore, an analysis of registry data from 4 300 966 consecutive patients who underwent transthoracic echocardiography at rest during hospitalisation showed that 58 254 of these patients were given the contrast agent Definity™.10 Acute, crude mortality was no different between groups, but closer analysis revealed that in patients undergoing echocardiography, those receiving the contrast agent were 24% less likely to die within 1 day compared with patients not receiving contrast. Nonetheless, after four deaths of acutely ill cardiac patients, North American labelling currently advises caution when using microbubble agents in patients with severe cardiopulmonary compromise.11 At least one contrast agent is currently undergoing clinical development in the United States and seeking the first FDA approval for a radiologic indication in the USA.
Commercially Available Contrast Agents
The need to form biologically and physically stable microbubbles in commercial quantities in a simple, cost-effective fashion has led to the development of a variety of microbubble technologies. At the time of writing, commercially available contrast agents approved for intravenous administration include the agents listed in Table 17-1, the majority of experience and data are derived from studies employing Sonovue™ in Europe and Asia, Definity™ in North America and Sonazoid™ in Japan.
Optison™ uses perfluoropropane gas which has slow diffusion into and low solubility in blood, extending the life of the agent. Excretion of the gas is ultimately through the lungs. Albumin provides the soft shell of the microbubble for which the only licensed clinical indication is cardiac imaging.
SonoVue™ consists of sulphur hexafluoride encased by a phospholipid. The microbubbles are prepared by mixing the provided carrier fluid and freeze dried powder. Once prepared, the bubbles remain stable in the vial for several hours. The stability of this formulation in vivo allows real time imaging to occur for several minutes following administration. Licensed clinical indications for use of this agent include cardiac, macrovascular, liver and breast applications.
Definity™ is licensed in the United States for cardiac use and comprises lipid-stabilised octafluoropropane gas. The indications include opacification of the cardiac chambers and improved delineation of the endocardial borders; in Canada, Definity™ is additionally approved for radiological applications in the abdomen and pelvis.
Sonazoid™ is a lipid-stabilised perfluorobutane microbubble that allows both continuous vascular and late-phase Kupffer cell imaging.12 First licensed for use in Japan, it is envisaged that Sonazoid™ will be increasingly employed in the field of focal hepatic lesion detection and follow up post hepatic radio-frequency ablation.
Ultrasound Technologies Used in Contrast Imaging
HARMONIC IMAGING
One simple method to distinguish bubbles from tissue is to excite the bubbles so as to produce harmonics and then detect these in preference to the fundamental frequency echo from tissue (Fig. 17-2A). Key factors in the harmonic response of an agent are the incident pressure of the ultrasound field, the frequency, the size distribution of the bubbles, and the mechanical properties of the bubble capsule – a stiff capsule will dampen oscillations and attenuate the nonlinear response. Although simple and effective, this method halves the bandwidth of the image, reducing its resolution and can be confounded by the propagation of a second ‘tissue’ harmonic echo which results from nonlinear propagation of ultrasound by non-bubble bearing structures, so reducing the image contrast. It is rarely used in modern systems.
FIGURE 17-2 (A) Harmonic emission from microbubbles. Microbubbles are insonated at 3 MHz and the echo analysed for its frequency content. The largest peak of the energy in the echo is at the 3 MHz fundamental, but that there are clear secondary peaks in the spectrum at 6, 9, 12, 15 and 18 MHz, as well as peaks between these harmonics (‘ultra-harmonics’) and below the fundamental (the ‘sub-harmonic’). Harmonic imaging and Doppler aim to separate and process the second harmonic echo only, which is about 18 dB less than that of the fundamental echo signal. (B) Principle of Pulse Inversion Imaging. A pulse of sound (a) is transmitted into the body and echoes are received from agent and tissue. A second pulse (b), which is an inverted copy of the first, is then transmitted in the same direction and the two resulting echoes summed. Linear echoes from tissue are inverted copies of each other and cancel to zero (c, middle). Microbubble echoes are distorted copies of each other, so that the even nonlinear components of these echoes reinforce each other when summed, producing a strong harmonic signal (c, right side).
PHASE INVERSION IMAGING
Phase or pulse inversion imaging (PII) achieves a better differentiation between bubbles and tissue without loss of resolution.13 PII involves transmission of an initial imaging pulse followed by a second pulse which is an inverted version of the first. The two resulting echoes are then summed: if they are scattered from a linear target, this sum is zero. However, because microbubbles produce non-linear scatter, the sum of the two signals from a microbubble will not be zero (Fig. 17-2B). In addition to allowing a wider bandwidth to be used than in harmonic imaging, PII also allows relatively low insonation pressures (low MI) which reduces the risk of microbubble disruption. This technique allows for continuous real time imaging during vascular phases, allowing detection of vascular patterns peculiar to different liver tumours. Inclusion of a third pulse of lower amplitude than the other two pulses allows detection of nonlinear echoes at the fundamental frequency, which improves penetration of the contrast image. This method is sometimes called ‘power modulation pulse inversion’ (PMPI) or ‘contrast pulse sequence’ (CPS).14
QUANTIFICATION TECHNIQUES
Quantification of microbubbles is complicated by the fact that there is no simple unit of quantification of the contrast echo which can be measured reliably and reproducibly. Furthermore, contrast imaging using the multi-pulse sequences such as PMPI and CPS described above are subject to multiple artifacts including motion artifact from patient or operator movement which can be difficult to avoid in long examinations. Initial work in the field of quantification of microbubbles focused on assessment of a number of variables including time to arrival, wash-in/wash-out characteristics, time to peak and the area under the curve (Fig. 17-3). With advances in technology, quantification techniques have progressed to allow microbubbles to be used for true, functional imaging in the form of dynamic contrast-enhanced ultrasound (DCE-US). Unlike other functional imaging techniques, DCE-US avoids the need for ionising radiation and so may be used repeatedly to monitor, for example, tumour response to treatment.15
FIGURE 17-3 Dynamic contrast-enhanced ultrasound (DCE-US). Disruption-replenishment imaging used to quantify flow in a renal cell carcinoma in a patient undergoing anti-angiogenic treatment. A sequence of side-by-side contrast images (conventional on right, simultaneous CEUS on left) of a large renal cell carcinoma is made during a steady intravenous infusion of the agent Definity™. (A) t = –1 sec, the tumour is enhanced. (B) t = 0 sec, a brief, high MI ‘flash’ disrupts bubbles within the scan plane. (C) t = 1 sec, new bubbles begin to wash in to the scan plane. (D-F) t = 4 sec, 8 sec and 18 sec after flash, the scan plane is fully replenished. (G) Off-line analysis software measures wash-in for a region-of-interest from the cine-loop record in a similar case. The steeper the slope, the greater the flow rate; the higher the plateau, the greater the vascular volume. Disruption-replenishment imaging thus allows quantitation of tumour flow and total vascular volume.
Artifacts
Artifacts occur predominantly with the older high MI imaging techniques.16 One of the most commonly seen artifacts when using microbubbles to enhance conventional Doppler studies is that of ‘blooming’ in which colour pixels appear to extend beyond the bounds of the vessel (Fig. 17-4). This phenomenon may prove problematic when objective computer analysis of contrast enhancement is required. While the problem arises partly from multiple re-reflections between adjacent microbubbles, it is also in part due to limitations of the hardware analysis of the Doppler signal.
FIGURE 17-4 A commonly seen artifact when using microbubbles is ‘blooming’ in which colour pixels appear to extend beyond the bounds of the vessel. (A) Baseline colour Doppler image at the level of the porta hepatis demonstrating absence of colour signal in the portal vein (arrow) but colour is present in the overlying hepatic artery. (B) Following the administration of SonoVue™ ‘blooming’ from the hepatic artery obscures the portal vein.
Clinical Applications of Microbubble Contrast
CARDIAC
Echocardiography
Patient factors including obesity and lung disease render a significant number of echocardiograms non-diagnostic, particularly in the case of stress echocardiography. Microbubble contrast agents allow improved delineation of the endocardial border and detection of wall motion abnormalities, as a result, up to 74% of otherwise non-diagnostic studies may be ‘rescued’.17 Use of microbubbles allows additional information regarding regional and global left ventricular function to be acquired during a stress echocardiography examination. Furthermore, valvular disease may be more accurately assessed by contrast-enhanced Doppler.
Myocardial Perfusion
Assessment of myocardial perfusion offers potential for the diagnosis of acute myocardial infarction, as well as assessing perfusion during stress testing. The combination of the more robust microbubbles with low MI techniques allows a more comprehensive myocardial assessment. Furthermore, the application of intermittent high-power pulses to destroy the microbubbles allows assessment of the rate of refilling of the myocardial micro-circulation, so providing a measure of micro-circulation perfusion. Studies indicate contrast echocardiography to be highly sensitive for the detection of acute coronary syndrome offering the hope of rapid bedside diagnosis and treatment for this life-threatening condition.18
LIVER
Unenhanced ultrasound is the first-line investigation of liver disease but continues to be perceived as less accurate in terms of detection and staging of focal lesions when compared to contrast-enhanced CT or MR imaging. Nearly all the ultrasound contrast agents available have been used to study liver lesions, consequently much of our understanding regarding in vivo behaviour has been gained from studies of liver abnormalities.19
Focal Liver Lesions
For focal liver lesions, the important aspects of the examination are the detection and then characterisation of lesions into benign and malignant abnormalities. Real-time low MI microbubble imaging is analogous to the phases seen with contrast-enhanced CT, except imaging with microbubbles is in real-time and repeatable. Microbubble ultrasound contrast displays an early (arterial) phase at around 10 to 35 seconds post intravenous administration, followed by a portal venous phase at approximately 30 to 120 seconds (Fig. 17-5). Depending on the formulation of the microbubble contrast agent there may then be a liver-specific phase as the microbubbles are taken up within the Kupffer cells.20
[/not-level-membership-for-radiology-category]
