[level-membership-for-anesthesiology-category]11
Metabolism, the Stress Response to Surgery and Perioperative Thermoregulation
METABOLISM
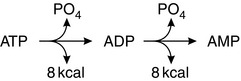
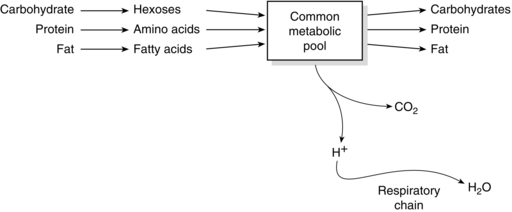
Adenosine triphosphate (ATP) is the ‘energy currency’ of the body. It contains two high-energy phosphate bonds and is present in all cells. Most physiological processes acquire energy from it. Oxidation of nutrients in cells releases energy, which is used to regenerate ATP. Conversion of one mole of ATP to adenosine diphosphate (ADP) releases 8 kcal of energy. Additional hydrolysis of the phosphate bond from ADP to AMP also releases 8 kcal (Fig. 11.1). Other high-energy compounds include creatine phosphate and acetyl CoA. The generation of energy through the oxidation of carbohydrate, protein and fat is termed catabolism, whereas the generation of stored energy as energy-rich phosphate bonds, carbohydrates, proteins or fats is termed anabolism (Fig. 11.2). The amount of energy released by carbohydrate, protein and fat metabolism is: carbohydrate 4.1 kcal g–1, protein 4.1 kcal g–1 and fat 9.3 kcal g–1.
CARBOHYDRATE METABOLISM
Aerobic Glycolysis
The mechanism of glucose catabolism involves an extensive series of enzyme-controlled steps, rather than a single reaction. This is because the oxidation of one mol of glucose (180 g) releases almost 686 kcal of energy, whereas only 8 kcal is required to form one molecule of ATP. Therefore, an elaborate series of reactions, termed the glycolytic pathway, releases small quantities of energy at a time, resulting in the synthesis of 38 mol of ATP from each mol of glucose (Fig. 11.3). As each molecule of ATP releases 8 kcal, a total of 304 kcal of energy in the form of ATP is synthesized. Hence, the efficiency of the glycolytic pathway is 44%, the remainder of the energy being released as heat.
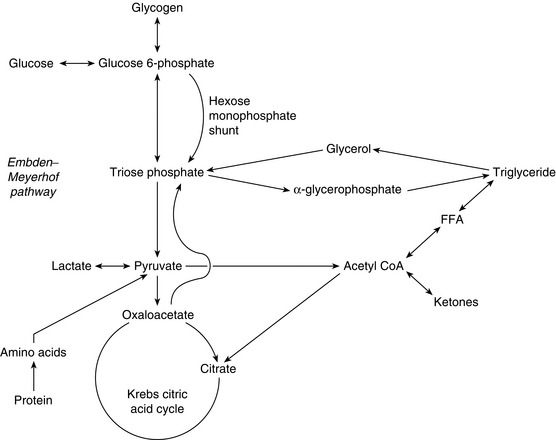
FIGURE 11.3 Summary of the glycolytic pathway. Krebs citric acid cycle. FFA, free fatty acid. Note that two molecules of pyruvic acid are produced for each molecule of glucose metabolized. Each pyruvic acid molecule enters the Krebs citric acid cycle.
The glycolytic pathway may be summarized as:
1. Glycolysis, i.e. splitting the glucose (6 carbon atoms) molecule into two molecules of pyruvic acid (3 carbon atoms each). This results in the net formation of two molecules of ATP anaerobically but also generates two pairs of H+ for entry into the respiratory chain (see below) (Fig. 11.4).
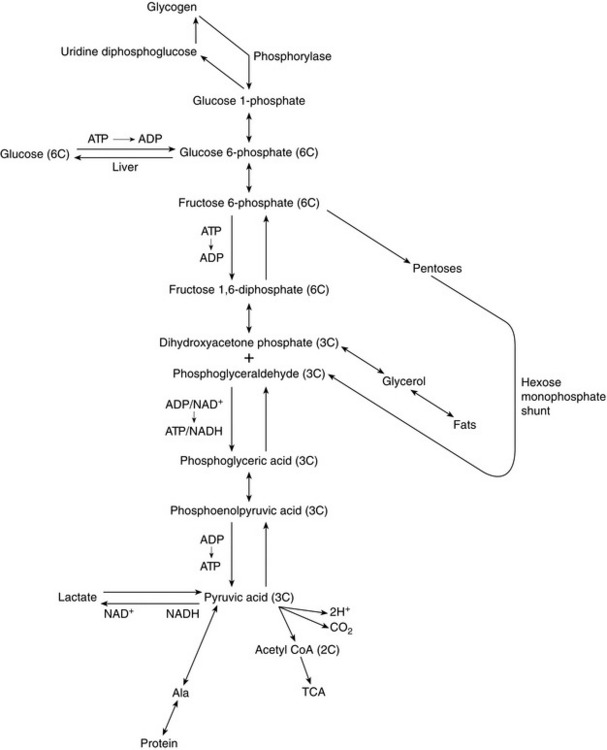
2. Oxidation of each of the pyruvic acid (3 carbon atom) molecules in the Krebs citric acid cycle results in the generation of five pairs of H+ per 3-carbon moiety, i.e. 10 pairs of H+ per 6 carbon glucose molecule (Fig. 11.5).
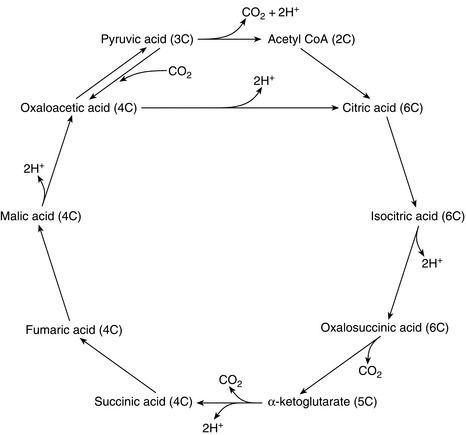
FIGURE 11.5 The Krebs citric acid cycle. Note that five pairs of H+ are generated by the oxidation of each pyruvate molecule. Each pair of H+ generates three molecules of ATP in the respiratory chain in the mitochondria.
3. Oxidative phosphorylation, i.e. the formation of ATP by the oxidation of hydrogen to water. This process is also known as the respiratory chain. For each molecule of glucose, a total of 12 pairs of H+ are fed into the respiratory chain, each pair generating three molecules of ATP. Thus, oxidative phosphorylation results in 36 molecules of ATP per molecule of glucose. A further two molecules of ATP are produced anaerobically. Therefore, one molecule of glucose generates 38 molecules of ATP. Uncoupling of oxidative phosphorylation allows ATP production to be sacrificed for heat production as part of thermoregulatory homeostasis.
PROTEIN METABOLISM
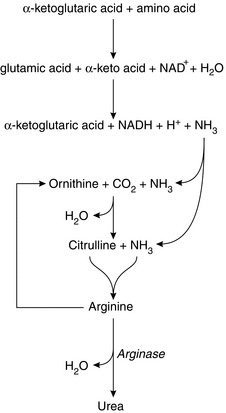
There is equilibrium between the amino acids in plasma, plasma proteins and tissue proteins. Proteins may be synthesized from amino acids in all cells of the body, the type of protein depending on the genetic material in the DNA, which determines the sequence of amino acids formed and hence controls the nature of the synthesized proteins. Essential amino acids must be ingested as they cannot be synthesized in the body. Table 11.1 lists the eight essential amino acids. If there is dietary deficiency of any of these, the subject develops a negative nitrogen balance. Others are non-essential (i.e. may be synthesized in the cells). Synthesis is by the process of transamination, whereby an amine radical (-NH2) is transferred to the corresponding α-keto acid. Breakdown of excess amino acids into glucose (gluconeogenesis) generates energy or storage as fat, both of which occur in the liver. The breakdown of amino acids occurs by the process of deamination, which takes place in the liver. It involves the removal of the amine group with the formation of the corresponding ketoacid. The amine radical may be recycled to other molecules or released as ammonia. In the liver, two molecules of ammonia are combined to form urea (Fig. 11.6). Amino acids may also take up ammonia to form the corresponding amide.
TABLE 11.1
Leucine
Isoleucine
Lysine
Methionine
Phenylalanine
Threonine
Tryptophan
Valine
LIPID METABOLISM
Lipids include triglycerides (TGs), phospholipids (PLs) and cholesterol. The basic structure of TGs and PLs is the fatty acid. Fatty acids are long-chain hydrocarbon organic acids. TGs are composed of three long-chain fatty acids bound with one molecule of glycerol (Fig. 11.7). Phospholipids have two long-chain fatty acids bound to glycerol with the third fatty acid replaced by attached compounds such as inositol, choline or ethanolamine. Although cholesterol does not contain fatty acid, its sterol nucleus is formed from fatty acid molecules.

 very low-density lipoproteins (VLDLs), consisting mainly of TGs
 low-density lipoproteins (LDLs), consisting mainly of cholesterol
 high-density lipoproteins (HDLs), consisting mainly of protein.
Cholesterol
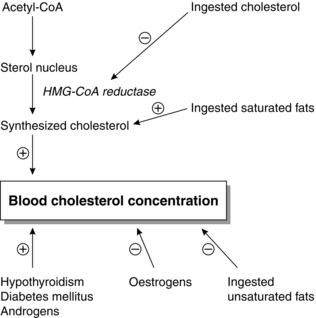
The serum cholesterol concentration is correlated with the incidences of atherosclerosis and coronary artery disease. Prolonged elevations of VLDL, LDL and chylomicron remnants are associated with atherosclerosis. Conversely, HDL is protective. Factors affecting blood cholesterol concentration are outlined in Figure 11.8.
Ketones
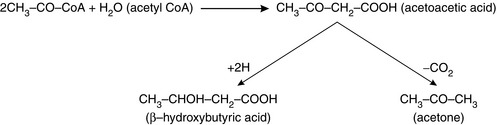
Initial degradation of fatty acids occurs in the liver, but the acetyl-CoA may not be used either immediately or completely. Ketones, or keto acids, are either acetoacetic acid, formed from two molecules of acetyl CoA, β-hydroxybutyric acid, formed from the reduction of acetoacetic acid, or acetone, formed when a smaller quantity of acetoacetic acid is decarboxylated (Fig. 11.9). These three substances are collectively termed ketones. They are organic acids formed in the liver, from which they diffuse into the circulation and are transported to the peripheral tissues where they may be used for energy. Their importance is that they accumulate in diabetes and starvation, such as may occur in the perioperative period. In both circumstances, no carbohydrates are being metabolized. In diabetes, decreased insulin results in a reduction in intracellular glucose, and in starvation, carbohydrates are lacking simply because they are not being ingested. The ensuing breakdown of fat as described above results in large quantities of ketones being released from the liver to the peripheral tissues. There is a limit to the rate at which ketones are used by the tissues, because depletion of essential carbohydrate intermediate metabolites slows the rate at which acetyl CoA can enter the Krebs cycle (see Fig. 11.5). Hence, blood ketone concentration may increase rapidly, causing metabolic acidosis and ketonuria. Acetone may be discharged on the breath to give a characteristic sweet odour.
Measuring Metabolic Rate
Basal metabolic rate (BMR) is determined at complete mental and physical rest 12–14 h after food ingestion, if body temperature is within the normal range. Metabolic rate increases by approximately 8% for every 1 °C rise of body temperature. BMR may be measured by indirect calorimetry which involves the measurement of water, CO2 or protein breakdown products produced to enable the metabolic rate to be quantified. Alternatively, the O2 consumption can be measured. A total of 4.82 kcal of energy is produced per litre of O2 consumed although accurate assessment depends on information about the type of food ingested. Factors influencing BMR are listed in Table 11.2.
TABLE 11.2
Factors Influencing Metabolic Rate
Malnutrition (20%)
Sleep (15%)
Exercise (up to 2000 × BMR)
Protein ingestion
Age: < 5 years has × 2 BMR of > 70
Thyroid hormone imbalance (increase or decrease by 50%)
Sympathetic stimulation
Testosterone (by 15%)
Temperature
Anaesthesia (20% reduction) (regional anaesthesia – no effect)
THE STRESS RESPONSE TO SURGERY
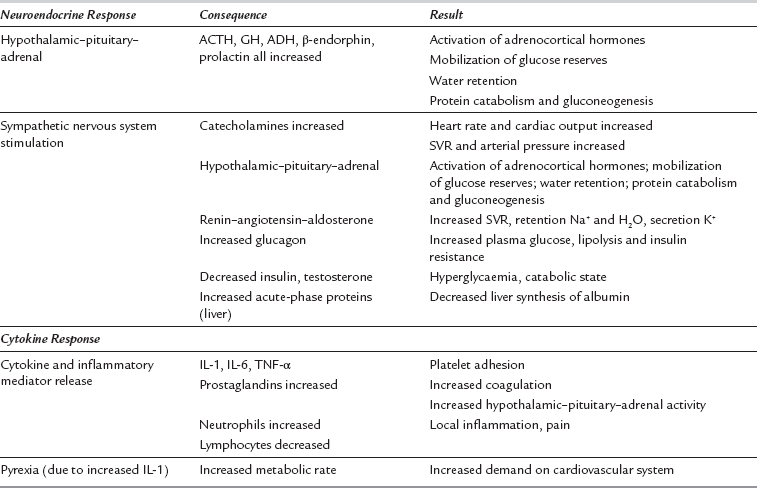
Surgery or trauma consistently elicits a characteristic neuroendocrine and cytokine response in proportion to the extent of injury or metabolic insult. Minor surgery on a limb has a negligible stress response, in contrast to major surgery such as a laparotomy or thoracotomy. The characteristics of the stress response to surgery are summarized in Table 11.3. There are two principal components to the stress response to surgery: the neuroendocrine response and the cytokine response. The neuroendocrine response is stimulated by painful afferent neural stimuli reaching the CNS. It may be diminished and sometimes eliminated altogether by dense neural blockade from a regional anaesthetic technique.
The cytokine component of the stress response is stimulated by local tissue damage at the site of the surgery itself and is not inhibited by regional anaesthesia. It is diminished by minimally invasive surgery, especially laparoscopic techniques. Triggers are listed in Table 11.4.
TABLE 11.4
Triggers of the Neuroendocrine and Cytokine Response in Patients After Surgery
Noxious afferent stimuli (especially pain)
Local inflammatory tissue factors, especially cytokines
Pain and anxiety
Starvation
Hypothermia and shivering
Haemorrhage
Acidosis
Hypoxaemia
Infection
Consequences of the Neuroendocrine Element of the Stress Response
Fat Metabolism
The net effect of the hormonal alterations listed in Table 11.3 is lipolysis, stimulated by catecholamines acting at α1-adrenoreceptors, with resultant increased concentrations of FFAs in the circulation. FFAs may be oxidized in the liver to form ketones (e.g. acetoacetate), which may be used as a source of energy by peripheral tissues.
Cardiovascular Effects
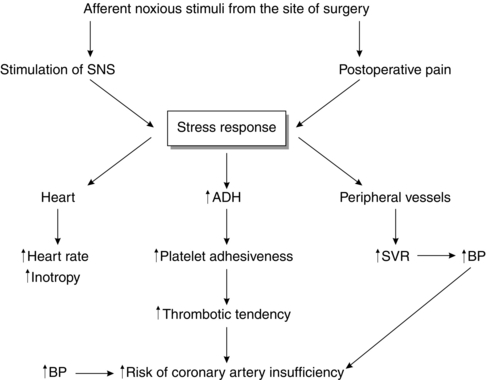
The stress response to surgery and postoperative pain activates the sympathetic nervous system (SNS), which may increase myocardial oxygen demand by increasing heart rate and arterial pressure. Activation of the SNS may also cause coronary artery vasoconstriction, reducing the supply of oxygen to the myocardium, which in turn can predispose to myocardial ischaemia. This effect may be aggravated by the fact that there is a hypercoagulable state postoperatively and the stress response is an important factor in causing this. The concentration of antidiuretic hormone (ADH) increases during the stress response, and this is known to contribute to increased platelet adhesiveness (Fig. 11.10).
THERMOREGULATION AND ANAESTHESIA
Heat Balance
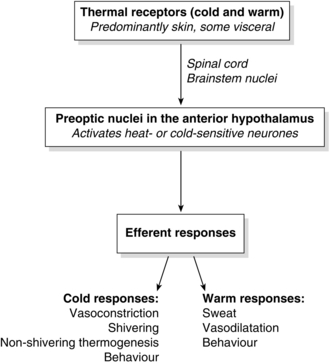
Maintaining core temperature within a narrow range requires balancing heat production and loss. It is achieved by a control system consisting of afferent thermal receptors, central integrating systems and efferent control mechanisms (Fig. 11.11). It was formerly believed that the spinal cord and brainstem were passive conductors of afferent signals to the preoptic area of the hypothalamus, but it is now accepted that thermoregulation is a ‘multi-level, multiple-input’ system with the spinal cord, nucleus raphe magnus and locus subcoeruleus involved both in generating afferent thermal signals and modulating efferent thermoregulatory responses.
Thermoregulation
Thermoregulation is achieved by a physiological control system consisting of peripheral and central thermoreceptors, an integrating control centre and efferent response systems (see Fig. 11.11).
Thermoreceptors: Afferent thermal input comes from anatomically distinct cold and heat receptors, located predominantly in the skin, but also centrally. The afferent thermal input comes from both core (80%) and peripheral (20%) compartments. The peripheral input is by thermally sensitive receptors located in the skin and mucous membranes, while core input occurs from thermoreceptors located in the hypothalamus itself (20%), brain (20%), spinal cord (20%), and thoracic and abdominal tissue (20%). Cold-specific receptors are innervated by Aδ fibres. Heat receptors are innervated by C fibres. Cold receptors in the skin outnumber heat receptors 10-fold and are the major mechanism by which the body protects itself against cold temperatures. Afferent input from these cold receptors in the skin is transmitted ultimately to the posterior hypothalamus.
Central Control: The central control mechanism, situated in the hypothalamus, determines mean body temperature by integrating thermal signals from peripheral and core structures and comparing mean body temperature with a predetermined ‘set point’ temperature. The set point or physiological ‘thermostat’ of the thermoregulatory system is the temperature at which the system requires zero action to maintain that temperature (36.8–37.2 °C). The limits of this range represent the thresholds at which cold or heat responses are instigated, and hence it has been termed the ‘interthreshold range’. Normally it is < 1 °C, but this increases to 4 °C during general anaesthesia.
Effect of General Anaesthesia on Thermoregulation
Widening of the Interthreshold Range
As discussed above, the interthreshold range is a narrow range of core temperature within which thermoregulatory mechanisms are relatively quiescent. General anaesthesia causes a dose-dependent widening of this interthreshold range, with an increase in the temperature at which thermoregulatory responses to heat are activated and an even greater reduction in the temperature at which thermoregulatory responses to cold are activated. Typically, the interthreshold range widens by about 4 °C, with the body becoming poikilothermic within this temperature range (Fig. 11.12). However, once core temperature falls outside this range, the gain (the rate of response to a given decrease in core temperature) and maximal response intensity of homeostatic mechanisms are unaffected. All general anaesthetic agents, both volatile and intravenous, impair thermoregulatory responses to a similar, but not identical, extent.
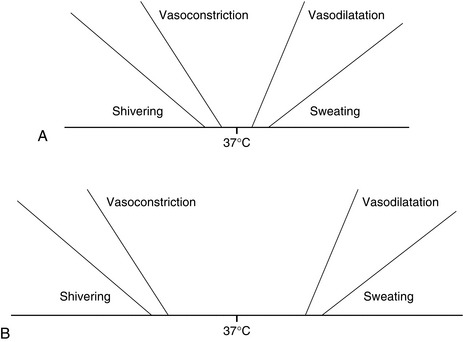
FIGURE 11.12 Thresholds for thermoregulatory effectors. (A) Under normal conditions, the range of core temperatures within which no effector is active, i.e. normal temperature, is approximately 0.5 °C. (B) During general anaesthesia, the range of core temperatures within which no effector is active is increased to approximately 4.0 °C.
Stages of Hypothermia
Mild hypothermia during general anaesthesia follows a distinctive pattern and occurs in three phases (Fig. 11.13):
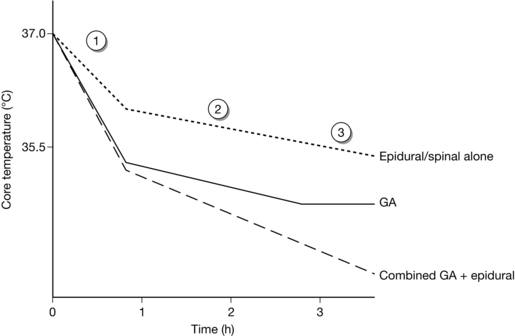
FIGURE 11.13 Characteristic patterns of hypothermia during general anaesthesia (GA) alone, epidural or spinal anaesthesia alone and combined general and epidural anaesthesia. Patients in this last category are more likely to develop profound hypothermia than others (see text).
Phase 1 (Redistribution Stage): Under normal conditions, the temperature gradient between core and peripheral compartments is maintained by tonic vasoconstriction. On induction of anaesthesia, normal vasoconstrictor tone is reduced, and vasodilatation occurs, allowing heat to flow down its concentration gradient from the warm core to the cooler periphery, resulting in a mild core hypothermia (core temperature about 35.5–36.0 °C). This core hypothermia occurs because of redistribution of body heat on induction of anaesthesia, and overall heat loss from the body is minimal. Redistribution hypothermia results in an initial rapid decrease in core temperature of approximately 1 °C over the first 30 min, but mean body temperature and body heat content remain constant during this 30 min (Fig. 11.14).
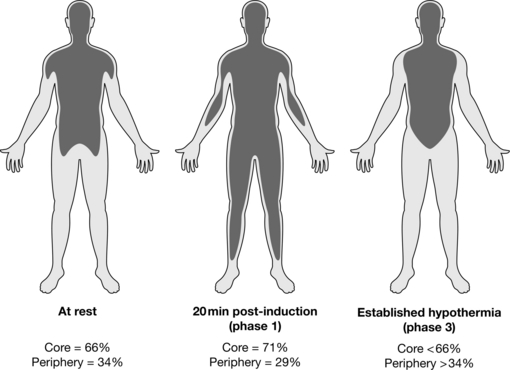
There are a number of factors which affect the magnitude of this initial phase 1 hypothermia.


Phase 2 (Heat Loss > Heat Production): Phase 2 is a slower linear decrease in core temperature to 34–35 °C over the next 2 h and occurs as a result of heat loss exceeding heat production. General anaesthesia reduces metabolic heat production by 15–40%, particularly through decreased brain metabolism and reduced respiratory muscle activity. Increased heat loss occurs through peripheral vasodilatation, evaporative heat loss from the body surface, and evaporative losses from exposed body cavities (some animal studies have shown that as much as 50% of total heat loss can come from exposed bowel).
Phase 3 (Plateau Phase): Phase 3 is a core temperature plateau (or thermal equilibrium), where heat loss equals heat production (either metabolic or warming devices) (Fig. 11.14). This core temperature plateau results largely from thermoregulatory vasoconstriction, triggered by a core temperature of 33–35 °C. Patients with impaired autonomic responses (e.g. elderly, diabetics, Parkinson’s disease, Shy-Drager syndrome, etc.) are less able to establish effective vasoconstriction and in these patients, establishment of a plateau phase may be delayed or even absent.
Effect of Regional Anaesthesia on Thermoregulation
Regional anaesthesia has a similar effect to general anaesthesia on thermoregulation and hypothermia. Regional anaesthesia widens the interthreshold range. The reasons for this are not clear, but are probably related to a blockade of afferent input to the hypothalamus. As with general anaesthesia, redistribution of body heat during spinal or epidural anaesthesia is the main cause of hypothermia. Because redistribution during spinal or epidural anaesthesia is confined usually to the lower half of the body, the initial core hypothermia is not as pronounced as in general anaesthesia (approximately 0.5 °C). Otherwise, the pattern of hypothermia during spinal or epidural anaesthesia is similar to that seen during general anaesthesia for the first two phases. The major difference for spinal or epidural anaesthesia is that the plateau phase does not emerge because vasoconstriction is blocked (see Fig. 11.13). Heat loss continues unabated during epidural anaesthesia despite the activation of effector mechanisms above the level of the block. Therefore, patients undergoing long procedures with combined general and epidural anaesthesia are at risk of a greater degree of hypothermia.
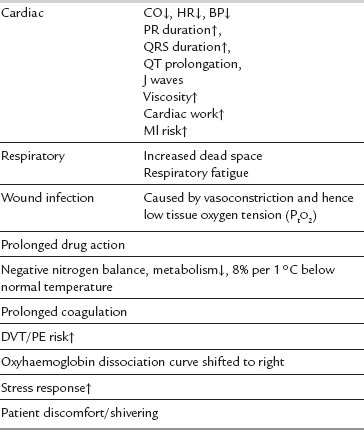
Consequences of Perioperative Hypothermia
In specific circumstances, hypothermia may have a protective effect in terms of reducing basal metabolic rate. The use of moderate hypothermia is routine practice in many centres during cardiopulmonary bypass. It is generally agreed, however, that, in most situations, the deleterious consequences of mild hypothermia outweigh the potential benefits, with evidence emerging that hypothermia per se is responsible for adverse postoperative outcomes. In particular, hypothermic patients are more likely than normothermic patients to have postoperative wound infections. The initial 3–4 h after bacterial contamination are thought to be crucial in determining whether clinical infection ensues. In vitro studies suggest that platelet function and coagulation are impaired by hypothermia, and mildly hypothermic patients lose > 25% more blood in the perioperative period than do normothermic patients. In addition, perioperative thermal discomfort is often remembered by patients as the worst aspect of their perioperative experience (Table 11.5).
Physical, Active and Passive Strategies for Avoiding Perioperative Hypothermia
Preventing redistribution-induced hypothermia may be achieved by physical and pharmacological means (Table 11.6). Redistribution of heat results when anaesthetic-induced vasodilatation allows heat to flow from the core to the periphery down its concentration gradient. Pre-emptive skin surface warming does not increase core temperature but increases body heat content, particularly in the legs, and removes the gradient for heat loss via the skin. However, this approach is rarely used in clinical practice because it requires 1 h of prewarming. This is unfortunate because it is a far more effective method of minimizing peri-operative hypothermia than trying to rewarm patients who have become hypothermic.
TABLE 11.6
Strategies for Prevention of Perioperative Hypothermia
Intraoperative use of forced air convective warming device
Reflective space blankets
Heating and humidifying inspired gases
Increased ambient temperature to 23 °C
Warmed i.v. fluids
Forced air warming systems are undoubtedly the best way to maintain normothermia during long procedures and are particularly effective when used intra-operatively for vasodilated patients, allowing heat applied peripherally to be transferred rapidly to the core. Their use increases core temperature and reduces the incidence of postanaesthetic shivering (Table 11.6).
Postanaesthetic Shivering
Postanaesthetic shivering affects up to 65% of patients after general anaesthesia and 33% during epidural or regional anaesthesia. It is usually defined as readily detectable tremor of the face, jaw, head, trunk or extremities lasting longer than 15 s. Apart from the obvious discomfort, postanaesthetic shivering, in common with hypothermia, is associated with several potentially deleterious sequelae (see Table 11.5). Postanaesthetic shivering is usually preceded by core hypothermia and vasoconstriction. Two patterns of muscular activity, seen in electromyography studies, contribute to the phenomenon of postanaesthetic shivering; first, a tonic pattern (4–8 cycles min− 1 characteristic of the response to hypothermia in awake patients) is observed, and then a phasic (6–7 Hz) pattern resembling clonus.
Postoperative shivering should not be treated in isolation from perioperative hypothermia. Not all patients who shiver are hypothermic, but most are, and successful treatment of shivering in these patients without concomitant management of hypothermia may result in deepening hypothermia. However, the mainstay of symptomatic treatment of postoperative shivering is radiant heating, forced air rewarming or pharmacological methods (Table 11.7).
TABLE 11.7
Treatment of Postanaesthetic Shivering
Pethidine 0.33 mg kg–1 (other opioids to a lesser extent)
Doxapram 1.5 mg kg–1
Clonidine 2 μg kg–1
Methylphenidate 0.1 mg kg–1
Physostigmine 0.04 mg kg–1
Ondansetron 0.1 mg kg–1
Buggy, D.J., Crossley, A.W.A. Thermoregulation, perioperative hypothermia and post-anaesthetic shivering. Br. J. Anaesth. 2000;84:615–628.
Desborough, J.P. The stress response to trauma and surgery. Br. J. Anaesth. 2000;85:107–117.
Guyton, A.C., Hall, J.E. Metabolism and temperature regulation. In Guyton A.C., Hall J.E., eds.: Textbook of medical physiology, eleventh ed., Philadelphia: WB Saunders, 2005.
Hahnenkamp, K., Herroeder, S., Hollmann, M.W. Regional anaesthesia, local anaesthetics and the surgical stress response. Best Pract. Res. Clin. Anaesthesiol. 2004;18:509–527.
, Inadvertent perioperative hypothermia. NICE clinical guideline. 2008. Available from www.nice.org.uk/CG065.
Kohl, B.A., Deutschman, C.S. The inflammatory response to surgery and trauma. Curr. Opin. Crit. Care. 2006;12:325–332.
Reynolds, L., Beckmann, J., Kurz, A. Perioperative complications of hypothermia. Best Pract. Res. Clin. Anaesthesiol. 2008;22:645–657.
Sessler, D.I. Temperature monitoring and perioperative thermoregulation. Anesthesiology. 2008;109:318–338.
[/level-membership-for-anesthesiology-category][not-level-membership-for-anesthesiology-category]11
Metabolism, the Stress Response to Surgery and Perioperative Thermoregulation
METABOLISM
Adenosine triphosphate (ATP) is the ‘energy currency’ of the body. It contains two high-energy phosphate bonds and is present in all cells. Most physiological processes acquire energy from it. Oxidation of nutrients in cells releases energy, which is used to regenerate ATP. Conversion of one mole of ATP to adenosine diphosphate (ADP) releases 8 kcal of energy. Additional hydrolysis of the phosphate bond from ADP to AMP also releases 8 kcal (Fig. 11.1). Other high-energy compounds include creatine phosphate and acetyl CoA. The generation of energy through the oxidation of carbohydrate, protein and fat is termed catabolism, whereas the generation of stored energy as energy-rich phosphate bonds, carbohydrates, proteins or fats is termed anabolism (Fig. 11.2). The amount of energy released by carbohydrate, protein and fat metabolism is: carbohydrate 4.1 kcal g–1, protein 4.1 kcal g–1 and fat 9.3 kcal g–1.
CARBOHYDRATE METABOLISM
Aerobic Glycolysis
The mechanism of glucose catabolism involves an extensive series of enzyme-controlled steps, rather than a single reaction. This is because the oxidation of one mol of glucose (180 g) releases almost 686 kcal of energy, whereas only 8 kcal is required to form one molecule of ATP. Therefore, an elaborate series of reactions, termed the glycolytic pathway, releases small quantities of energy at a time, resulting in the synthesis of 38 mol of ATP from each mol of glucose (Fig. 11.3). As each molecule of ATP releases 8 kcal, a total of 304 kcal of energy in the form of ATP is synthesized. Hence, the efficiency of the glycolytic pathway is 44%, the remainder of the energy being released as heat.
FIGURE 11.3 Summary of the glycolytic pathway. Krebs citric acid cycle. FFA, free fatty acid. Note that two molecules of pyruvic acid are produced for each molecule of glucose metabolized. Each pyruvic acid molecule enters the Krebs citric acid cycle.
The glycolytic pathway may be summarized as:
1. Glycolysis, i.e. splitting the glucose (6 carbon atoms) molecule into two molecules of pyruvic acid (3 carbon atoms each). This results in the net formation of two molecules of ATP anaerobically but also generates two pairs of H+ for entry into the respiratory chain (see below) (Fig. 11.4).
2. Oxidation of each of the pyruvic acid (3 carbon atom) molecules in the Krebs citric acid cycle results in the generation of five pairs of H+ per 3-carbon moiety, i.e. 10 pairs of H+ per 6 carbon glucose molecule (Fig. 11.5).
FIGURE 11.5 The Krebs citric acid cycle. Note that five pairs of H+ are generated by the oxidation of each pyruvate molecule. Each pair of H+ generates three molecules of ATP in the respiratory chain in the mitochondria.
3. Oxidative phosphorylation, i.e. the formation of ATP by the oxidation of hydrogen to water. This process is also known as the respiratory chain. For each molecule of glucose, a total of 12 pairs of H+ are fed into the respiratory chain, each pair generating three molecules of ATP. Thus, oxidative phosphorylation results in 36 molecules of ATP per molecule of glucose. A further two molecules of ATP are produced anaerobically. Therefore, one molecule of glucose generates 38 molecules of ATP. Uncoupling of oxidative phosphorylation allows ATP production to be sacrificed for heat production as part of thermoregulatory homeostasis.
PROTEIN METABOLISM
There is equilibrium between the amino acids in plasma, plasma proteins and tissue proteins. Proteins may be synthesized from amino acids in all cells of the body, the type of protein depending on the genetic material in the DNA, which determines the sequence of amino acids formed and hence controls the nature of the synthesized proteins. Essential amino acids must be ingested as they cannot be synthesized in the body. Table 11.1 lists the eight essential amino acids. If there is dietary deficiency of any of these, the subject develops a negative nitrogen balance. Others are non-essential (i.e. may be synthesized in the cells). Synthesis is by the process of transamination, whereby an amine radical (-NH2) is transferred to the corresponding α-keto acid. Breakdown of excess amino acids into glucose (gluconeogenesis) generates energy or storage as fat, both of which occur in the liver. The breakdown of amino acids occurs by the process of deamination, which takes place in the liver. It involves the removal of the amine group with the formation of the corresponding ketoacid. The amine radical may be recycled to other molecules or released as ammonia. In the liver, two molecules of ammonia are combined to form urea (Fig. 11.6). Amino acids may also take up ammonia to form the corresponding amide.
TABLE 11.1
Leucine
Isoleucine
Lysine
Methionine
Phenylalanine
Threonine
Tryptophan
Valine
LIPID METABOLISM
Lipids include triglycerides (TGs), phospholipids (PLs) and cholesterol. The basic structure of TGs and PLs is the fatty acid. Fatty acids are long-chain hydrocarbon organic acids. TGs are composed of three long-chain fatty acids bound with one molecule of glycerol (Fig. 11.7). Phospholipids have two long-chain fatty acids bound to glycerol with the third fatty acid replaced by attached compounds such as inositol, choline or ethanolamine. Although cholesterol does not contain fatty acid, its sterol nucleus is formed from fatty acid molecules.
very low-density lipoproteins (VLDLs), consisting mainly of TGs
low-density lipoproteins (LDLs), consisting mainly of cholesterol
high-density lipoproteins (HDLs), consisting mainly of protein.
Cholesterol
The serum cholesterol concentration is correlated with the incidences of atherosclerosis and coronary artery disease. Prolonged elevations of VLDL, LDL and chylomicron remnants are associated with atherosclerosis. Conversely, HDL is protective. Factors affecting blood cholesterol concentration are outlined in Figure 11.8.
Ketones
Initial degradation of fatty acids occurs in the liver, but the acetyl-CoA may not be used either immediately or completely. Ketones, or keto acids, are either acetoacetic acid, formed from two molecules of acetyl CoA, β-hydroxybutyric acid, formed from the reduction of acetoacetic acid, or acetone, formed when a smaller quantity of acetoacetic acid is decarboxylated (Fig. 11.9
[/not-level-membership-for-anesthesiology-category]
