[level-membership-for-pediatrics-category]
Chapter 42 Mechanical Dysfunction of the Respiratory System
Work, Power, and Energy Expenditure in the Respiratory System
In simple intuitive terms, the variable that best sums up the function of a muscle-powered pump is the mechanical load that the contraction of the powering muscles must overcome with each pump cycle. Over time, mechanical load translates into power (the product of work by the time that it takes to carry it out) and energy expenditure. Accordingly, whether the respiratory muscles can carry a given mechanical load is ultimately determined by their ability to generate work from the limited amount of energy that they receive from their blood supply. The first law of thermodynamics stipulates that when a certain amount of energy is added to a closed system by an external source (in this case the metabolism of fuels supplied by the circulation to the respiratory muscles), the resultant change in the system’s internal energy may either be applied to perform external work (W) over a period of time (t) or is dissipated as heat (Q). Implicit in this statement is the fact that only a portion of the energy that the respiratory muscles derive from metabolic substrates is transformed into respiratory work. This proportion varies depending on the system’s efficiency (E), defined as:

Determinants of Respiratory Work
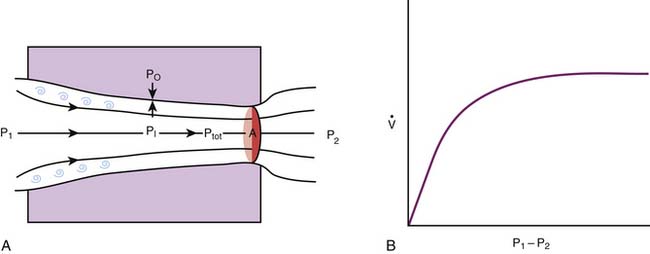
Every high school physics student learns to calculate the external work done to move an object between two points as the product of the force needed to overcome all resistances to the movement by the distance between the points. Because the force may change along the way, the same student may learn at some point that it is more precise to break the movement into many elementary components and then add up all the work components by integration, as shown in Figure 42-1, A.
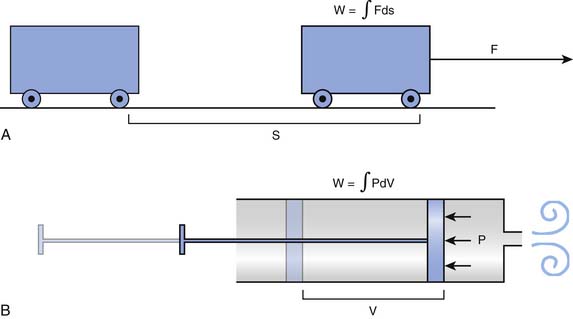
The mathematical subtleties of this distinction may become a little clearer if we compare the breath to the action of a syringe, where, by pushing or pulling on the plunger, we create a pressure (P), positive or negative, that has the effect of changing the volume contained in the barrel (V). The work done in this process can be determined by integrating the product P · dV, as shown in Figure 42-1, B. The obvious corollary is that the work done by the respiratory muscles and, by extension, the energy that must be supplied to these muscles are both defined by the volume-pressure relationships of the lungs and the chest wall.
Volume-Pressure Relationships

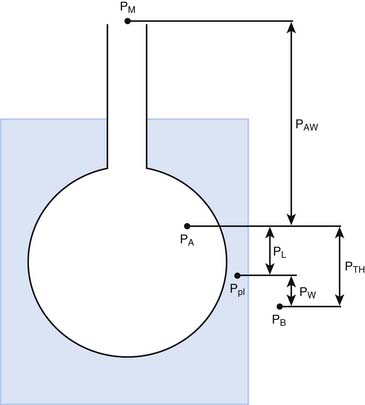
The pressures needed to inflate the thorax, the lungs, and the chest wall are, however, different from each other. Respiratory physiologists have traditionally approached the analysis of these pressures by taking an imaginary walk from the mouth down the airways to the alveolus, across the lung tissue and visceral pleura to the pleural space, and finally across the chest wall to the surface of the chest (Figure 42-2). The difference between the pressures measured at two consecutive stops is the driving pressure needed to cause or maintain a certain volume displacement:


Consider first a situation in which the lungs undergo passive distention, without participation of the respiratory muscles. This is what happens during positive airway pressure ventilation, when the pressure drive for inflation of the thorax is provided by PM. By performing a series of substitutions in equations 3through 5 and assuming PB = 0, we can easily arrive to the following equality:

which reveals that, from a mechanical point of view, the components of the respiratory system form a series arrangement, whereby the total pressure needed to generate a movement is the sum of the pressures generated in the airways, the lungs, and the chest wall. Respiratory physiologists have often borrowed from electrical theory, assuming, perhaps to the dismay of many readers, that the black and white simplicity of electrical circuitry is less intimidating than the complexities of Newtonian mechanics. When speaking of electrical circuits, the term series indicates that every element in the circuit experiences the same current as the circuit as a whole, but the total voltage across the circuit is the sum of the voltages across the individual elements. Because current is the electrical analog of flow (volume per unit of time) and voltage is the analog of pressure, it is easy to see how Equations 2 and 6 justify the overall electrical analogy, even though many readers may be less impressed by how much conceptual clarity it sheds for them.
The mechanical behavior of the airways and the lungs does not change substantially during muscle-powered breathing. The behavior of the chest wall, on the other hand, is greatly influenced by the contraction of the respiratory muscles. Because the muscles not only act on the wall but are also part of the wall itself, any attempt to define mathematically the behavior of the chest wall during a spontaneous breath becomes a futile exercise. For our purposes here, however, it may suffice to say that, during spontaneous breathing, equation 6 can be modified as:

where Pmus represents the pressure generated by the muscles’ contraction, inclusive of the effects that this contraction has on the behavior of the chest wall itself. Thus every time we take a breath, the neural output to the respiratory muscles is adjusted to overcome as precisely as possible the opposing pressures generated by the respiratory system.
Nature of the Mechanical Forces Acting on the Respiratory Pump
Disease induces alterations in these physical processes and therefore also in the forces and pressures that result from them. To relate these alterations to the disease’s clinical manifestations, it is helpful to classify both processes and pressures into nondissipative and dissipative, depending on whether the energy consumed stays in or leaves the system. For instance, elasticity is typically a nondissipative process because the energy needed to produce elastic deformation during inspiration is accumulated in the tissues and then used to empty the lungs during expiration. In contrast, all resistive processes are dissipative: the energy liberated by the friction of the gas against the airway walls or by the molecular interactions within the tissue is transformed into heat and transported outside of the system by the blood or the expired gas.
Nondissipative Phenomena: Elastic Behavior of the Respiratory System

By obtaining measurements at various volumes and then plotting volume against PA, PL, and PW, we can compare the volume-pressure relationships of the thorax as a whole with those of the lungs and the chest wall. Not unexpectedly given the heterogeneous composition of the structures involved, the relationships are complex and cannot be described in a simple mathematical equation (Figure 42-3). In all three cases, the plotted curve has a sigmoidlike shape, with pressure increasing rapidly relative to volume at low and high volumes and more slowly at middle volumes.1
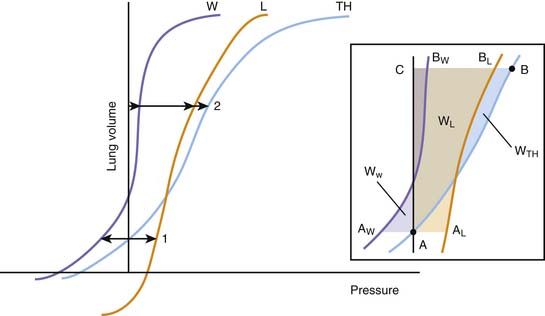
Figure 42–3 Idealized representation of the static volume-pressure relationships of the thorax (TH), lungs (L), and chest wall (W). Pressure, on the abscissa, represents the pressure across the thorax as a whole (PTH = PA – PB), lungs (PL = PA – PL), and chest wall (PW = Ppl – PB; see Figure 42-2). The arrows indicate the magnitude and direction of the pressures acting on the thorax and its components at two volumes: (1) the relaxation volume of the thorax, where the recoils of the lung and the chest wall neutralize each other; and (2) an arbitrary volume where the recoils of the lungs and the chest wall act both in the direction of reducing thoracic volume. Inset: Detail of the same curves, indicating the elastic work done on the thorax as a whole and each of its components for a volume displacement starting at a volume A (the relaxation volume of the thorax) and ending at a volume C. The work done on the thorax as a whole is represented by the area A-B-C; the work done on the lungs by A-AL-BL-C; and the work done on the chest wall by AW-A-BW-C. A portion of the work done on the chest wall (the triangular area in purple between AW and the ordinate axis) is contributed by the recoil of the chest wall, which between those points facilitates the action of the respiratory muscles.
Being a continuous function, each volume-pressure relationship has a defined slope at any given volume (dV/dP). This slope defines the compliance of the thorax, lungs, or chest wall for that particular volume, depending on whether dP is replaced by dPA, dPL, or dPW. Although a cursory examination of Figure 42-3 reveals that both the lung and chest wall compliances defined in this manner vary markedly over the entire range of volumes, on closer inspection, the ratio dV/dP is relatively constant at normal breathing volumes. Thus for these volumes, it is safe to write:

where ΔPel represents the change in elastic recoil pressure of the thorax (ΔPA), lungs (ΔPL), or chest wall (ΔPW) for a lung volume excursion ΔV, and C is the compliance of the corresponding component. As lung volume decreases or increases beyond this linear range, dV/dP starts to decrease in a volume-dependent manner, and the respiratory muscles must generate progressively larger pressures to produce the same volume change. Disease frequently causes the lungs to operate outside of their linear volume-pressure range, thereby increasing both the work of breathing and the energy needed to do it.
At any given volume, the lungs, the chest wall, and the thorax each generate a certain elastic pressure or recoil. This recoil can act to increase or decrease volume (as indicated by the direction of the arrows in Figure 42-4). By definition, elastic recoil drives the thorax and its individual components to adopt a volume, known as the relaxation volume, at which recoil itself is extinguished. The relaxation volumes of the lungs and the chest wall are the volumes that each of these components would adopt if all the mechanical constraints imposed by their mutual attachments and interactions were removed. The relaxation volume of the thorax, in contrast, is defined by the mechanical interaction of the lungs and the chest wall. It coincides with the point at which the opposing elastic recoils of these two components neutralize each other (as shown by the equal magnitude but opposite pressure vectors in Figure 42-4).
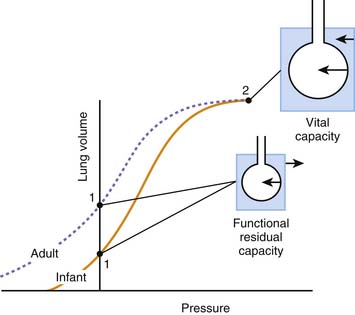
In the adult, the relaxation volume of the lungs is lower than the residual volume (the volume of gas contained in the lungs at the end of a forced expiration). The relaxation volume of the chest wall, by contrast, exceeds 50% of the vital capacity (the maximal volume of gas that can be inhaled from residual volume). This discrepancy in the relaxation volumes of the lungs and chest wall has three important consequences. First, it forces the relaxation volume of the thorax as a whole to occupy a position intermediate between the relaxation volumes of the lungs and the chest wall (at approximately 35% of vital capacity). Under most circumstances, this volume coincides with the functional residual capacity (FRC), which is the volume contained in the lungs at the end of a tidal expiration. Second, as the thorax starts to rise above its relaxation volume during inspiration, the outward recoil of the chest wall contributes to the expansion of the lungs, thereby reducing the work that the respiratory muscles need to perform during normal breathing (see Figure 42-3, inset, where the work done by the chest wall at the beginning of a breath is represented by WW). Finally, at normal breathing volumes, the opposing actions of the lungs and chest wall recoils create a negative pressure at the boundaries of the lung tissue with the chest wall and the other intrathoracic structures. This negative pressure is an important contributor to the return of venous blood to the chest. The static volume-pressure relationships of the lungs and chest wall vary depending on their state of maturation and health (see Figure 42-4). In the infant, the chest wall generates remarkably little outward recoil within the normal range of breathing volumes.2–5 Because the inward recoil of the lungs varies little with respect to lung size and age during development,6–8 the relaxation volume of the infant’s thorax is proportionally smaller than that of the adult (as shown in Figure 42-4 by the lower intercept of the volume-pressure relationship of the thorax and the ordinate axis). If, as occurs in the adult, the FRC coincided with this relaxation volume (15% of vital capacity compared with 35% in the adult), then the infant would be at a definite disadvantage in terms of alveolar stability and oxygenation. The newborns of most mammalian species, however, have developed physiologic strategies to maintain their FRC above the relaxation volume of the thorax.9 These strategies are generally directed at interrupting expiratory flow before expiration is complete and include shortening of the expiratory time,10 contraction of adductor muscles of the glottis to retard exhalation,11,12 and persistence of the tonic activity of the inspiratory muscles during expiration.13 Being so dependent on the pattern of breathing, the FRC of the newborn and small infant is very vulnerable to changes in muscle coordination and tone. As an example, the decrease of tonic activity of the respiratory and laryngeal muscles associated with rapid eye movement sleep13 may cause a substantial reduction in thoracic lung volume at these ages. Similarly, muscle weakness, anesthesia, deep sedation, and central nervous system depression in general tend to lower FRC below levels compatible with alveolar stability. Under such circumstances, alveoli close, and both the shunt fraction and the work of breathing increase.
Lungs/Chest Wall Interactions
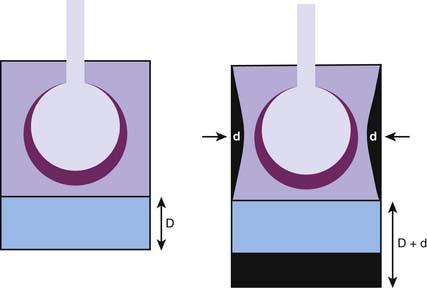
Although, considered in isolation, the lungs and the chest wall have different volume-pressure relationships, their mechanical linkage at the pleural space prevents them from changing volume independently. By sharing a common boundary, the lungs and chest wall are also influenced simultaneously by variations in the pressure at this boundary. The resultant interplay is well illustrated by the effects of a pneumothorax, a complication that is quite familiar to readers who practice intensive care medicine. When a certain volume of air enters the pleural space, the most immediate effect is an increase in the pleural pressure (ΔP). This increase causes the effective transmural pressures of the lungs and chest wall to change by the same absolute amount, but in opposite direction: transpulmonary pressure (PA − Ppl) decreases by -ΔP, whereas chest wall transmural pressure (Ppl) increases by ΔP. No longer held together by a rigid boundary, the lungs and the chest wall respond to the change in transmural pressure by decreasing and increasing volume along their respective volume-pressure relationships (Figure 42-5). Consequently, one could say that the volume of air originally introduced in the pleural cavity is partitioned into two components, one the volume by which the lungs collapse and the other the volume by which the chest wall expands. The relative sizes of the lung collapse and the chest wall expansion are dictated by the volume-pressure relationships of the lungs and chest wall. If the compliance of the chest wall exceeds the compliance of the lungs (as is usually the case in the infant), then the chest wall expands more than the lungs collapse. The difference is even greater when lung compliance is reduced by disease (Figure 42-5, B). Then the chest wall absorbs the majority of the volume change while the lungs barely decrease their volume. This simple analysis explains why noncompliant lungs show surprisingly little collapse when a pneumothorax develops, a finding that is often mistakenly attributed to the “stiffness” of the lung parenchyma. It also provides an opportunity to point out that the magnitude of the chest wall expansion, although frequently overlooked in radiographs, relates more directly to the true malignancy of a pneumothorax (compression of vascular structures) than does the usually more apparent collapse of the lungs.
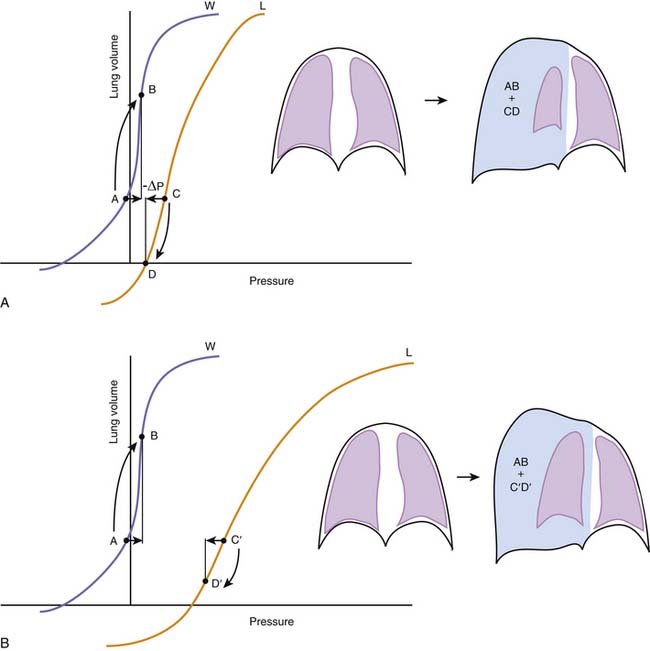
Figure 42–5 A, The effects of a pneumothorax are used here to illustrate the interdependence between the elastic recoils of the lungs and the chest wall. Pressures, on the abscissa, represent the transmural pressures of the lungs (L, PA – Ppl, see Figures 42-2 and 42-3) and chest wall (W, Ppl – PB). The introduction of a volume of gas into the pleural space raises pleural pressure by a magnitude ΔP, which changes both transmural pressures by the same absolute magnitude, but in opposite directions. Lungs and chest wall respond to the change in transmural pressure by decreasing (C→D) and increasing their volume (A→B) along their respective volume-pressure relationships. The volume of the pneumothorax is thus partitioned between the lungs and the chest wall according to their relative compliances. B, When lung compliance is decreased by disease, the volume pressure relationship of the lungs is displaced to the right and has a lower slope. Under these circumstances, the chest wall is forced to accommodate the majority of the volume change introduced by the pneumothorax (AB >> C’D’), giving perhaps the wrong impression that the stiffness of the lungs prevents them from collapsing further.
Dissipative Forces
Dynamic Volume-Pressure Relationships
Analysis of the volume-pressure relationships of the thorax and its components becomes more complicated when we consider the pressure changes generated by gas flow and by the movement of the lung and chest wall tissue as the lungs inflate and deflate. These pressure changes result from molecular interactions between the gas and the airway walls, within the gas stream itself, and among the components of the gas-liquid interface and the tissue. The same interactions are responsible for well-known physical phenomena such as viscosity (the internal resistance of a fluid to flow), turbulence (the development of chaotic movements within a flowing fluid), or viscoelasticity (a property of tissues and fluids that causes their deformations to be time-dependent rather than instantaneous; ketchup provides a good example when it hangs stubbornly to the bottle before being released after multiple taps).14–17
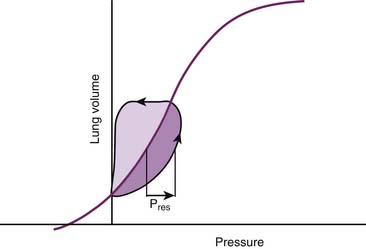
Regardless of their ultimate physical nature, all the phenomena that occupy our attention at this point have two characteristics in common. The first is that they always result in a net loss or dissipation of energy from the respiratory system. The lost energy can no longer be used to perform work, and consequently dissipative pressure losses cause the volume-pressure relationships of the respiratory system to follow a different trajectory depending on the direction of the volume change. This property, known as hysteresis, is responsible for the development of loops when the volume-pressure relationships are plotted continuously during a breath (Figure 42-6). In this graphic representation, the dissipative pressures can be easily identified as the horizontal distance between the volume-pressure tracing and the corresponding point on the elastic volume-pressure relationship. The work done against these pressures can be quantified as the area enclosed by the loop.

where the coefficient R defines the flow resistance of the thorax, lungs, or chest wall. While the concept of resistance is useful as a pulmonary function assessment and reporting tool, the idea of assigning a fix value to R involves a gross oversimplification. Indeed, resistive pressure losses are influenced by factors other than the absolute flow rate, including among others lung volume, flow direction (inspiratory or expiratory), and breathing pattern. An understanding of the role played by these factors during normal breathing provides valuable insights for the recognition and treatment of airway obstruction.
Effect of Flow Rate and Pattern on the Dynamics of the Gas Stream
The airway tree is a complex fractal structure. A particle traveling in the gas stream from the mouth to the alveolus would be likely to encounter obstacles and bifurcations and to experience periods of acceleration and deceleration along the way. Thus in real life, the pressure losses, and thus the amount of work that needs to be done to sustain these losses, is a complex function of flow and geometry. In the simplest of circumstances, a tube with a uniform diameter, gas flow tends to adopt a laminar arrangement with a parabolic velocity profile, whereby the gas molecules in the middle move faster than the ones near the wall, which are slowed down by their viscous interaction with the wall (in fact, the molecules next to the wall do not move at all). Under these circumstances, energy dissipation is minimal and the pressure loss in the tube can be estimated with Pouiselle’s law:

where μ is the viscosity of the gas, L the length, and d the diameter of the tube. It is easy to see that the fraction on the right side of this equation corresponds to the coefficient R in Equation 10.
Airway Dynamics
Indeed, the activity of the respiratory muscles exposes the airways to nonnegligible transmural stresses (or pressures) during breathing (Figure 42-7). The caliber and length of the airways change in response to these stresses in a manner that is only limited by the passive rigidity of its wall tissues and by the tone of the airway intrinsic muscle. Thus airway transmural pressure (the difference between the pressures measured on the inside and outside surface of the airway wall) and airway wall compliance (defined both as compressibility and distensibility) are the two determinants of airway caliber and ultimately also the determinants of airway resistance.
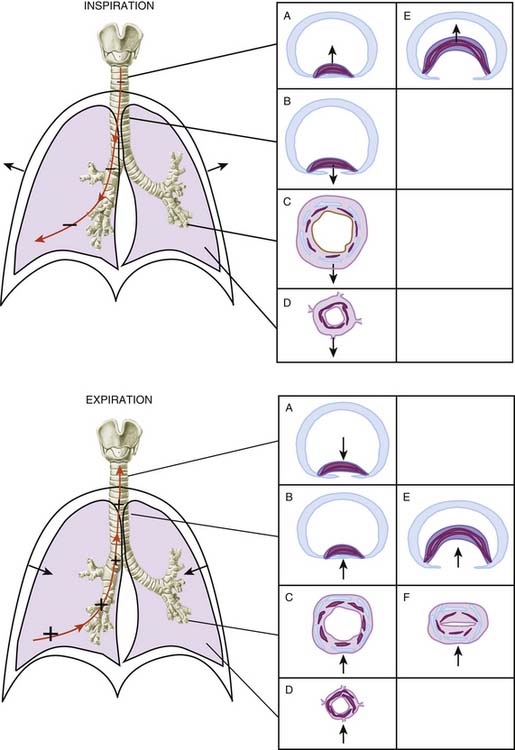
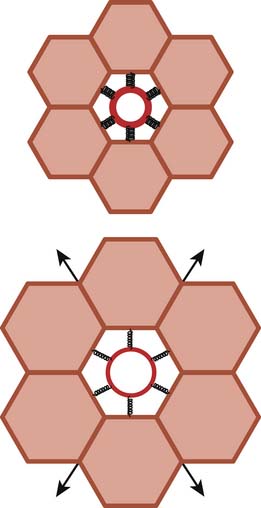
The pressure outside the airways is influenced in a different fashion by inspiration or expiration depending on whether the airways are extrathoracic or intrathoracic. Extrathoracic airways are included in the tissues of the neck, where the pressure can be considered to be atmospheric (at least in nonobese individuals, in whom tissue gravitational forces are neutralized by the skeletal support of the neck). Most of the intrathoracic airways are embedded in the lung tissue, where multiple tethering elements transmit the stresses (or pressures) generated by the tissue recoil to the airway wall (a phenomenon known as pulmonary interdependence,18,19 which is explained visually in Figure 42-8). Therefore the pressure outside the intrapulmonary airways approximates the pleural pressure and, as we have seen, relates to lung volume in a manner that depends on the pressure-volume characteristics of the chest wall (see the section on Lungs/Chest Wall Interactions).
Taking these considerations altogether, it follows that the effect of inspiration and expiration on airway caliber is very different depending on whether the airway is outside or inside the chest cavity. During inspiration, the extrathoracic airways (i.e., the pharynx, larynx, and extrathoracic portion of the trachea) become narrower because the pressure inside their lumen decreases while the pressure immediately outside their walls is constant (pulling the airway wall in, as shown by the direction of the arrow acting on the wall of the trachea in Figure 42-7, top panel A). The intrathoracic airways, however, become dilated because the pressure outside their walls (the pleural pressure) decreases more than the pressure inside their lumen (Figure 42-7, top panel B, C, and D). Conversely, during expiration the extrathoracic airways increase their caliber as their inside pressure becomes positive with respect to atmospheric pressure (pushing the wall out, as also shown by the direction of the arrow in Figure 42-7, bottom panel A) and the intrathoracic airways narrow as their inside pressure decreases with respect to pleural pressure (Figure 42-7, bottom panel B, C, and D).
It is important to understand that the narrowing of the intrathoracic airways during expiration is contingent on the existence of a pressure gradient from the alveoli to the mouth. As predicted by Equation 4, alveolar pressure (PA) must always exceed pleural pressure (Ppl) by a magnitude equivalent to the elastic recoil of the lungs. As the gas progresses downstream during expiration, frictional pressure losses lower the pressure inside the airways. Eventually the cumulative pressure losses can be as large as the pulmonary elastic recoil, and the pressure inside the airways becomes equal to Ppl. Beyond this equal pressure point, airway transmural pressure becomes negative (i.e., the pressure outside exceeds the pressure inside the airway) and acts to collapse the airway. Depending on the airway’s rigidity or compliance (see the following section) and diameter, the interplay between dissipative pressure loss, which increases with flow (Equation 10), and airway collapse, which depends on dissipative pressure loss, can lead to the development of a condition known as flow limitation,20,21 whereby gas flow can no longer increase even if the subject makes a greater effort to raise alveolar pressure. Because the majority of the dissipative pressure losses are related to gas viscosity, this type of flow limitation is known as viscous flow limitation (Figure 42-9).
Flow limitation is an important concept that is pertinent to many clinical situations in which flow is both decreased and effort-independent. It occurs in persons with asthma and other forms of intrathoracic airway obstruction22,23 when the increased effort to exhale does not accelerate lung emptying and is therefore wasted. It also occurs in persons with croup and other forms of extrathoracic airway obstruction when the increased effort to inhale only succeeds in creating more stridor and early respiratory muscle fatigue. However, it is important to point out that not all situations of flow limitation relate to dissipative pressure losses. For more than 30 years we have known that flow in a compliant tube, such as an airway, cannot exceed the minimum flow at which the velocity of a particle suspended in the flow equals the local wave-speed for the tube. The wave-speed is the velocity at which a disturbance travels through the tube, a concept that is familiar to clinicians because the wave-speed is the velocity at which the pulse waveform travels through arteries. Wave-speed flow limitation ultimately results from the coupling of airway compliance and convective acceleration (see Figure 42-9). As the respiratory gas moves through areas of decreasing cross-section, the kinetic energy of the gas increases at the expense of the total energy contained in the flow stream. As a result there is a decrease in the pressure acting on the inner surface of the airway (this decrease is the basis for the Venturi effect), and the transmural pressure of the airway decreases. Once again, if the airway is sufficiently compliant, there is a maximum flow beyond which the inside pressure would decrease faster than can be accommodated by the decrease in cross-sectional area, and flow becomes limited. Regardless of its causal mechanism (viscous or wave-speed), flow limitation occurs at lower flows in the presence of airway obstruction and at low lung volumes, when airway diameter is minimal.
Airway Muscle and Compliance of the Airways
The effect of transmural pressure on the caliber of an airway depends on the mechanical characteristics of the airway itself or, more specifically, on its ability to undergo collapse or distension, a property that is often described as airway wall compliance. The structure of each segment of the airway tree has evolved to minimize luminal distortion in response to the varying stresses that act on the airway wall during breathing. The pharynx and larynx, for example, contain skeletal muscle, which stiffens their walls or dilates the pharyngeal lumen and the glottis during inspiration under the control of cranial nerves IX and X.24 Loss of pharyngeal or laryngeal tone during sleep or after pharmacologic inhibition or injury of the controlling neurons is the most important cause of upper airway obstruction during inspiration.
The smooth muscle of the trachea and bronchi has a similar function. For instance, the trachea is composed of a series of incomplete cartilaginous rings forming a relatively rigid arrangement that resists the collapsing effects of positive intrathoracic pressures during expiration. The rings leave a dorsal gap, where the wall of the trachea is soft. This weak point is bridged by the trachealis muscle, which, upon contracting, can approximate the edges of the cartilage rings and prevent the soft portion of the wall from bulging into the airway lumen (see Figure 42-7). Like the smooth muscle in other airway segments, the trachealis muscle is innervated by local parasympathetic ganglia. The ganglia in turn receive inputs from parasympathetic preganglionic neurons located in the medulla via nerve fibers carried by the vagus nerves.25,26 The medullary preganglionic neurons are anatomically and functionally integrated in the control of breathing.24 As a result, the traffic of impulses reaching the airway ganglia (and thus the tone of the muscle) varies with the phase of the breathing cycle and increases when the respiratory drive is increased, such as during exercise, hypercapnia, or hypoxemia.24,27 Malformations or physical or pharmacologic interventions that disrupt the trachealis muscle or its nerve supply lead to tracheal obstruction when the intrathoracic pressure increases during expiration or when the child cries or exhales forcefully.28 This form of tracheal obstruction often is attributed to tracheomalacia, even though no true softening of the tracheal cartilage occurs.
The bronchial smooth muscle also is innervated by the parasympathetic system.26,29 In cartilaginous bronchi, the stiffening effect of the muscle contraction is augmented by the cartilage and prevents the bronchial lumen from collapsing when the transmural pressure decreases during expiration, coughing, or crying. In bronchioles, which in humans lack cartilage, contraction of the smooth muscle stiffens the airway walls as well. However, in these smaller airways, smooth muscle contraction may have a more important function of preventing excessive airway distension during inspiration, when the stressed transmitted to the airway wall may disrupt the delicate bronchiolar structure.
Airway Obstruction
When the obstruction is intrathoracic (e.g., as occurs with extrinsic compression of the trachea and bronchi, tracheobronchomalacia, and asthma), during inspiration the pressure inside the airways downstream from the obstruction has to become more negative than that inside the airways upstream. However, no matter how negative it is, the pressure inside the airways still must be less negative than the pleural pressure (Equations 3 and 4) because otherwise the lung recoil (PA – Ppl) would be negative, which is unimaginable. Thus during inspiration the transmural pressure of intrathoracic airways remains always positive. In contrast, during expiration the pressure inside the airway segment located between the obstruction and the thoracic outlet may become lower than pleural pressure at some point (see the section on Airway Dynamics). This situation, coupled with the convective acceleration of flow at the obstructed segments, causes these airways to collapse and produce high-pitched vibrations (wheezing), expiratory delay, and dynamic hyperinflation.
A Specific Case Study in Airway Mechanics: Mechanical Ventilation
The application of positive pressure in the airways changes the balance of pressures that determines airway caliber. When positive end-expiratory pressure (PEEP) is used, pressure inside the airways is positive (relative to atmospheric pressure) during the entire respiratory cycle. As a result, any portion of the extrathoracic airway that is not bypassed by an endotracheal tube (or the entire extrathoracic airway when mask ventilation is used) is exposed to transmural stresses that cannot have anything but a dilating effect during both inspiration and expiration. The pressure inside the intrathoracic airways also increases with respect to pleural pressure, with the difference between these two pressures varying as a function of the increase in elastic lung recoil produced by the inflation. For this reason, PEEP has been proposed as a therapy to decrease airway resistance and gas trapping in patients with intrathoracic airway obstruction.30–33 Although PEEP is beneficial in some of these patients, in others, it increases lung volume,34 interferes with cardiovascular function, and ultimately decreases oxygen delivery to the tissues.35 The individual variations in the response to PEEP of patients with airway obstruction may simply reflect differences in the mechanisms of dynamic hyperinflation.32 In patients who have gas trapping without expiratory flow limitation, proximal airway pressures (and thus also PEEP) are transmitted faithfully to the alveoli. As a result, their lung hyperinflation worsens. By contrast, in patients who have both gas trapping and expiratory flow limitation, PEEP may not affect the pressures upstream of the flow-limiting point; therefore, alveolar pressure and lung volume may not increase as much. The pressures inside the airways and downstream of the flow-limiting point increase, dilating the airway cross-section and thereby increasing the rate of lung emptying. Although PEEP is not recommended in every patient, its judicious use may be considered, under careful monitoring, to improve the mechanical function of the lungs of some selected infants and children with severe obstructive airway disease.
Determinants of Regional Gas Flow Distribution in the Lungs
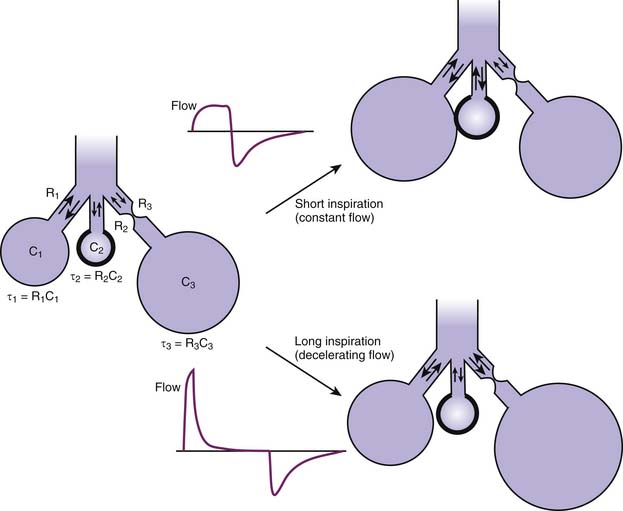
From a mechanical perspective, the lungs form a parallel arrangement of acinary or multialveolar units, each supported by a conducting airway. The development of inequalities in the mechanical and gas-exchanging functions of these units is a fundamental factor in the manifestations of lung disease. To understand how mechanical inequality affects the distribution of ventilation in the lungs, it is essential to realize that the potential filling volume of any alveolar unit is determined by the unit’s compliance. However, the actual filling volume during a breath depends on the rate at which the unit can fill relative to other units.36 This rate is a function of the unit’s compliance and resistance and often is defined by their product, a constant with the dimension of time known as the time constant (represented by the Greek letter τ).
The mathematical formulations that describe the distribution of flow among units with different time constants can be very complex. However, it is possible to make some basic predictions of how a certain flow pattern will influence the distribution of tidal volume among these units.17,37 Imagine a simplified lung composed of three units (Figure 42-10), one with a normal compliance and resistance (normal τ), another with a low compliance and a normal resistance (short τ), and the third with a normal compliance and a high resistance (long τ). As long as the inspiratory time is sufficiently long to allow equilibration of alveolar pressures within the lungs, a decelerating inspiratory flow pattern (pressure-controlled ventilation) will inflate all three units proportionally to their compliances, thus favoring the two units with normal compliance. If the inspiratory time is shortened, however, gas is still flowing at the end of inspiration. This situation results in pressure and inflation inequalities among the units, with a disproportionate portion of the tidal volume being directed to units with a short time constant (once again proportionally to their compliance) and away from the unit supplied by an obstructed airway. The effect of such redistribution on gas exchange depends on the blood supply received by each type of unit and therefore is difficult to predict in diseased lungs. However, the astute clinician may derive some insight into the mechanism of a given patient’s gas exchange abnormalities by observing carefully the changes induced by variations in the flow rate and duration of inspiration during mechanical ventilation.
Restrictive and Obstructive Respiratory Disease
As seen, inertial pressure losses are relatively insignificant at normal breathing frequencies in children, and viscoelastic pressure losses usually are small and lumped together with other dissipative pressure losses. Therefore the pressure that the respiratory muscles must generate to produce a certain volume excursion of the thorax can be simply considered the sum of elastic and resistive pressures that need to be overcome in the process (see Equations 6 and 7). Because work is calculated by integrating these pressures relative to the same volume change, it immediately follows that the total work done by the respiratory muscles is the sum of the works done to overcome elastic and resistive pressures.
The term restrictive respiratory disease encompasses all conditions in which elastic or nondissipative work is primarily increased. One could also say that restrictive disease is caused by a decrease in thoracic compliance. Whether originating in the lungs or the chest wall, a decrease in thoracic compliance has two important mechanical consequences. First, the work of breathing increases, but only during inspiration; expiration continues to be passive and, in fact, takes place at a faster rate as elastic recoil increases. Second, the relaxation volume of the thorax and the FRC decrease. The resultant decrease in lung volume, which may further reduce lung compliance, may be more pronounced in the infant, whose resting relaxation volume is already low. At low lung volumes, alveoli lack the support provided by the recoil of neighboring structures at higher volumes (mechanical interdependence18) and become inherently unstable, particularly if the surfactant system is affected by the disease and surface tension is increased. To prevent alveolar collapse, infants and small children with restrictive respiratory disease often close their glottis toward the end of expiration, causing each breath to end in a grunt. PEEP and continuous positive airway pressure are effective therapeutic modalities to achieve the same objective of preserving the end-expiratory inflation volume.38–41 Deep lung inflations during positive pressure ventilation (often described as recruitment maneuvers) also may maintain unstable alveoli open for a period. This effect of volume history on alveolar volume decreases the work needed for spontaneous breaths following the inflation and explains some of the beneficial effects of intermittent mandatory ventilation in patients with restrictive lung disease.
Obstructive respiratory disease includes all conditions in which resistive or dissipative work is predominantly increased. The small caliber and high wall compliance of the developing airways render the infant and child more vulnerable to the development of airway obstruction.42,43 Under normal breathing conditions the small caliber of the airways represents no mechanical disadvantage because there is good correspondence between airway cross-sectional area and gas flow. When obstruction develops, however, airway resistance increases as an exponential function of the reduction in airway diameter (see Equation 11). Because the same absolute decrease in caliber causes a much greater proportional reduction in airway diameter in a small than in a large airway, obstructive lesions tend to have more severe consequences in children than in adults.
Determinants of Respiratory Efficiency
In the final analysis, the success or failure of the compensatory effort is a simple matter of balance between the energy resources available to the respiratory muscles and the energy demands imposed on these muscles. The energy resources are relatively well defined and limited by the blood supply of the muscles, their ability to metabolize substrates, and the internal efficiency of the muscle’s metabolic apparatus. The energy demands on the respiratory muscles are more variable, however, and depend on the workload these muscles must perform per unit of time (i.e., the power they must generate) and the overall efficiency with which the work is performed.
In thermodynamic terms, efficiency is defined as the proportion of the free energy available within a system that is transformed into external work (Equation 1). In the case of the respiratory system, this notion can be reshaped to define efficiency as the quotient of breathing power (W × t) divided by respiratory muscle energy consumption.
In practice, the breathing power has to be calculated from the volume-pressure relationships of the lungs in spontaneously breathing subjects. The energy consumption of the respiratory muscles is in turn estimated from their oxygen consumption,44 computed as the difference between the total body oxygen consumptions measured during spontaneous and supported ventilation. Some obvious sources of energy consumption, which are not included in the breathing power, reduce the respiratory system’s efficiency. For example, the work of breathing does not account for isometric activity of the respiratory and postural muscles, which is not proper work in a physical sense (no volume change) but consumes energy. Other forms of volume-pressure work usually are not taken into account when calculating respiratory efficiency, so they also become sources of apparent inefficiency. The work performed to inflate the chest wall, for instance, cannot be determined during spontaneous breathing when contraction of the muscles changes the wall’s passive properties (see the section on Volume-Pressure Relationships). Similarly, the work done to deform the rib cage is difficult to measure and often is ignored. Thus it is not surprising that the published efficiencies tend to be artifactually low.45,46
As defined here, the poor overall efficiency of the respiratory system implies that, during each breathing cycle, a substantial amount of energy derived from metabolic substrates is dissipated as heat and cannot be converted into volume-pressure work. Respiratory disease can increase this energy dissipation by various mechanisms, leading to efficiency values as low as 1% to 3%.45,47,48 Disease-induced alterations in chest wall configuration, for example, can limit force generation by the muscles, thus interfering with the transformation of chemical energy into mechanical energy.49 Changes in the geometry of the chest wall also modify the spatial relationships of the muscles and can interfere with the transformation of mechanical energy into work. Finally, disease-related anomalies in the contractile state of the muscles produced by fatigue or poor nutrition further decrease muscle force and the work of breathing without decreasing muscle energy demands.50–52
Power of Breathing and Breathing Frequency
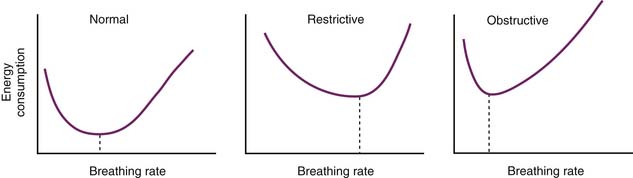
Unlike work, which is a function of the volume-pressure characteristics of the thorax, respiratory power (work/time) is influenced by the pattern of breathing. It has been held for some time that, at any given time, each subject has an optimal breathing frequency at which minimum power, and thus a minimum energy consumption, is necessary to attain a certain minute alveolar ventilation (Figure 42-11).46,53,54 Although this view has been challenged by those who believe that breathing frequency is adjusted to minimize average muscle force rather than power (after all, there are no known energy or power receptors anywhere in the body),55 it is a common clinical observation that different types of mechanical derangement result in distinctive patterns of breathing. These patterns generally agree with the principle of minimal power expenditure. For instance, patients with restrictive lung disease breathe rapidly and shallowly. In contrast, patients with airway obstruction breathe more slowly and prolong their inspiration or expiration, depending on whether the obstruction is extrathoracic or intrathoracic. By simply inspecting the effort and frequency of the breathing movements, the clinician can therefore assess not only the severity but also the specific nature of a patient’s respiratory dysfunction. It is important to remember, however, that the high ratio of dead space to minute ventilation in infants and small children mandates a relatively high breathing frequency at rest, even in the presence of airway obstruction. Nevertheless, severe tachypnea in a child with obstructive airway disease should always raise suspicions of an associated restrictive impairment. This distinction is best clarified by the following examples. A breathing frequency of 40 breaths/min can be considered low for a 3-month-old infant who has severe respiratory difficulty from bronchiolitis and is consistent with a predominantly obstructive dysfunction. On the contrary, a frequency of 100 breaths/min in the same infant would be indicative of a predominantly restrictive dysfunction, caused by either parenchymal involvement in the disease (e.g., pneumonitis or collapse) or severe distension of the lungs and chest wall caused by pulmonary hyperinflation.
Alterations in Chest Wall Configuration
Diaphragmatic Configuration
The amount of force developed by a muscle depends on its resting length. An optimal resting length for which maximal force is developed can be defined for each muscle. In the case of the diaphragm, the optimal length is attained at thoracic volumes close to the normal FRC. At these volumes, the muscle has the shape of a dome-capped cylinder, a configuration that has several advantages. First, diaphragmatic contraction shortens the cylinder in the axial direction,56 producing a pistonlike motion that displaces more volume than if the diaphragmatic dome simply became flatter (assuming the same degree of fiber shortening). Second, the descent of the diaphragmatic dome increases the surface of contact between the rib cage and the lungs. Therefore the increase in lung surface produced by lung inflation can be accommodated without changing the shape of the lung or the chest wall. Finally, at normal breathing volumes, the sides of the diaphragmatic cylinder are apposed to the internal surface of the rib cage. This area of apposition establishes a mechanical link between intraabdominal pressure and lung volume.52,57 As the diaphragm contracts during inspiration, intraabdominal pressure increases, pushing the lower portion of the rib cage forward and laterally. Thus diaphragmatic contraction has an additional contribution to lung inflation at low energy cost and may help to stabilize the lower rib cage against inspiratory distortion.58
The configuration of the chest in the infant and small child minimizes these advantages. At these ages, the lower portion of the infant’s rib cage has large anteroposterior and lateral diameters. As a result, the insertions of the diaphragm are spread out, thereby reducing the axial shortening range of the muscle. Moreover, the lack of a substantial area of apposition of the diaphragm and rib cage abolishes the inspiratory and stabilizing effects of intraabdominal pressure on the rib cage.52
Rib Cage Distortion
Until now, we have assumed that the rib cage and abdomen have the same configuration during spontaneous breathing and passive inflation-deflation maneuvers. This assumption implies that all the various parts of the chest wall move with a single degree of freedom and that there are no volume shifts between parts. However, it has been known for quite some time that, under certain conditions, the rib cage and abdomen can change volume independently of one another and even in opposite directions.59 In other words, the chest wall has multiple degrees of freedom and can undergo regional distortion.
The developing chest wall is particularly susceptible to distortion. As we have seen, the rib cage is very compliant in the newborn.3,5,60 Although this high compliance facilitates passage through the birth canal, it also promotes distortion of the rib cage during inspiration. In addition, the intercostal muscles, whose main contribution to breathing is to stabilize the rib cage by contracting simultaneously with the diaphragm, appear to have decreased tone at early ages, especially during rapid eye movement sleep and in preterm infants.61 Finally, the lack of a substantial area of apposition between the diaphragm and the rib cage removes the stabilizing effect of the intraabdominal pressure on the lower rib cage. Accordingly, in infants chest wall retractions tend to develop in the presence of minimal mechanical lung dysfunction.

Consequently, if ΔVL is to remain constant, decreases in ΔVrc caused by rib cage retractions during inspiration must be accompanied by a proportional increase in ΔVab (Figure 42-12). If, as often occurs, ΔVrc is negative, then ΔVab becomes greater than ΔVL. Because the volume displacement of the diaphragm approximates ΔVab, chest wall retractions inevitably result in an increase in the diaphragmatic excursion.
The amount of work done by the diaphragm is calculated by integrating the pressure developed by the muscle relative to the volume displacement produced by the diaphragmatic contraction. In practical terms, the pressure developed by the diaphragm or transdiaphragmatic pressure is defined as the difference between the intraabdominal pressure (Pab, often estimated from measurements of gastric pressure) and the pleural pressure (Ppl, estimated from the esophageal pressure). The volume displaced by the diaphragm is estimated as ΔVab in Equation 12.62 Thus diaphragmatic work (Wdi) can be computed as:
The work done on the airways and lungs to move gas in and out of the alveoli (see Equations 3 and 4) is:
Pab is generally greater than PM (which is 0 in the absence of positive airway pressure), particularly in a recumbent subject. In the presence of rib cage retractions, dVab greatly exceeds dVL, and consequently Wdi substantially exceeds WL. The volume displacement of the diaphragm may be up to twice the tidal volume of the lungs in premature infants without apparent lung disease,63 an increase that could be responsible for the poor weight gain and development of fatigue of infants recovering from the respiratory distress syndrome.
Alterations in Contractile State of the Respiratory Muscles
Respiratory efficiency is affected by the functional state of the respiratory muscles. Sustained increases in activity likely will eventually result in decreased contractile force and lower minute alveolar ventilation, a condition often classified as muscle fatigue. When muscle fatigue is present, the energy consumption of the muscle may be increased with respect to the actual work performed. Similar decreases in contractility without a decrease in energy consumption can be present in a variety of clinical situations. Some result from an imbalance between the energy demands of the muscle’s contractile machinery and its substrate availability (e.g., shock64,65). Others are simply the expression of the inadequate coupling of the excitation-contraction processes inside the muscle cell, changes in the recruitment of specific fiber populations within the muscle,66 or chronic depletion of the muscle’s energetic resources as a result of malnutrition.50–52
1. Salazar E., Knowles J.H. An analysis of pressure-volume characteristics of the lungs. J Appl Physiol. 1964;19:97-104.
2. Agostoni E., Hyatt R. Static behavior of the respiratory system. In: Macklem P., Mead J., editors. Mechanics of breathing. Bethesda, MD: American Physiological Society; 1986:113-130.
3. Gerhardt T., Bancalari E. Chest wall compliance in full-term and premature infants. Acta Paediatr Scand. 1980;69:359-364.
4. Papastamelos C., Panitch H.B., England S.E., et al. Developmental changes in chest wall compliance in infancy and early childhood. J Appl Physiol. 1995;78:179-184.
5. Richards C.C., Bachman L. Lung and chest wall compliance of apneic paralyzed infants. J Clin Invest. 1961;40:273-278.
6. Fagan D.G. Post-mortem studies of the semistatic volume-pressure characteristics of infants’ lungs. Thorax. 1976;31:534-543.
7. Fagan D.G. Shape changes in static V-P loops from children’s lungs related to growth. Thorax. 1977;32:198-202.
8. Stigol L.C., Vawter G.F., Mead J. Studies on elastic recoil of the lung in a pediatric population. Am Rev Respir Dis. 1972;105:552-563.
9. Mortola J.P. Dynamics of breathing in newborn mammals. Physiol Rev. 1987;67:187-243.
10. Olinsky A., Bryan M.H., Bryan A.C. Influence of lung inflation on respiratory control in neonates. J Appl Physiol. 1974;36:426-429.
11. Eichenwald E.C., Ungarelli R.A., Stark A.R. Hypercapnia increases expiratory braking in preterm infants. J Appl Physiol. 1993;75:2665-2670.
12. Fisher J.T., Mortola J.P., Smith J.B., et al. Respiration in newborns: development of the control of breathing. Am Rev Respir Dis. 1982;125:650-657.
13. Muller N., Volgyesi G., Becker L., et al. Diaphragmatic muscle tone. J Appl Physiol. 1979;47:279-284.
14. Bachofen H., Duc G. Lung tissue resistance in healthy children. Pediatr Res. 1968;2:119-124.
15. Ludwig M.S., Dreshaj I., Solway J., et al. Partitioning of pulmonary resistance during constriction in the dog: effects of volume history. J Appl Physiol. 1987;62:807-815.
16. Pérez Fontán J.J. Ray AO: Vagal control of central and peripheral pulmonary resistance in developing piglets. J Appl Physiol. 1991;70:1617-1626.
17. Pérez Fontán J.J., Ray A.O. Oxland TR: Stress relaxation of the respiratory system in developing piglets. J Appl Physiol. 1992;73:1297-1309.
18. Mead J., Takishima T., Leith D. Stress distribution in lungs: a model of pulmonary elasticity. J Appl Physiol. 1970;28:596-608.
19. Mead J., Turner J.M., Macklem P.T., et al. Significance of the relationship between lung recoil and maximum expiratory flow. J Appl Physiol. 1967;22:95-108.
20. Dawson S., Elliot E.A. Wave-speed limitation on expiratory flow: a unifying concept. J Appl Physiol. 1977;43:498-515.
21. Wilson T., Rodarte J., Butler J. Wave-speed and viscous flow limitation. In: Macklem P., Mead J., editors. Handbook of physiology: respiration. Bethesda, MD: American Physiological Society, 1986.
22. Turner S.W., Palmer L.J., Rye P.J., et al. Infants with flow limitation at 4 weeks: outcome at 6 and 11 years. Am J Respir Crit Care Med. 2002;165:1294-1298.
23. Jones M.H., Davis S.D., Kisling J.A., et al. Flow limitation in infants assessed by negative expiratory pressure. Am J Respir Crit Care Med. 2000;161:713-717.
24. Pérez Fontán J.J., Kinloch L.P. Donnelly DF: Integration of bronchomotor and ventilatory responses to chemoreceptor stimulation in developing sheep. Respir Physiol. 1998;111:1-13.
25. Pérez Fontán J.J., Velloff C.R. Neuroanatomical organization of the parasympathetic bronchomotor system in developing sheep. Am J Physiol. 273, 1997. R121–R33
26. Pérez Fontán J.J., Velloff C.R. Localization of vagal motoneurons and central afferents after application of cholera toxin B-subunit to the airway mucosa. Am J Physiol. 2001;280:L152-L164.
27. Richardson C.A., Herbert D.A., Mitchell R.A. Modulation of pulmonary stretch receptors and airway resistance by parasympathetic efferents. J Appl Physiol. 1984;57:1842-1849.
28. Rock J.R., Futtner C.R., Harfe B.D. The transmembrane protein TMEM16A is required for normal development of the murine trachea. Dev Biol. 2008;321:141-149.
29. Perez Fontan J.J., Velloff C.R. Labeling of vagal motoneurons and central afferents after injection of cholera toxin B into the airway lumen. Am J Physiol Lung Cell Mol Physiol. 2001;280:L152-L164.
30. Barach A., Swenson P. Effect of breathing gases under positive pressure on lumens of small and medium-sized bronchi. Arch Intern Med. 1939;63:946-948.
31. Calverley P.M., Koulouris N.G. Flow limitation and dynamic hyperinflation: key concepts in modern respiratory physiology. Eur Respir J. 2005;25:186-199.
32. Marini J.J. Should PEEP be used in airflow obstruction? Am Rev Respir Dis. 1989;140:1-3.
33. Martin J.G., Shore S., Engel L.A. Effect of continuous positive airway pressure on respiratory mechanics and pattern of breathing in induced asthma. Am Rev Respir Dis. 1982;126:812-817.
34. Smith P.G., el-Khatib M.F., Carlo W.A. PEEP does not improve pulmonary mechanics in infants with bronchiolitis. Am Rev Respir Dis. 1993;147:1295-1298.
35. Tuxen D.V. Detrimental effects of positive end-expiratory pressure during controlled mechanical ventilation of patients with severe airflow obstruction. Am Rev Respir Dis. 1989;140:5-9.
36. Otis A.B., McKerrow C.B., Bartlett R.A., et al. Mechanical factors in distribution of pulmonary ventilation. J Appl Physiol. 1956;8:427-443.
37. Bates J.H., Rossi A., Milic-Emili J. Analysis of the behavior of the respiratory system with constant inspiratory flow. J Appl Physiol. 1985;58:1840-1848.
38. Dueck R., Wagner P.D., West J.B. Effects of positive end-expiratory pressure on gas exchange in dogs with normal and edematous lungs. Anesthesiology. 1977;47:359-366.
39. Katz J.A., Ozanne G.M., Zinn S.E., et al. Time course and mechanisms of lung-volume increase with PEEP in acute pulmonary failure. Anesthesiology. 1981;54:9-16.
40. Kumar A., Falke K.J., Geffin B., et al. Continuous positive-pressure ventilation in acute respiratory failure. N Engl J Med. 1970;283:1430-1436.
41. Suter P.M., Fairley B., Isenberg M.D. Optimum end-expiratory airway pressure in patients with acute pulmonary failure. N Engl J Med. 1975;292:284-289.
42. Martin H.B., Proctor D.F. Pressure-volume measurements on dog bronchi. J Appl Physiol. 1958;13:337-343.
43. Shaffer T.H., Bhutani V.K., Wolfson M.R., et al. In vivo mechanical properties of the developing airway. Pediatr Res. 1989;25:143-146.
44. Campbell E.J., Westlake E.K., Cherniack R.M. The oxygen consumption and efficiency of the respiratory muscles of young male subjects. Clin Sci (Lond). 1959;18:55-64.
45. Cherniack R.M. The oxygen consumption and efficiency of the respiratory muscles in health and emphysema. J Clin Invest. 1959;38:494-499.
46. Milic-Emili J., Petit J. Mechanical efficiency of breathing. J Appl Physiol. 1960;15:359-362.
47. Fritts H.W.Jr., Filler J., Fishman A.P., et al. The efficiency of ventilation during voluntary hyperpnea: studies in normal subjects and in dyspneic patients with either chronic pulmonary emphysema or obesity. J Clin Invest. 1959;38:1339-1348.
48. Thibeault D.W., Clutario B., Awld P.A. The oxygen cost of breathing in the premature infant. Pediatrics. 1966;37:954-959.
49. Finucane K.E., Panizza J.A., Singh B. Efficiency of the normal human diaphragm with hyperinflation. J Appl Physiol. 2005;99:1402-1411.
50. Donahoe M., Rogers R.M., Wilson D.O., et al. Oxygen consumption of the respiratory muscles in normal and in malnourished patients with chronic obstructive pulmonary disease. Am Rev Respir Dis. 1989;140:385-391.
51. Larson D.E., Hesslink R.L., Hrovat M.I., et al. Dietary effects on exercising muscle metabolism and performance by 31P-MRS. J Appl Physiol. 1994;77:1108-1115.
52. White P., Cattaneo D., Dauncey M.J. Postnatal regulation of myosin heavy chain isoform expression and metabolic enzyme activity by nutrition. Br J Nutr. 2000;84:185-194.
53. Crossfill M., Widdicombe J. Physical characteristics of the chest and lungs and the work of breathing in different mammalian species. J Physiol (Lond). 1961;158:1-14.
54. Mc Ilroy M., Marshall R., Christie R.V. The work of breathing in normal subjects. Clin Sci (Lond). 1954;13:127-136.
55. Mead J. Control of respiratory frequency. J Appl Physiol. 1960;15:325-336.
56. Braun N.M., Arora N.S., Rochester D.F. Force-length relationship of the normal human diaphragm. J Appl Physiol. 1982;53:405-412.
57. Mead J. Functional significance of the area of apposition of diaphragm to rib cage. Am Rev Respir Dis. 1979;119:31-32. (proceedings)
58. Cassart M., Hamacher J., Verbandt Y., et al. Effects of lung volume reduction surgery for emphysema on diaphragm dimensions and configuration. Am J Respir Crit Care Med. 2001;163:1171-1175.
59. Konno K., Mead J. Measurement of the separate volume changes of rib cage and abdomen during breathing. J Appl Physiol. 1967;22:407-422.
60. Heldt G.P., McIlroy M.B. Dynamics of chest wall in preterm infants. J Appl Physiol. 1987;62:170-174.
61. Henderson-Smart D.J., Read D.J. Reduced lung volume during behavioral active sleep in the newborn. J Appl Physiol. 1979;46:1081-1085.
62. Aliverti A., Ghidoli G., Dellaca R., et al. Chest wall kinematic determinants of diaphragm length by optoelectronic plethysmography and ultrasonography. J Appl Physiol. 2003;94:621-630.
63. Heldt G.P., McIlroy M.B. Distortion of chest wall and work of diaphragm in preterm infants. J Appl Physiol. 1987;62:164-169.
64. Aubier M., Trippenbach T., Roussos C. Respiratory muscle fatigue during cardiogenic shock. J Appl Physiol. 1981;51:499-508.
65. Lanone S., Taille C., Boczkowski J., et al. Diaphragmatic fatigue during sepsis and septic shock. Intensive Care Med. 2005;31:1611-1617.
66. Coirault C., Chemla D., Pery-Man N., et al. Effects of fatigue on force-velocity relation of diaphragm: energetic implications. Am J Respir Crit Care Med. 1995;151:123-128.
[/level-membership-for-pediatrics-category][not-level-membership-for-pediatrics-category]
Chapter 42 Mechanical Dysfunction of the Respiratory System
Work, Power, and Energy Expenditure in the Respiratory System
In simple intuitive terms, the variable that best sums up the function of a muscle-powered pump is the mechanical load that the contraction of the powering muscles must overcome with each pump cycle. Over time, mechanical load translates into power (the product of work by the time that it takes to carry it out) and energy expenditure. Accordingly, whether the respiratory muscles can carry a given mechanical load is ultimately determined by their ability to generate work from the limited amount of energy that they receive from their blood supply. The first law of thermodynamics stipulates that when a certain amount of energy is added to a closed system by an external source (in this case the metabolism of fuels supplied by the circulation to the respiratory muscles), the resultant change in the system’s internal energy may either be applied to perform external work (W) over a period of time (t) or is dissipated as heat (Q). Implicit in this statement is the fact that only a portion of the energy that the respiratory muscles derive from metabolic substrates is transformed into respiratory work. This proportion varies depending on the system’s efficiency (E), defined as:
Determinants of Respiratory Work
Every high school physics student learns to calculate the external work done to move an object between two points as the product of the force needed to overcome all resistances to the movement by the distance between the points. Because the force may change along the way, the same student may learn at some point that it is more precise to break the movement into many elementary components and then add up all the work components by integration, as shown in Figure 42-1, A.
The mathematical subtleties of this distinction may become a little clearer if we compare the breath to the action of a syringe, where, by pushing or pulling on the plunger, we create a pressure (P), positive or negative, that has the effect of changing the volume contained in the barrel (V). The work done in this process can be determined by integrating the product P · dV, as shown in Figure 42-1, B. The obvious corollary is that the work done by the respiratory muscles and, by extension, the energy that must be supplied to these muscles are both defined by the volume-pressure relationships of the lungs and the chest wall.
Volume-Pressure Relationships
The pressures needed to inflate the thorax, the lungs, and the chest wall are, however, different from each other. Respiratory physiologists have traditionally approached the analysis of these pressures by taking an imaginary walk from the mouth down the airways to the alveolus, across the lung tissue and visceral pleura to the pleural space, and finally across the chest wall to the surface of the chest (Figure 42-2). The difference between the pressures measured at two consecutive stops is the driving pressure needed to cause or maintain a certain volume displacement:
Consider first a situation in which the lungs undergo passive distention, without participation of the respiratory muscles. This is what happens during positive airway pressure ventilation, when the pressure drive for inflation of the thorax is provided by PM. By performing a series of substitutions in equations 3through 5 and assuming PB = 0, we can easily arrive to the following equality:
which reveals that, from a mechanical point of view, the components of the respiratory system form a series arrangement, whereby the total pressure needed to generate a movement is the sum of the pressures generated in the airways, the lungs, and the chest wall. Respiratory physiologists have often borrowed from electrical theory, assuming, perhaps to the dismay of many readers, that the black and white simplicity of electrical circuitry is less intimidating than the complexities of Newtonian mechanics. When speaking of electrical circuits, the term series indicates that every element in the circuit experiences the same current as the circuit as a whole, but the total voltage across the circuit is the sum of the voltages across the individual elements. Because current is the electrical analog of flow (volume per unit of time) and voltage is the analog of pressure, it is easy to see how Equations 2 and 6 justify the overall electrical analogy, even though many readers may be less impressed by how much conceptual clarity it sheds for them.
The mechanical behavior of the airways and the lungs does not change substantially during muscle-powered breathing. The behavior of the chest wall, on the other hand, is greatly influenced by the contraction of the respiratory muscles. Because the muscles not only act on the wall but are also part of the wall itself, any attempt to define mathematically the behavior of the chest wall during a spontaneous breath becomes a futile exercise. For our purposes here, however, it may suffice to say that, during spontaneous breathing, equation 6 can be modified as:
where Pmus represents the pressure generated by the muscles’ contraction, inclusive of the effects that this contraction has on the behavior of the chest wall itself. Thus every time we take a breath, the neural output to the respiratory muscles is adjusted to overcome as precisely as possible the opposing pressures generated by the respiratory system.
Nature of the Mechanical Forces Acting on the Respiratory Pump
Disease induces alterations in these physical processes and therefore also in the forces and pressures that result from them. To relate these alterations to the disease’s clinical manifestations, it is helpful to classify both processes and pressures into nondissipative and dissipative, depending on whether the energy consumed stays in or leaves the system. For instance, elasticity is typically a nondissipative process because the energy needed to produce elastic deformation during inspiration is accumulated in the tissues and then used to empty the lungs during expiration. In contrast, all resistive processes are dissipative: the energy liberated by the friction of the gas against the airway walls or by the molecular interactions within the tissue is transformed into heat and transported outside of the system by the blood or the expired gas.
Nondissipative Phenomena: Elastic Behavior of the Respiratory System
By obtaining measurements at various volumes and then plotting volume against PA, PL, and PW, we can compare the volume-pressure relationships of the thorax as a whole with those of the lungs and the chest wall. Not unexpectedly given the heterogeneous composition of the structures involved, the relationships are complex and cannot be described in a simple mathematical equation (Figure 42-3). In all three cases, the plotted curve has a sigmoidlike shape, with pressure increasing rapidly relative to volume at low and high volumes and more slowly at middle volumes.1
Figure 42–3 Idealized representation of the static volume-pressure relationships of the thorax (TH), lungs (L), and chest wall (W). Pressure, on the abscissa, represents the pressure across the thorax as a whole (PTH = PA – PB), lungs (PL = PA – PL), and chest wall (PW = Ppl – PB; see Figure 42-2). The arrows indicate the magnitude and direction of the pressures acting on the thorax and its components at two volumes: (1) the relaxation volume of the thorax, where the recoils of the lung and the chest wall neutralize each other; and (2) an arbitrary volume where the recoils of the lungs and the chest wall act both in the direction of reducing thoracic volume. Inset: Detail of the same curves, indicating the elastic work done on the thorax as a whole and each of its components for a volume displacement starting at a volume A (the relaxation volume of the thorax) and ending at a volume C. The work done on the thorax as a whole is represented by the area A-B-C; the work done on the lungs by A-AL-BL-C; and the work done on the chest wall by AW-A-BW-C. A portion of the work done on the chest wall (the triangular area in purple between AW and the ordinate axis) is contributed by the recoil of the chest wall, which between those points facilitates the action of the respiratory muscles.
Being a continuous function, each volume-pressure relationship has a defined slope at any given volume (dV/dP). This slope defines the compliance of the thorax, lungs, or chest wall for that particular volume, depending on whether dP is replaced by dPA, dPL, or dPW. Although a cursory examination of Figure 42-3 reveals that both the lung and chest wall compliances defined in this manner vary markedly over the entire range of volumes, on closer inspection, the ratio dV/dP is relatively constant at normal breathing volumes. Thus for these volumes, it is safe to write:
where ΔPel represents the change in elastic recoil pressure of the thorax (ΔPA), lungs (ΔPL), or chest wall (ΔPW) for a lung volume excursion ΔV, and C is the compliance of the corresponding component. As lung volume decreases or increases beyond this linear range, dV/dP starts to decrease in a volume-dependent manner, and the respiratory muscles must generate progressively larger pressures to produce the same volume change. Disease frequently causes the lungs to operate outside of their linear volume-pressure range, thereby increasing both the work of breathing and the energy needed to do it.
At any given volume, the lungs, the chest wall, and the thorax each generate a certain elastic pressure or recoil. This recoil can act to increase or decrease volume (as indicated by the direction of the arrows in Figure 42-4). By definition, elastic recoil drives the thorax and its individual components to adopt a volume, known as the relaxation volume, at which recoil itself is extinguished. The relaxation volumes of the lungs and the chest wall are the volumes that each of these components would adopt if all the mechanical constraints imposed by their mutual attachments and interactions were removed. The relaxation volume of the thorax, in contrast, is defined by the mechanical interaction of the lungs and the chest wall. It coincides with the point at which the opposing elastic recoils of these two components neutralize each other (as shown by the equal magnitude but opposite pressure vectors in Figure 42-4).
In the adult, the relaxation volume of the lungs is lower than the residual volume (the volume of gas contained in the lungs at the end of a forced expiration). The relaxation volume of the chest wall, by contrast, exceeds 50% of the vital capacity (the maximal volume of gas that can be inhaled from residual volume). This discrepancy in the relaxation volumes of the lungs and chest wall has three important consequences. First, it forces the relaxation volume of the thorax as a whole to occupy a position intermediate between the relaxation volumes of the lungs and the chest wall (at approximately 35% of vital capacity). Under most circumstances, this volume coincides with the functional residual capacity (FRC), which is the volume contained in the lungs at the end of a tidal expiration. Second, as the thorax starts to rise above its relaxation volume during inspiration, the outward recoil of the chest wall contributes to the expansion of the lungs, thereby reducing the work that the respiratory muscles need to perform during normal breathing (see Figure 42-3, inset, where the work done by the chest wall at the beginning of a breath is represented by WW). Finally, at normal breathing volumes, the opposing actions of the lungs and chest wall recoils create a negative pressure at the boundaries of the lung tissue with the chest wall and the other intrathoracic structures. This negative pressure is an important contributor to the return of venous blood to the chest. The static volume-pressure relationships of the lungs and chest wall vary depending on their state of maturation and health (see Figure 42-4). In the infant, the chest wall generates remarkably little outward recoil within the normal range of breathing volumes.2–5 Because the inward recoil of the lungs varies little with respect to lung size and age during development,6–8 the relaxation volume of the infant’s thorax is proportionally smaller than that of the adult (as shown in Figure 42-4 by the lower intercept of the volume-pressure relationship of the thorax and the ordinate axis). If, as occurs in the adult, the FRC coincided with this relaxation volume (15% of vital capacity compared with 35% in the adult), then the infant would be at a definite disadvantage in terms of alveolar stability and oxygenation. The newborns of most mammalian species, however, have developed physiologic strategies to maintain their FRC above the relaxation volume of the thorax.9 These strategies are generally directed at interrupting expiratory flow before expiration is complete and include shortening of the expiratory time,10 contraction of adductor muscles of the glottis to retard exhalation,11,12 and persistence of the tonic activity of the inspiratory muscles during expiration.13 Being so dependent on the pattern of breathing, the FRC of the newborn and small infant is very vulnerable to changes in muscle coordination and tone. As an example, the decrease of tonic activity of the respiratory and laryngeal muscles associated with rapid eye movement sleep13 may cause a substantial reduction in thoracic lung volume at these ages. Similarly, muscle weakness, anesthesia, deep sedation, and central nervous system depression in general tend to lower FRC below levels compatible with alveolar stability. Under such circumstances, alveoli close, and both the shunt fraction and the work of breathing increase.
Lungs/Chest Wall Interactions
Although, considered in isolation, the lungs and the chest wall have different volume-pressure relationships, their mechanical linkage at the pleural space prevents them from changing volume independently. By sharing a common boundary, the lungs and chest wall are also influenced simultaneously by variations in the pressure at this boundary. The resultant interplay is well illustrated by the effects of a pneumothorax, a complication that is quite familiar to readers who practice intensive care medicine. When a certain volume of air enters the pleural space, the most immediate effect is an increase in the pleural pressure (ΔP). This increase causes the effective transmural pressures of the lungs and chest wall to change by the same absolute amount, but in opposite direction: transpulmonary pressure (PA − Ppl) decreases by -ΔP, whereas chest wall transmural pressure (Ppl) increases by ΔP. No longer held together by a rigid boundary, the lungs and the chest wall respond to the change in transmural pressure by decreasing and increasing volume along their respective volume-pressure relationships (Figure 42-5). Consequently, one could say that the volume of air originally introduced in the pleural cavity is partitioned into two components, one the volume by which the lungs collapse and the other the volume by which the chest wall expands. The relative sizes of the lung collapse and the chest wall expansion are dictated by the volume-pressure relationships of the lungs and chest wall. If the compliance of the chest wall exceeds the compliance of the lungs (as is usually the case in the infant), then the chest wall expands more than the lungs collapse. The difference is even greater when lung compliance is reduced by disease (Figure 42-5, B). Then the chest wall absorbs the majority of the volume change while the lungs barely decrease their volume. This simple analysis explains why noncompliant lungs show surprisingly little collapse when a pneumothorax develops, a finding that is often mistakenly attributed to the “stiffness” of the lung parenchyma. It also provides an opportunity to point out that the magnitude of the chest wall expansion, although frequently overlooked in radiographs, relates more directly to the true malignancy of a pneumothorax (compression of vascular structures) than does the usually more apparent collapse of the lungs.
Figure 42–5 A, The effects of a pneumothorax are used here to illustrate the interdependence between the elastic recoils of the lungs and the chest wall. Pressures, on the abscissa, represent the transmural pressures of the lungs (L, PA – Ppl, see Figures 42-2 and 42-3) and chest wall (W, Ppl – PB). The introduction of a volume of gas into the pleural space raises pleural pressure by a magnitude ΔP, which changes both transmural pressures by the same absolute magnitude, but in opposite directions. Lungs and chest wall respond to the change in transmural pressure by decreasing (C→D) and increasing their volume (A→B) along their respective volume-pressure relationships. The volume of the pneumothorax is thus partitioned between the lungs and the chest wall according to their relative compliances. B, When lung compliance is decreased by disease, the volume pressure relationship of the lungs is displaced to the right and has a lower slope. Under these circumstances, the chest wall is forced to accommodate the majority of the volume change introduced by the pneumothorax (AB >> C’D’), giving perhaps the wrong impression that the stiffness of the lungs prevents them from collapsing further.
Dissipative Forces
Dynamic Volume-Pressure Relationships
Analysis of the volume-pressure relationships of the thorax and its components becomes more complicated when we consider the pressure changes generated by gas flow and by the movement of the lung and chest wall tissue as the lungs inflate and deflate. These pressure changes result from molecular interactions between the gas and the airway walls, within the gas stream itself, and among the components of the gas-liquid interface and the tissue. The same interactions are responsible for well-known physical phenomena such as viscosity (the internal resistance of a fluid to flow), turbulence (the development of chaotic movements within a flowing fluid), or viscoelasticity (a property of tissues and fluids that causes their deformations to be time-dependent rather than instantaneous; ketchup provides a good example when it hangs stubbornly to the bottle before being released after multiple taps).14–17
[/not-level-membership-for-pediatrics-category]
