[level-membership-for-internal-medicine-category]
Chapter 11. Managing risks to patient safety in clinical units
Alan Merry
Introduction
Unintended harm to patients from failures in healthcare is now recognised as a public health problem of considerable importance (see Sorensen & Iedema, Chapter 1). There is more at stake than the possibility of direct harm to patients. There are a number of dimensions of quality in healthcare and risk that may manifest at different organisational layers within the system (see Figure 11.1).
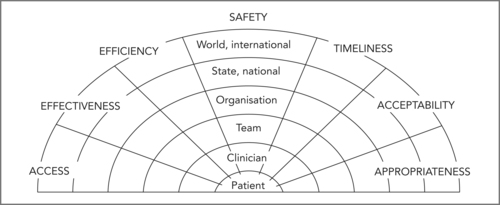 |
| Figure 11.1
(Source: reproduced with permission from Runciman et al 2007)
|
A balance must be found between investing in safety and the need to provide as much healthcare to as many patients as possible. An undue emphasis on safety by individual practitioners may lead to delays in treatment, increase the burden of illness experienced by patients on waiting lists, and in some cases reduce the effectiveness of the delayed therapy (because the benefit of some treatments depends on the timeliness with which they are provided). Redundancy (in the form of extra checks, extra staff, reserve power supplies, reserve equipment and so on) is an important way of promoting safety, but may also be seen as reducing efficiency. It may be difficult to work out the optimal balance between these conflicting considerations.
There may also be conflicts between risks for staff and the organisation and risks for individual patients – sometimes staff may feel that their own safety is best served by inactivity (declining to take on a difficult surgical case for example) or excessive activity (over-investigation of a patient before anaesthesia for example) in situations where some pragmatic middle course would be in the patient’s best interests.
Managing risks to patient safety in clinical units depends on interdisciplinary teamwork and on a cultural commitment to quality (which includes safety). In this chapter I will discuss critical aspects of effective risk management that include:
▪ understanding risk and the ways in which it can be measured
▪ understanding errors and violations and how these may occur in complex systems
▪ proactively identifying risks within one’s own unit
▪ actively reducing risk to acceptable levels without unduly impeding service delivery
▪ responding effectively when patients are harmed by healthcare.
Understanding risk
Many individuals find it difficult to evaluate the risk of infrequent events. People do not tend to use Bayesian logic when making decisions. Instead, they tend to be influenced by the nature of the hazard, their own personal experiences, social norms, and many other factors whose relevance may be more personal than logical. Marked fear of snakes or spiders is quite common, and generally out of proportion with any real hazard created by these animals. Furthermore, people who fear one do not necessarily worry about the other. Complacency about the substantial risks of smoking is common, but goes hand in hand with public expectations for the government to spend extraordinary amounts of money to further reduce the already infinitesimal risk of viral transmission through donated blood.
Expressing the risks of a particular procedure
From a clinical perspective, interest is typically in the risks of specific procedures. Published data tend to come from high-volume units, often from academic institutions, and often represent the best attainable results rather than the average. The actual risk of a procedure in the hands of one practitioner or one team may be quite difficult to establish because of the high numbers required to estimate the incidence of given adverse events with reasonable confidence limits. It is not often appreciated that (as a rule of thumb) a zero incidence of an event in x procedures could be associated with an upper 95% confidence limit of one event in x ÷ 3 procedures. Thus no adverse events in 10 procedures could be compatible with a true rate of 33%, and simply reflect a run of good luck. Conversely, one or two adverse events in a short series of procedures might be associated with surprisingly low true incidence. For example, two adverse events in 20 cases would give a point estimate of risk as 10% but with 95% confidence limits of 1% and 32%. Twenty events in 200 cases would give 10% (6%, 15%), and 200 in 2000 would give 10% (9%, 11%) – with all estimates rounded to the nearest integer.
Some ways of expressing the difference between two risks
Risk can be expressed in a number of ways. The most common expressions are ‘relative risk’ and ‘absolute risk’, the ‘odds ratio’, ‘numbers needed to treat’ (NNT) and ‘numbers needed to harm’ (NNH) set out in Table 11.1.
| Expression of risk | Discussion and example |
|---|---|
| The risk of an event | The rate at which the event occurs, e.g. 10 events per 1000 exposures would be a 10% risk rate. |
| The odds | The number of patients having the event compared with those not having it, i.e. using the above example, the odds ratio is 10:90, or 1:9. |
| Relative risk and odds ratio | The extent to which a treatment reduces the likelihood that an event will occur. For example, if a treatment reduces the occurrence of a particular event from 0.5% to 0.25%, the relative risk is 50%. The odds of the event without the intervention are 1:199 and with it 1:399. The odds ratio is therefore 1/399 ÷ 1/199. This is very nearly the same as the relative risk reduction. When the risks are higher, however, the difference between these two measures becomes greater. For example, reducing a risk of 50% to 25% also gives a relative risk of 50%, but the odds are 1:1 and 1:3 so the odds ratio in this case is 1/3 ÷ 1/1, that is 33%. |
| Absolute risk reduction | The difference between having a treatment and not having it. In our first example, the reduction in absolute risk is 0.25%, but in the second it is 25%. This expression perhaps describes the true benefit of each intervention or treatment more realistically than does relative risk. |
| Number needed to treat | The number of patients who need to be treated before a beneficial outcome occurs in one person. In the first example above, the NNT would be 400. |
| Number needed to harm | The number of patients who need to be treated before an episode of harm occurs in one person. |
The importance of exposure
An attempt is often made to compare risks of a medical procedure with those of a common every day activity. For example, anaesthetists often say that the risk of an anaesthetic is comparable with that of driving a car in traffic. This sounds plausible because the lifetime possibility of dying from one or the other event may be similar. However, for most people exposure to traffic is much greater than exposure to anaesthesia. It is important, therefore, to relate risk to exposure. The risk of undergoing anaesthesia in a developed country has been estimated as 1000 deaths per 100 million hours of exposure, while that of being in traffic (in any capacity) is only 50 deaths per 100 million hours of exposure. Interestingly, in relation to time of exposure, flying in a commercial aircraft is more dangerous than being in traffic, with a risk of 100 deaths per 100 million hours of exposure. Note that the way in which exposure is defined can make a difference here: if distance travelled were used as the denominator, then flying would be safer than driving a car (Runciman et al 2007).
The importance of underlying risk
The value of an initiative to reduce risk is dependent on the underlying rate of the adverse event in question. For example, a treatment that could reduce the risk of coronary artery disease by 10% would have no value if given to children, because they hardly ever get coronary artery disease. It is possible to stratify adults according to their risks of coronary disease, and it makes sense to invest in those groups at highest risk. A 10% reduction in this risk would give an absolute risk reduction of 0.1% if the underlying rate of the disease was 1%, and of 2% if the underlying rate was 20%.
Refining the concept of harm
One point often missed about studies like the Harvard Medical Practice Study (Brennan et al 1991) is that many of the deaths identified in these studies occurred in very sick patients who did not have long to live anyway (Hayward & Hofer 2001), and therefore, although not acceptable, they are not quite comparable with most deaths caused by road traffic accidents.
In addition to mortality rates, it might help to define the burden of iatrogenic harm in order to measure the quality adjusted life years (QALYs) (Murray & Lopez 1996) lost in this way, although there are limitations to the value of these indicators as well (La Puma & Lawlor 1990).
The importance of balancing loss against gain
Another limitation is the uni-dimensional nature of the results of these studies. Very little attempt has been made to balance the burden of adverse events from admissions to acute care institutions with the reduction in the burden of disease associated with the same admissions. When quantifying risk, some measure of accomplishment is useful to place into context the data on harm.
Process in healthcare – in pursuit of six sigma quality
Many medical activities are relatively straightforward, and it should be possible to achieve reliability levels equivalent to those now expected as normal in certain industries. The concept of ‘six sigma quality’ involves expressing the reliability of a given process in terms of standard deviations from the mean of a normal distribution. In effect, six sigma quality implies 3.4 failures per million events (procedures undertaken, or products produced). This level of reliability is expected in many industrial and manufacturing processes today, but if all adverse events are considered (not just deaths), it is not often achieved in healthcare, if ever. For routine processes this is no longer acceptable. It is time to clearly identify aspects of healthcare that lend themselves to process management, and adopt an approach for these that is process oriented, standardised, and strictly compliant with clearly defined and monitored guidelines.
On the other hand, it must also be recognised that not all aspects of healthcare lend themselves to the methods of industry. In general, diagnosis tends to be more demanding and depends more on experience and judgment than procedural work. Patients do not usually present with diagnoses emblazoned on their foreheads. A systematic and standardised approach will no doubt improve the likelihood of a correct diagnosis, but not all patients present in accordance with the textbooks. Even after a correct diagnosis has been made, there are many conditions for which the question of what to do next remains controversial. It is not easy to allow for uncertainty of this type when measuring the quality of healthcare.
Many procedural activities also involve considerable variation from case to case, and extend skilled practitioners to the limits of their ability. Performing a triple heart valve replacement in a 78-year-old patient is a very different proposition from replacing a single valve in a 40-year-old, for example. As another example, in major trauma each patient presents a unique combination of problems and requires sustained and creative effort from a large number of people working in unison. An activity of this sort is more like trying to win the World Cup in Rugby than like managing an industrial process.
Casemix and risk scores
Units that regularly undertake more complex and acute cases are likely to have more adverse events than those that concentrate on the routine and the straightforward. Some measure of differences in casemix is needed to take this variation into account. Various scoring systems have been adopted for this purpose – the EuroSCORE for cardiac surgery being one example (Nashef et al 2002) and the Goldman Index of cardiac risk for patients undergoing non-cardiac surgical procedures being another (Goldman et al 1977). Scores of this type are generated using regression analysis of information collected in large databases, and then validated by testing in other populations. They tend to become dated quite quickly as methods of managing medical conditions advance, and may not be reliable if applied to patient populations different from the ones in which they were developed.
Measuring performance over time
It is important to know not only whether a team or individual’s rate of adverse events is comparable with benchmark statistics, but also whether it is stable. Most time series of biological data exhibit variation, which can be of two types. Common cause variation may be thought of as ‘noise’. Thus a unit might have an infection rate that fluctuates by ± 2% around a mean of 5%. Fluctuation of this type usually reflects random variation from day to day, and the underlying rate may be stable from one year to the next. On the other hand, something may change. Some failure in process or alteration in resistance of microbes might lead to a jump to (say) 7% ± 2%, or some initiative to improve sterile procedures or the timely administration of antibiotics might lead to a fall to 3% ± 2%. The challenge is to detect special cause variation of this type in a reliable way. This is particularly important in relation to monitoring the effect of interventions to promote safety. Not only may such interventions fail to achieve their aim, they may even make matters worse (through so called ‘revenge effects’ (Tenner 1997)).
Simply comparing rates at two time periods may be misleading, in the absence of information about the long-term stability of the process in question. There are a number of better ways to distinguish special cause from common cause variation over time. Cumulative sum (cusum) charts (Bolsin & Colson 2000) and control charts (Carey, 2002a and Carey, 2002b) are two examples. The data for these charts may or may not be adjusted for risk. One method of using risk-adjusted data to monitor the ongoing performance of an individual or a unit is the variable life-adjusted display (VLAD) chart. It is sometimes used in cardiac surgery, where it is possible to calculate an expected survival rate using scoring systems and each patient’s known risk factors. Outcomes (death or survival) can be plotted against numbers of cases operated on. If a particular patient has an expected survival probability of 0.9 (or 90%) and survives, the plot is moved one unit along the X-axis and 0.1 along the Y-axis in a positive direction. If such a patient dies, the plot is moved one unit along the X-axis and 0.9 units along the Y-axis in a negative direction. At the end of 10 cases, if as expected one dies and nine survive, the plot will have moved 10 points along the X-axis and will be at zero on the Y-axis. Statistical limits can be set to identify points at which it becomes likely that one is dealing with special cause variation rather than common cause. VLAD charts have much to offer in relation to procedural work where high levels of standardisation are possible, and where clearly definable adverse outcomes (such as death) are relatively common. A Microsoft Excel spreadsheet for creating VLAD charts on the basis of the logistic EuroSCORE can be downloaded from The Clinical Operational Research Unit at University College, London. 14
Defining acceptable standards
A point often missed in relation to any of these methods is that results are inevitably defined as acceptable in relation to the norms for a particular group. It is important to understand certain implications of this approach. In any one clinical unit it is a statistical inevitability that one practitioner will get the best results and another will get the worst. If one had 10 surgeons, evaluated results and fired the worse performer in the name of quality improvement, one would simply have reduced the group to nine, with a different surgeon in the bottom place. In the same way, demands that all practitioners should be better than average are statistical nonsense. Some adequately performing clinicians must, by definition, be operating below the average, and there is no possible way of changing this fact.
Pause for reflection
Some healthcare professionals are ‘insiders’ and in the privileged position of knowing the results of their colleagues. Would such a person elect to undergo cardiac surgery from the member of the unit who has the worst outcome data? Would the decision to choose the surgeon with the best results be (a) rational and (b) ethical?
This discussion is not trite, because no patient, if asked, would say he or she wanted to be operated on by a surgeon whose results were ‘below average’, let alone the worst surgeon in a group. However, in a clinical unit, all surgeons have to contribute to the work.
Yet another difficulty is that the clinical situations that lend themselves to an analysis of this type are very much in the minority. Is it equitable that many cardiac surgeons today are required to have their results publicly scrutinised while their colleagues in general medicine, psychiatry and geriatrics are not? Actually, even their anaesthetic colleagues tend to be left out of this process, notwithstanding evidence that the anaesthetist may contribute to outcome after cardiac surgery (Merry et al 1992). It could be argued that there is merit in applying sound methods or monitoring performance where possible, and in working towards improving the situation where it is not. Alternatively it could be argued that the inequitable application of harsh standards to isolated groups is likely to do little more than promote gaming. For example, risk scores are known to be inaccurate at the extremes, so in practice patient selection will probably influence the results of a VLAD chart even though this should not happen in theory.
Two more points are relevant to this debate. Statistics apply to groups rather than individuals. A risk of 10% means that 10 of the next 100 patients are likely to die, but for each patient the result will be unpredictable, and will be either life or death (not 10% death). Morbidity is also important – in the example of cardiac surgery the risk of stroke is significant, may differ from the risk of death, and may be more feared by patients, but strokes are seldom incorporated into risk scores or monitored with VLAD charts. Also the management of patients goes beyond procedural results, and includes decision making in the first place, and then the whole amalgam of interpersonal skills, compassion and professionalism that might be very important to individual patients. Thus it can be seen again that the use of a uni-dimensional measurement such as a mortality rate is inadequate as a means of measuring performance in an endeavour as complex as healthcare.
Where databases are large, and many individuals contribute to the data, a normative approach based on reasonable outcome measures is fairly satisfactory, but its limitations should not be forgotten. In most cases the difference in outcome between the best and worst clinician in a unit should be small. Any difference will become statistically significant if very large numbers of data are available for analysis, but ideally the difference between individuals within one unit should not be clinically important. In fact the point is not whether one is the best or worst performing individual available to a patient, but whether one’s performance is good enough. The same thing can be said of units (see Box 11.1)
Box 11.1
At the paediatric cardiac unit of the Bristol Royal Infirmary 29 children died and four were left brain damaged following open heart surgery between 1984 and 1995. This was twice the expected mortality rate. A major inquiry was undertaken, and 198 recommendations were made, which led to many reforms in medical practice in the UK, including the establishment of more rigorous requirements for monitoring the results of surgery.
It can be seen that there may be clinical units in which the important question is not which surgeon is the best on the team, but rather whether the team as a whole is functioning to a standard that is acceptable at all.
The importance of the team
Many of the difficulties associated with monitoring performance become less marked if the emphasis is placed on the team rather than on the individuals within it. This approach still depends on making sure that all individuals are performing adequately, but it is more likely to be associated with standardisation, the universal adoption of evidence-based approaches, teamwork and supportiveness, and better outcomes for all patients.
Given the large numbers of units across the world, there is no reason why one’s own unit should not aspire to being better than average. If all units worked hard to achieve that goal, the average standard overall would improve (even if the number below average remained obdurately at 50%!).
Legal implications of risk in healthcare
Increasingly, risk management is being driven by legislative requirements. Some of the legal pressures are proactive – explicit demands for accreditation for example. Others are reactive – litigation in response to patient harm for example. In most countries today legal considerations weigh heavily when decisions have to be made about how much of a limited resource should be invested into risk management.
Accreditation
Accreditation is a formal process for demonstrating that an organisation complies with certain standards. The degree to which accreditation of healthcare is compulsory varies from country to country and so does the process by which it is achieved. In the US the Joint Commission on Accreditation of Healthcare Organizations (JCAHO) provides accreditation required to obtain reimbursement from Medicare and Medicaid (healthcare funding for the elderly and poor respectively). In Australia and New Zealand there is a trend towards greater emphasis on accreditation. For example, the Australian Commission on Safety and Quality in Healthcare developed a national standard for credentialling and defining the scope of clinical practice in 2004, and this has formed the basis for initiatives by state governments such as introducing a policy for the credentialling of senior doctors appointed to public health services in Victoria. 15
Compliance with standards can be assessed by considering structure, process or outcome (Donabedian 2003). In theory, if it were possible to measure relevant outcomes adequately, there would be little need to measure anything else, but in practice this may be much more difficult than establishing that the required buildings, equipment and personnel are in place (i.e. that the structure of the organisation is adequate) and that the right protocols, clinical pathways and other process tools have been established and are in use.
Tort
In many countries there has been a substantial increase in the cost of litigation related to healthcare during the second half of the last century, and in the UK, US and Australia the costs of the tort system now amount to 1% of expenditure on healthcare (Runciman et al 2007). In New Zealand a no-fault system of accident compensation was established following the 1967 Sir Owen Wodehouse report, and it is essentially unknown for doctors to be sued for negligence (Merry & McCall Smith 2001). Today the Accident Compensation Corporation is responsible for promoting safety within the healthcare system proactively and for compensating patients after they have been harmed. The tort system tends to be slow, inefficient and somewhat capricious in the degree to which it achieves any worthwhile outcomes for patients, healthcare professionals or the system as a whole. From first principles the New Zealand approach appears to be more effective, and it is popular with New Zealanders. Individual practitioners are still held to account through the investigations of the Health and Disability Commissioner and through disciplinary actions by the Medical Council, but on the whole, organisations are less at risk from the repercussions of harming patients than they would be if lawsuits were still possible. It is hard to obtain data on the relative effectiveness of these different systems in promoting safety, but it is at least possible that the loss of the tort system from New Zealand has removed one incentive for hospital administrators to invest in safety initiatives.
Criminal law
It ought to go without saying that the role of criminal law in healthcare is to deal with seriously culpable behaviour (Merry & McCall Smith 2001). Unfortunately, in New Zealand in the 1990s, and more recently in the UK, there has been a tendency to respond to tragic accidents that have resulted in the deaths of patients by charging healthcare professionals with manslaughter. In many cases the level of negligence involved has been minimal (Ferner & McDowell 2006) and only a minority of the charges have been successfully prosecuted, but the impact on all concerned has been very substantial. This topic has been discussed in greater depth elsewhere (Merry 2007).
Whose risk should we manage?
One of the difficulties with legal responses that focus on punishing individual practitioners, and even with those in which the primary aim is to provide compensation for patients, is that they do little to promote safety at an organisational level. In fact, the motivation for many so-called safety initiatives is the protection of administrators, clinical leaders and individual practitioners. This is particularly true of some policies instituted in the name of safety or quality (see Box 11.2.)
Box 11.2
Recently in New Zealand a consultant practitioner was found in breach of the Code of Patient Rights because he did not obtain consent from a patient for a trainee doctor to be present (simply as an observer) during a bedside consultation. In reaching this judgment it was considered relevant that the hospital had a policy that specified the need to obtain informed consent for all teaching activities. It was therefore held that the hospital administrators had discharged their responsibilities and that the blame lay fairly with the practitioner for failing to follow the policy.
A meeting was subsequently held to discuss the wider implications of obtaining informed consent in a major teaching hospital in New Zealand (not necessarily the same one). It became apparent that there are many circumstances in which it is very difficult to obtain informed consent simply in order for a trainee (a medical or nursing student, or a junior doctor) to be present as an observer. For example, anaesthetised patients in the operating room, babies in a paediatric unit, unconscious patients admitted to an emergency department, and patients on ventilators in intensive care units are all in a different position from that of an alert and competent patient who can easily be asked if it is acceptable for a student to be present. It is perhaps not impossible to obtain consent from some other appropriate person in each of these situations, but it may be difficult and very time consuming to do so, and there are wider implications of proxy consent that might also need to be considered.
Given that staff are required by the hospital to teach students and juniors it was accepted, even by senior managers present at the meeting, that the policy about informed consent for this activity was effectively impossible to implement as it stood, and served primarily to protect management rather than to promote proper practice. It was decided to implement a new policy that would include a blanket approach to obtaining informed consent for basic educational activities at the time of admission. Even this would be only partially satisfactory, and there may still be situations in which staff might find it difficult to marry the requirements to teach future generations of health professionals with the need to obtain meaningful consent to do so, but at least some of these difficulties have now been made more explicit.
Legislating for safety
The well-known series of disasters in British hospitals involving the inadvertent injection of the anti-cancer drug vincristine into the spinal fluid instead of the blood stream is illustrative of the failure of a harsh legal response to improve safety (Merry in press). Criminal charges against junior doctors involved in these tragic mistakes have not been effective in promoting safer practice. Instead, the elements have been left in place for the same mistake to happen again and again (over 14 times so far) in different institutions and with different casts of players. This is not surprising, because junior doctors have very little if any ability to improve the system.
James Reason (2004) made the following comment about these disasters.
When a similar set of conditions repeatedly provokes the same kind of error in different people, it is clear that we are dealing with an error prone situation rather than with error prone, careless, or incompetent individuals.
(Reason 2004:ii29)
This implies that the key to managing risk of this sort lies in moving the focus from the individual to the process of care. This depends on engaging those who are able to influence these processes. One of the interesting aspects of the equally well-known events at Bristol Royal Infirmary in relation to paediatric cardiac surgery (see Box 11.1) was the fact that a senior administrator was among those held accountable for the failures in this service. This was facilitated by his being a registered medical practitioner. In many systems hospitals are administered by generic, lay managers and it is not always obvious how these people could be held to account for failures to ensure the safety of their organisation. It does seem irrational to insist on rigorous requirements for registering doctors and nurses in the name of patient safety, but not for those who, through the financial processes of healthcare, also have a great influence on the system in which these doctors and nurses have to provide safe care for their patients.
If the ultimate aim is to protect patients, legislative processes must be developed that place this responsibility onto the shoulders of all concerned with the provision of healthcare. This will require systems of governance that include within the responsibilities of clinicians a duty to ensure fiscal prudence, and in the responsibilities of administrators a duty to ensure patient safety.
Understanding error and violation
Many adverse events (not all) are attributable to error. To be effective, clinical risk management must be predicated on a basic understanding of the nature of human error. Surprisingly, some of the adverse events are actually attributable to violations, and these also need to be understood. Regular educational activities on the nature of errors and violations are essential if a culture of safety is to be nurtured. Space precludes more than a brief synopsis of the key points of this very large subject, and readers are referred to other sources for more information (see Reason 1990, 1997, Merry & McCall Smith 2001, Runciman et al 2007).
Complex systems
Perrow (1999) has characterised processes on two dimensions. The first is the degree to which outcomes are coupled to actions. In a tightly coupled system, the link between actions and outcomes is direct. Many interactions in healthcare are tightly coupled – giving the wrong drug to a patient can produce instant adverse effects. Poor hand hygiene on the part of staff will result in an increase in nosocomial infection, not necessarily in every patient, but certainly overall. The second dimension is the interaction scale. Interactions can be linear or complex. Any collection of two or more interacting components can be thought of as a system. A system can be considered complex when the possible interactions exceed the number at which it is possible to predict its long-term behaviour. Healthcare is a complex system. Perrow argues that in complex systems accidents are inevitable, and therefore ‘normal’. It follows that such systems are intrinsically unsafe. Considerable investment and constant vigilance will be required to achieve safety if the coupling of a system is tight and consequences of failure potentially severe.
Healthcare is a particularly hazardous complex system. It differs from many other complex systems (such as aviation) in its diversity, in the vulnerability of the patients within it, and in the degree of uncertainty that characterises many of the problems faced by practitioners (Runciman et al 2007).
Errors
An error can be formally defined as is ‘the unintentional use of a wrong plan to achieve an aim, or failure to carry out a planned action as intended’ (Runciman et al 2003:975). More simply, an error occurs ‘when someone is trying to do the right thing, but actually does the wrong thing’ (Runciman et al 2007:112). The fundamental point is that errors are unintentional (note that this essential element has not been captured by all published definitions of error). Identifying a failure as an error does not depend on outcome – errors may have no effect on outcome, or may even lead to a better outcome than anticipated (for example, one might forget to give a prophylactic antibiotic to a patient, who unbeknown to anyone is actually allergic to this drug, and thereby avoid an anaphylatic reaction). Equally, adverse events can occur in the absence of any identifiable error. The outcome of an error is largely dependent on chance.
Pause for reflection
Can an adverse event really occur without any error (or violation)? For example, if one attempts to repair an acute aortic aneurysm and the patient dies despite no obvious mistakes or deficiencies in management, does this not imply either:
▪ errors (or at least imperfections) occurred that were not identified or perhaps even understood given the present ‘state of the art’
▪ it was a mistake to undertake the case in the first place.
These views are only meaningful with the benefit of hindsight: assuming there was a reasonable chance of success at the time of the decision, there would have been no way of knowing in advance that the outcome would be unsatisfactory. Similarly, future gains in knowledge and technique lie in the future – one can only characterise actions as errors in relation to what was known and possible at the time. This of course can create difficulties in perception when old cases are brought before the courts: the tendency is to judge past events by present-day standards.
The classification of errors
There are many different ways of classifying errors, but the central point is that errors are classifiable, rather than random: they occur in particular ways and under recognisable circumstances, so it is possible to understand the factors that predispose to error. This implies that it is possible to address so called ‘latent factors’ (previously known as ‘latent errors’) in the system that make errors more likely (Reason 1990). James Reason’s ‘Swiss cheese’ model of accident causation is very well known (Reason 2000). It depicts the defences in the system as slices of Swiss cheese, with the holes representing latent vulnerabilities in their effectiveness. Accidents seldom occur from a single error – usually it is necessary for several of these latent factors to manifest at the same time – depicted as the holes lining up.
One classification widely used in the context of healthcare is based on the thought processes involved in the generation of the error. Skill-based errors (slips and lapses) involve failures in actions during learned behaviours with no conscious engagement of the mind (classically, a person who has just given up taking milk in tea might accidentally add milk to a cup without thinking). Mistakes involve failures in decision making. Technical errors are a little different, and in effect represent a mismatch between the (variable) challenge provided by patients and the (variable) skills of practitioners (see Box 11.3) (Runciman et al 2007).
Box 11.3
All golfers make errors (which are not slips or lapses, nor are they mistakes – although golfers may make both of these types of error as well) otherwise the ball would end up in the hole at least on every shot within reach of the green. These errors can be thought of in terms of tolerance – skilled golfers tend to play within tighter tolerances than beginners. However some courses are harder than others, so tolerances vary not only with the skill of the person, but also with the challenge he or she faces.
In the same way, success at undertaking an epidural injection (for example) is a factor of the skill of the practitioner and also of the difficulty presented by the unique anatomy of each patient. The more skilled the practitioner the greater the likelihood of success, indicating some imperfection on the part of his or her less-skilled colleagues that can be thought of as technical error.
Violations
The important difference between violations and errors is that violations are intentional, although this does not imply that there is any intention to harm patients. Stated simply, a violation is ‘an act which knowingly incurs a risk’. More formally: ‘a violation is a deliberate – but not necessarily reprehensible – deviation from safe operating procedures, standards or rules’.
Many violations occur in healthcare, largely because people are struggling with an imperfect system, and following the rules can often be difficult within the overall constraints of heavy workloads and inadequate resources. Occasionally it is appropriate to break a rule (in a real emergency an anaesthetist might forgo a complete check of the anaesthetic machine before using it to administer oxygen for example). There are in fact too many rules in many healthcare institutions; the problem with an excess of rules (or policies) that are widely perceived to be trivial, unhelpful or unworkable is that people do break them (indeed they may not even be aware of many of the policies, and may often break them unintentionally) and breaking any rule is the first step on the slippery road to a culture of denial of the value of rules.
Violations are not all equally culpable. Exceeding the speed limit by one kilometre per hour is obviously a different moral proposition from exceeding it by 20. On the other hand, there are two major reasons for taking violations very seriously:
1. violations predispose to error and tend to make the consequences of error worse when errors occur (speeding is a good example of this)
2. unlike errors, violations are intentional, so (in theory at least) they should be totally avoidable.
Much emphasis is placed on the idea of promoting a culture of safety in healthcare. An absolutely central element of such a safety culture is a commitment to avoiding unnecessary risk, and a respect for ‘safe operating procedures, standards or rules’.
Pause for reflection
One type of violation, the ‘optimising’ violation, is characterised by a desire for self-gratification, and is very common in healthcare. It is often driven by doctors’ desire to be the ‘best’ and to be known as ‘outstanding’ – often defined in relation to being fast, clever, exceptionally technically able, and so on. In fact safety is not about being the best – it is about doing the right thing, which is often routine and boring, and sometimes slows down the process. This means that the safety conscious person often runs the risk of being seen as ‘slow’ or ‘unhelpful’ when compared with those who appear more accommodating and who perhaps take shortcuts to ‘get the job done’.
Deliberate harm
Deliberate harm to patients is very rare in healthcare, notwithstanding the high profile of Harold Shipman, the English general practitioner who murdered over 200 of his patients (Richards 2006). James Reason calls this ‘sabotage’ (Reason 1990). It does occur and should not be tolerated but has received far too much emphasis in relation to patient safety. The vast majority of adverse events in hospitals occur because good doctors and nurses who intend to help their patients fail in this endeavour, and not because of anyone who got up in the morning with the intention of hurting people.
Categories of human activity
Effective risk management can be facilitated by an appreciation of the different types of activities that occupy health workers, because the risks are different in each. These categories of activity are:
▪ routine operations
▪ maintenance activities
▪ dealing with abnormal conditions (sometimes in emergencies)
▪ creative activities (sometimes in emergencies).
Routine and maintenance activities are very common in healthcare. Indeed, promoting a routine approach to common problems is a cornerstone of high-quality and safe practice. The most common errors in these activities are slips and lapses. These are not easily avoided, but the design of equipment, processes and facilities can make them less likely. For example, the use of forcing functions can eliminate specific errors (pin indexing systems on gas cylinders used to avoid inadvertent misconnections when using anaesthesia machines are one example of this). Alarms and checklists may also be helpful.
The risk of a mistake is increased, in comparison with that of skill-based errors, when dealing with abnormal conditions. The first response to an abnormal condition usually involves identifying and applying a rule, and this is likely to go wrong if the person concerned has not seen the particular condition before. Creative activities are relatively uncommon in healthcare (in contrast with engineering for example), but dealing with an abnormal condition that has not been seen before may require a creative response. The problem with creative thinking is that it takes time, which may not be available in an emergency. It follows that an important technique for clinical risk management is to increase the number of conditions for which rules have been specified. Traditional medical training, case conferences, mortality and morbidity meetings and many other educational techniques are all predicated on trying to increase the number of relevant conditions likely to be correctly identified by staff working in a particular unit, and to increase awareness of standard rule-based responses to these. Another technique for improving the likelihood of success in responding to an abnormal condition involves the use of appropriate algorithms16 (Runciman & Merry 2005).
Proactively identifying risk in a clinical unit
The starting point in reducing risk is to identify the factors likely to create risk in one’s own unit.
Expertise, standardisation and evidence-based medicine
The importance of expertise cannot be overemphasised. A system of credentialling clinical staff to ensure that training and experience is appropriate for the work done in the unit is essential. The peer-reviewed literature relevant to the clinical problems dealt with in the unit should be reviewed regularly, and key publications should be presented and discussed at continuing education meetings. Policies should be developed to standardise the management of patients along evidence-based lines so far as possible. Where evidence is equivocal or lacking, agreement should be reached among senior clinicians in the unit on one reasonable method of dealing with particular clinical problems, based on first principles and experience, and this method should be adopted as the standard for the unit.
Incident reporting
Incident reporting has gained considerable traction in healthcare over the past decade and many institutions have set up systems for incident reporting. In many cases these systems have been implemented on a hospital-wide or even state-wide basis. The key for risk management in one’s own unit is to ensure that staff are proactive in reporting relevant incidents, including near misses, and that these reports are reviewed locally as well as centrally.
The objective of incident reporting is to improve patient safety. This means that it is more important for information that might reduce risk to be shared with those who can act upon it than it is to count events or punish clinicians for mistakes or wrongdoing.
Regular meetings should be held to review incidents. These can be based on forms that have been completed by members of staff, but it is worth also encouraging spontaneous verbal reports of things that have gone wrong, nearly gone wrong or simply concerned members of staff. These meetings should be run on a confidential no-blame basis. In many jurisdictions this can be formalised by registration of the meetings and the incident reporting process as quality assurance programs. Blame-oriented processes can run in parallel to confidential incident reporting, and the provision for confidentiality in this way does not impede access to information in any other way, such as through a patient’s notes, interviewing staff for the express purpose of investigating a complaint, and so on.
It is important to ‘close the loop’. This implies that some action must follow the confidential meetings. Minutes that are limited to the issues, and points for action, are a reasonable way of facilitating this. Someone, such as the clinical director of the unit, must be responsible for implementing the recommendations that arise from the meetings.
Recording and responding to events
It is important to measure the rate of specified outcomes in order to track performance over time and to compare the performance of one’s own unit with that of comparable institutions and with results published in the literature. This is a different exercise from incident reporting, with different objectives, and the two should not be confused.
Key performance indicators or clinical indicators may be used to monitor selected processes. For example, it may be relevant to track the percentage of patients who have been assessed by an anaesthetist before surgery. On the other hand, if this is the standard of care in one’s own unit, and compliance is 100% (or very nearly 100%), there would be no point in monitoring this indicator.
Serious adverse events should certainly be tracked, and the rates of these reviewed regularly. For many units, mortality rate is an important indicator of quality, but for others death is too infrequent to provide meaningful information about clinical performance. However, there may be other outcomes that are more common and worth monitoring to provide early warning of problems in the management of patients – nosocomial infections being an obvious example.
Sentinel events are serious adverse events that should not be allowed to happen. A number of events have been specified as ‘sentinel’ in various jurisdictions, and the reporting of these is required by law. However it may be appropriate to designate certain events as ‘sentinel’ for the purposes of a particular unit. It may not be necessary to pre-specify these – in many cases it is obvious to all concerned when a serious adverse event occurs that is out of the ordinary and demands special attention.
Root cause analysis (RCA) is a formalised process to identify the underlying causes of an adverse event, in order to prevent it from happening again. The term means different things to different people, but the approach developed by the Veteran’s Administration in the US is particularly thorough, and has been described in detail elsewhere (Runciman et al 2007). It is usual for the process for RCA to be set up at an institutional level, and this is appropriate for several reasons, not the least of which is the considerable resource required. However, there may be times when a RCA should be initiated locally, at the level of a clinical unit, in response to an event that is serious and unexpected, or to a series of events identified by incident reporting (for example) that collectively demand action.
Other processes may be appropriate instead of, or in parallel to, unit-based actions to deal with adverse events. For example, deaths related to surgery should generally be reported to a coroner, and coronial inquiries may be very helpful in identifying actions to improve safety within a unit.
It is important to review the results of these activities regularly and to take action if they indicate a problem. In doing this, the use of appropriate statistical techniques to differentiate special cause from common cause variation is essential (see above).
Complaints
Complaints are an important means of identifying risks in healthcare, and should be actively encouraged. It is reasonable for patients who have had a bad experience in a clinical unit (or their families) to complain. Complaints may also be received from visitors, and from other people who have had some interaction with the unit. Poor communication often underlies complaints and open disclosure of adverse events may reduce their likelihood.
All clinical units should have formal processes for dealing with complaints, which should be aligned with the processes of the overall institution, and should include support for all parties. It is inevitable that some complaints will end up going beyond these processes but the aim should be to resolve complaints locally and promptly if possible. Part of this response should be to identify factors that could be improved in the future, and to record and implement these. Many patients who complain say that they do so to prevent future incidents (and also to get an explanation, to obtain compensation and to promote accountability). It follows that this part of the response is important not only for managing future risk, but also for resolving the present complaint.
Actively reducing risk in a clinical unit
Identifying risk is half way to reducing it, but measurement alone will not improve patient safety: action is needed, and this implies the investment of time and money.
Safe staff – the importance of the team
Effective risk management requires commitment and cooperation from all disciplines involved directly and indirectly with the care of patients – doctors, nurses, pharmacists, laboratory staff, managers and even orderlies and cleaning staff (see Box 11.4). This commitment must be present at all levels of the system, from politicians and senior government officials right down to the clerk who coordinates the appointments for outpatient clinics. Safety requires all those who work in healthcare to understand that the focus of all activities should ultimately be the patients (refer back to Figure 11.1). This includes everyone from financial officers to the staff who prepare meals in the hospital kitchen. In short, safety in healthcare is a function of teamwork, the team is very large, and the patient’s outcome depends on the weakest link in the team.
Box 11.4
This author spent four days in a major pubic hospital after suffering a comminuted fracture of his tibia and fibula. The fracture was very low, and required difficult surgery that involved inserting a rod into the tibia and a number of screws to secure the position of the fragments. On the day of discharge an orderly was entrusted with taking him by wheelchair from the ward to a waiting car, and with assisting him in moving from the wheelchair to the car.
The orderly discharged his duty with a care and diligence that reflected great pride in his work. When thanked, he summarised the situation perfectly saying, ‘There wouldn’t be a lot of point in all that skilled surgery if you were allowed to trip over while getting into your car and managed to break your leg again, would there?’
When asked, he said he had been in the job for over 20 years, knew the hospital and its medical and nursing staff very well indeed, and was proud to be part of an organisation dedicated to patient care.
An unfortunate trend in healthcare in recent years has been towards greater mobility in staff, the use of contractors rather than employees for functions such as cleaning and catering, and the increased use of agency staff and locums for clinical services. Two important safety measures have been lost in this change from long-term employees:
1. the opportunity for individuals to develop thorough knowledge of their clinical unit, the people who work in it, the types of patients who present to it, the location of the equipment, the other disciplines who interact with it and all the myriad factors essential for the successful management of patients
2. the opportunity to develop strong team identities: people who believe themselves to be part of an identifiable and well-performing team will often go beyond the strict boundaries of their paid employment to promote the goals of the team (in this case high-quality patient care).
The things that go wrong in hospitals are not random. As explained above, errors and violations can be classified, their causes understood, and their occurrence often predicted. Thus a nurse who has been in a clinical unit for many years will have seen many adverse events, and will often recognise the signs of the next one in the making. He or she will be able to intercept the mistake about to be made by the house officer, the new staff nurse, or even the new catering contractor (errors in providing meals to patients being a prime source of adverse events in hospitals).
Investing in safety
The concept of risk as a homogenous organisation-wide phenomenon, likely to be solved by major initiatives to improve the culture and change the entire system, is only partially correct. Many risks manifest uniquely at a local level, and the risks faced in a psychiatry ward are different from those faced in the operating room. It follows that many solutions are also local, and those who work in clinical units often know what the key risks are and quite often have innovative or simple, sensible ideas about how to address them. These ideas need to be acted upon, and the resources need to be provided to facilitate safe practices that are specific to specific clinical situations. Obviously good ideas should also be shared, but often this is as much a matter of communication between different institutions as between units within the same institution, and the medical and nursing peer reviewed literature is often the most effective vehicle for this.
A major challenge to improving the safety of healthcare processes lies in having to justify the cost of this investment, in a sector that finds it difficult to meet the financial demands of providing service even at current levels of risk. It may be very difficult to quantify the benefits for any specific intervention to reduce risk. Ironically, misuse of the concept of evidence-based medicine may itself be a barrier to appropriate investment in safety.
Sackett has made it clear that evidence-based medicine is ‘the conscientious, explicit and judicious use of current best evidence in making decisions about the care of individual patients’ (Sackett et al 1996:71). For some clinical questions, the randomised controlled trial (RCT) is the best source of evidence, but there are many questions for which other forms of evidence are more appropriate (Merry et al 2000). Furthermore, the lack of evidence to support an intervention is not the same as evidence that it has no value; error prevention is a young field, and one in which the commercial incentives to fund large randomised trials are less than they are in relation to the development of new drugs (for example), so evidence is not yet particularly abundant. RCTs are not always feasible in relation to safety interventions, because randomisation and/or blinding may be impossible or because adverse events, although occasionally catastrophic, are actually quite infrequent. For example, the inadvertent administration of intrathecal vincristine alluded to above has occurred at a frequency that is totally unacceptable from a clinical perspective but too low for use of this outcome as an endpoint in an RCT.
Leape et al (2002) have put the matter this way in relation to anaesthesia.
… the anesthesia community has measured its progress over time, accumulating a ‘time series’ track record whose signal is virtually incontrovertible. To say that convincing evidence of progress and effect is lacking because randomised trials of all safe anesthesia practices have not been conducted would be Luddite.
(Leape et al 2002:506)
RCTs are best suited to evaluating the efficacy of individual interventions or therapies, whereas patient safety is primarily a function of how well the system of care is performing – evaluating safety is more like evaluating the effectiveness of a treatment in actual practice. For example, the efficacy of prophylactic anticoagulation to prevent venous thromboembolism can be demonstrated in an RCT, but the impact of anticoagulation in clinical practice also depends on patients receiving the appropriate drug, on time, at the right dose, every time, and if these elements fail it is actually possible for the outcome to be worse than if no attempt is made to use anticoagulation at all. The safe provision of anticoagulation is in fact a function of the system, and depends on the application of human factors theory, process engineering, and systems theory. This involves the iterative institution of small changes guided by repeated evaluations through a cycle of continuous quality improvement (See Warburton, Chapter 10). This is not a process that can easily be studied by RCTs. It may be possible to follow outcomes using sequential statistical tools (such as control charts) provided one is dealing with a frequent end point. For infrequent but disastrous adverse events, not even these methods are viable. Often, one simply has to resort to first principles, which in the case of safety includes such things as standardisation, simplification, and using checklists. Many of these initiatives can be justified on the basis of common sense and evidence from industry. As Leape et al (2002) say
[F]or policymakers to wait for incontrovertible proof of effectiveness before recommending a practice would be a prescription for inaction and an abdication of responsibility. The prudent alternative is to make reasonable judgments based on the best available evidence combined with successful experiences in health care. While some errors in these judgments are inevitable, we believe they will be far outweighed by the improvement in patient safety that will result.
(Leape et al 2002:507)
Establishing a safety culture
In order for a team of long-term staff to reduce risk rather than entrench it, they must habitually display behaviour appropriate for this objective. This behaviour can be conceptualised as reflecting certain attributes (see Figure 11.2). There is no doubt that health professionals need knowledge and skill, and often a great deal of both.
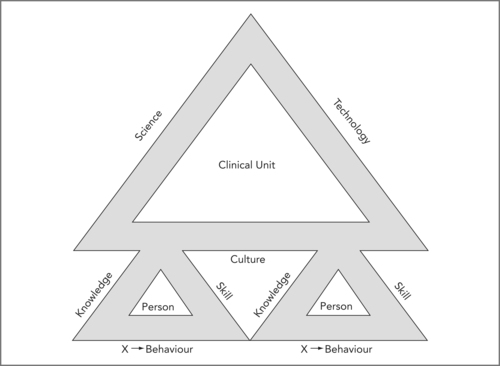 |
| Figure 11.2 |
In Figure 11.2 the attributes of individuals (there may often be more than two people in a clinical unit) and of the clinical unit to which they belong are each depicted as three sides of a safety triangle. The culture of a clinical unit (or any other organisation) reflects the collective attributes of the people who make it up (modified from Runciman et al 2007). The contribution of Dr Richard Morris to this concept is acknowledged.
There is an additional factor that can be recognised as important, but is harder to define. An exercise sometimes used in teaching clinicians is to ask them to identify the features of the doctor or nurse in their own unit who they would like to have caring for their own family. There is no doubt that there is a factor over and above knowledge and skill, that relates to a complex mix of attributes that people in the know take into account when making such a choice. This mix has been called the X-factor (Runciman et al 2007); it is not easily defined, but it is recognisable, and manifests in the individual’s behaviour.
In a similar way there are a number of attributes one might identify as desirable in clinical units (or indeed any organisation in healthcare). These include the empirical and scientific knowledge on which it operates (its ‘science’), its technology, and its culture (see Figure 11.2). The knowledge of its people adds up to its ‘science’ and their skills are largely dependent on its technology. Science and technology are applied within a culture. In the end, the culture of a clinical unit is no more than the collective manifestation of the individual behaviour of the people within it. The behaviour of each individual is influenced by the behaviour of the others within the unit, so a new entrant to the community may well be drawn into a strongly established culture, implying that a desirable culture, once established, tends to be self-propagating (and so does an undesirable one).
How then can a culture of safety be achieved? Obviously the more the focus of those responsible for the unit is on safety, the better. However, a personal focus on safety by every individual, demonstrated by safe behaviour, is an essential contribution to such a culture. If a culture places greater value on throughput and is tolerant of carelessness, individuals will be more likely to disregard safety. Thus every individual’s behaviour is modified by the prevailing culture, but, in a cyclical way, this behaviour creates and reinforces that very culture. Thus the discussion returns to the point that the culture of any group is a product of the collective attitudes and behaviour of the individuals within it. If the culture of a system is to change, then the behaviour of the individuals within it must change. It follows that the responsibility for the safety of any unit lies with every individual.
Of course clinical units do not exist in a vacuum, and aligning the culture and risk management activities of the clinical unit with those of organisational management can be a major challenge, particularly when the former are strongly grounded in clinical work and the latter are predominantly from lay backgrounds. Perhaps the most important step towards this goal is regular communication, both formal and informal. The more people talk to each other the more likely they are to understand the other’s view of the organisation’s objectives and risks. It is important to articulate these formally. A small set of carefully chosen practical indicators of performance in relation to goals and risks can then be monitored. It is essential that relevant clinical data is fed back to organisational management, and that organisational management demonstrates responsiveness to those data, and the information they represent.
Pause for reflection
In a safety-oriented culture, the motto should be: ‘If you don’t know it’s safe, it isn’t safe.’
The responsibility for alerting the team to any concern over safety lies with each individual within the team. This does not always mean that the team will change course – it does mean that critical information on which to make a safe decision is more likely to be shared.
Responding to an adverse event
For the foreseeable future adverse events will occur however effectively risk is managed within clinical units. A very important part of a risk management program is to ensure that the immediate response to these events is appropriate (see Box 11.5 overleaf).
Box 11.5
1. Secure the situation by:
▪ making sure the patient is safe
▪ making sure no one else is likely to be harmed.
2. Record the event and the actions taken to deal with it.
3. Communicate with the patient and/or family.
4. Support:
▪ the patient and/or family
▪ the staff involved in the event.
5. Inform:
▪ the hospital risk managers, unit directors etc (and complete an incident report)
▪ liability insurers as appropriate.
6. Plan:
▪ ongoing care of the patient if necessary
▪ follow-up meetings with the family and patient
▪ appropriate investigations (e.g. root cause analysis).
The most important thing is to recognise that a serious adverse event warrants focused and detailed attention, and that arrangements need to be made to ensure that the staff involved in the event are able to deal with the aftermath. This may imply cancelling other work, or finding other staff to take over. It is also important that senior staff not directly involved with the incident become involved in the response, to provide support for those who were involved and may be distressed and (understandably) lacking in objectivity. A more detailed account of this important topic is available elsewhere (Runciman et al 2007).
Conclusion
Managing risk to patients is an essential activity in healthcare, and should involve all levels of every organisation. The steps taken at the level of the clinical unit are particularly important, and need to be proactive, planned, coordinated and grounded in the science of human factors, cognitive psychology and safe systems design.
Many of the risks faced by patients are specific to particular clinical units, and no one is better placed to identify these, and respond to them, than those who work at the front line of clinical medicine. Culture is important, and is largely determined at the level of whole institutions, but the contribution to each individual in developing and maintaining a safety-oriented culture cannot be overestimated. Reducing risk requires the investment of time and money, and the justification for this along traditional business lines may be difficult – but the investment still needs to be made.
Risk management is very much a team affair (see Box 11.6). Risk is determined by the weakest link in any chain. Every member of the clinical unit should be engaged in this activity. The development of stable groups of long-term staff who identify strongly with their clinical units is therefore the cornerstone of safety.
Box 11.6
▪ Staff at the level of the clinical unit have a major role in any organisation in managing risks to patients.
▪ The risks that matter in each particular unit should be identified and proactive steps taken to mitigate these.
▪ The clinical data provided to organisational management from a clinical unit should be carefully chosen to reflect these key risks and progress managing them.
▪ The distinction between errors and violations should be understood within clinical units, and every effort made to identify and reduce factors contributing to both.
▪ The response to adverse events that do occur should be given high priority to ensure that both patients (and their families) and staff are properly and promptly cared for and supported.
▪ Complaints present an opportunity to improve the quality of care provided by a clinical unit, and should be handled proactively, fairly and constructively.
References
Bolsin, S.; Colson, M., The use of the Cusum technique in the assessment of trainee competence in new procedures, International Journal for Quality in Health Care 12 (5) (2000) 433–438.
Brennan, T.A.; Leape, L.L.; et al., Incidence of adverse events and negligence in hospitalized patients – results of the Harvard Medical Practice Study I, New England Journal of Medicine 324 (6) (1991) 370–376.
Donabedian, A., An Introduction to Quality Assurance in Health Care. (2003) Oxford University Press, New York.
Ferner, R.E.; McDowell, S.E., Doctors charged with manslaughter in the course of medical practice, 1795–2005: a literature review, Journal of the Royal Society of Medicine 99 (6) (2006) 309–314.
Goldman, L.; Caldera, D.; et al., Multifactorial index of cardiac risk in noncardiac surgical procedures, New England Journal of Medicine 297 (1977) 845–850.
Hayward, R.A.; Hofer, T.P., Estimating hospital deaths due to medical errors: preventability is in the eye of the reviewer, JAMA 286 (4) (2001) 415–420.
La Puma, J.; Lawlor, E.F., Quality-adjusted life-years: ethical emplications for physicians and policy makers, Journal of the American Medical Association 263 (21) (1990) 2917–2921.
Leape, L.L.; Berwick, D.M.; et al., What practices will most improve safety? Evidence-based medicine meets patient safety, Journal of the American Medical Association 288 (4) (2002) 501–507.
Merry, A.F.; Davies, J.M.; et al., Qualitative research in health care, British Journal of Anaesthesia 84 (5) (2000) 552–555.
Merry, A.F.; McCall Smith, A., Errors, Medicine and the Law. (2001) Cambridge University Press, Cambridge.
Merry, A.F.; Ramage, M.C.; et al., First-time coronary artery bypass grafting: the anaesthetist as a risk factor, British Journal of Anaesthesia 68 (1992) 6–12.
In: (Editors: Murray, C.J.L.; Lopez, A.D.) The global burden of disease and injury series, volume 1: a comprehensive assessment of mortality and disability from diseases, injuries, and risk factors in 1990 and projected to 2020 (1996) Harvard University Press, Cambridge, MA; Harvard School of Public Health on behalf of the World Health Organization and the World Bank.
Nashef, S.A.; Roques, F.; et al., Validation of European system for cardiac operative risk evaluation (EuroSCORE) in North American cardiac surgery, European Journal of Cardiothoracic Surgery 22 (1) (2002) 101–105.
Perrow, C., Normal Accidents: Living with high-technologies. (1999) Princeton University Press, Princeton New Jersey.
Reason, J., Human Error. (1990) Cambridge University Press, New York.
Reason, J., Managing the Risks of Organizational Accidents. (1997) Ashgate, Aldershot.
Reason, J., Human error: models and management, British Medical Journal 320 (2000) 768–770.
Richards, T., Chairwoman of Shipman inquiry protests at lack of action, British Medical Journal 332 (7550) (2006) 1111.
Runciman, W.B.; Merry, A.; et al., Safety and Ethics in Healthcare: A Guide to Getting it Right. (2007) Aldershot, Ashgate.
Runciman, W.B.; Merry, A.F., Crises in clinical care: an approach to management, Quality and Safety in Health Care 14 (3) (2005) 156–163.
Runciman, W.B.; Merry, A.F.; et al., Error, blame, and the law in health care – an antipodean perspective, Annals of Internal Medicine 138 (12) (2003) 974–979.
Sackett, D.L.; Rosenberg, W.M.; et al., Evidence based medicine: what it is and what it isn’t, British Medical Journal 312 (7023) (1996) 71–72.
Tenner, E., Why Things Bite Back – Technology and the Revenge of Unintended Consequences. (1997) Vintage Books, New York.
[/level-membership-for-internal-medicine-category][not-level-membership-for-internal-medicine-category]
Chapter 11. Managing risks to patient safety in clinical units
Alan Merry
Introduction
Unintended harm to patients from failures in healthcare is now recognised as a public health problem of considerable importance (see Sorensen & Iedema, Chapter 1). There is more at stake than the possibility of direct harm to patients. There are a number of dimensions of quality in healthcare and risk that may manifest at different organisational layers within the system (see Figure 11.1).
|
|
| Figure 11.1
(Source: reproduced with permission from Runciman et al 2007)
|
A balance must be found between investing in safety and the need to provide as much healthcare to as many patients as possible. An undue emphasis on safety by individual practitioners may lead to delays in treatment, increase the burden of illness experienced by patients on waiting lists, and in some cases reduce the effectiveness of the delayed therapy (because the benefit of some treatments depends on the timeliness with which they are provided). Redundancy (in the form of extra checks, extra staff, reserve power supplies, reserve equipment and so on) is an important way of promoting safety, but may also be seen as reducing efficiency. It may be difficult to work out the optimal balance between these conflicting considerations.
There may also be conflicts between risks for staff and the organisation and risks for individual patients – sometimes staff may feel that their own safety is best served by inactivity (declining to take on a difficult surgical case for example) or excessive activity (over-investigation of a patient before anaesthesia for example) in situations where some pragmatic middle course would be in the patient’s best interests.
Managing risks to patient safety in clinical units depends on interdisciplinary teamwork and on a cultural commitment to quality (which includes safety). In this chapter I will discuss critical aspects of effective risk management that include:
▪ understanding risk and the ways in which it can be measured
▪ understanding errors and violations and how these may occur in complex systems
▪ proactively identifying risks within one’s own unit
▪ actively reducing risk to acceptable levels without unduly impeding service delivery
▪ responding effectively when patients are harmed by healthcare.
Understanding risk
Many individuals find it difficult to evaluate the risk of infrequent events. People do not tend to use Bayesian logic when making decisions. Instead, they tend to be influenced by the nature of the hazard, their own personal experiences, social norms, and many other factors whose relevance may be more personal than logical. Marked fear of snakes or spiders is quite common, and generally out of proportion with any real hazard created by these animals. Furthermore, people who fear one do not necessarily worry about the other. Complacency about the substantial risks of smoking is common, but goes hand in hand with public expectations for the government to spend extraordinary amounts of money to further reduce the already infinitesimal risk of viral transmission through donated blood.
Expressing the risks of a particular procedure
From a clinical perspective, interest is typically in the risks of specific procedures. Published data tend to come from high-volume units, often from academic institutions, and often represent the best attainable results rather than the average. The actual risk of a procedure in the hands of one practitioner or one team may be quite difficult to establish because of the high numbers required to estimate the incidence of given adverse events with reasonable confidence limits. It is not often appreciated that (as a rule of thumb) a zero incidence of an event in x procedures could be associated with an upper 95% confidence limit of one event in x ÷ 3 procedures. Thus no adverse events in 10 procedures could be compatible with a true rate of 33%, and simply reflect a run of good luck. Conversely, one or two adverse events in a short series of procedures might be associated with surprisingly low true incidence. For example, two adverse events in 20 cases would give a point estimate of risk as 10% but with 95% confidence limits of 1% and 32%. Twenty events in 200 cases would give 10% (6%, 15%), and 200 in 2000 would give 10% (9%, 11%) – with all estimates rounded to the nearest integer.
Some ways of expressing the difference between two risks
Risk can be expressed in a number of ways. The most common expressions are ‘relative risk’ and ‘absolute risk’, the ‘odds ratio’, ‘numbers needed to treat’ (NNT) and ‘numbers needed to harm’ (NNH) set out in Table 11.1.
| Expression of risk | Discussion and example |
|---|---|
| The risk of an event | The rate at which the event occurs, e.g. 10 events per 1000 exposures would be a 10% risk rate. |
| The odds | The number of patients having the event compared with those not having it, i.e. using the above example, the odds ratio is 10:90, or 1:9. |
| Relative risk and odds ratio | The extent to which a treatment reduces the likelihood that an event will occur. For example, if a treatment reduces the occurrence of a particular event from 0.5% to 0.25%, the relative risk is 50%. The odds of the event without the intervention are 1:199 and with it 1:399. The odds ratio is therefore 1/399 ÷ 1/199. This is very nearly the same as the relative risk reduction. When the risks are higher, however, the difference between these two measures becomes greater. For example, reducing a risk of 50% to 25% also gives a relative risk of 50%, but the odds are 1:1 and 1:3 so the odds ratio in this case is 1/3 ÷ 1/1, that is 33%. |
| Absolute risk reduction | The difference between having a treatment and not having it. In our first example, the reduction in absolute risk is 0.25%, but in the second it is 25%. This expression perhaps describes the true benefit of each intervention or treatment more realistically than does relative risk. |
| Number needed to treat | The number of patients who need to be treated before a beneficial outcome occurs in one person. In the first example above, the NNT would be 400. |
| Number needed to harm | The number of patients who need to be treated before an episode of harm occurs in one person. |
The importance of exposure
An attempt is often made to compare risks of a medical procedure with those of a common every day activity. For example, anaesthetists often say that the risk of an anaesthetic is comparable with that of driving a car in traffic. This sounds plausible because the lifetime possibility of dying from one or the other event may be similar. However, for most people exposure to traffic is much greater than exposure to anaesthesia. It is important, therefore, to relate risk to exposure. The risk of undergoing anaesthesia in a developed country has been estimated as 1000 deaths per 100 million hours of exposure, while that of being in traffic (in any capacity) is only 50 deaths per 100 million hours of exposure. Interestingly, in relation to time of exposure, flying in a commercial aircraft is more dangerous than being in traffic, with a risk of 100 deaths per 100 million hours of exposure. Note that the way in which exposure is defined can make a difference here: if distance travelled were used as the denominator, then flying would be safer than driving a car (Runciman et al 2007).
The importance of underlying risk
The value of an initiative to reduce risk is dependent on the underlying rate of the adverse event in question. For example, a treatment that could reduce the risk of coronary artery disease by 10% would have no value if given to children, because they hardly ever get coronary artery disease. It is possible to stratify adults according to their risks of coronary disease, and it makes sense to invest in those groups at highest risk. A 10% reduction in this risk would give an absolute risk reduction of 0.1% if the underlying rate of the disease was 1%, and of 2% if the underlying rate was 20%.
Refining the concept of harm
One point often missed about studies like the Harvard Medical Practice Study (Brennan et al 1991) is that many of the deaths identified in these studies occurred in very sick patients who did not have long to live anyway (Hayward & Hofer 2001), and therefore, although not acceptable, they are not quite comparable with most deaths caused by road traffic accidents.
In addition to mortality rates, it might help to define the burden of iatrogenic harm in order to measure the quality adjusted life years (QALYs) (Murray & Lopez 1996) lost in this way, although there are limitations to the value of these indicators as well (La Puma & Lawlor 1990).
The importance of balancing loss against gain
Another limitation is the uni-dimensional nature of the results of these studies. Very little attempt has been made to balance the burden of adverse events from admissions to acute care institutions with the reduction in the burden of disease associated with the same admissions. When quantifying risk, some measure of accomplishment is useful to place into context the data on harm.
Process in healthcare – in pursuit of six sigma quality
Many medical activities are relatively straightforward, and it should be possible to achieve reliability levels equivalent to those now expected as normal in certain industries. The concept of ‘six sigma quality’ involves expressing the reliability of a given process in terms of standard deviations from the mean of a normal distribution. In effect, six sigma quality implies 3.4 failures per million events (procedures undertaken, or products produced). This level of reliability is expected in many industrial and manufacturing processes today, but if all adverse events are considered (not just deaths), it is not often achieved in healthcare, if ever. For routine processes this is no longer acceptable. It is time to clearly identify aspects of healthcare that lend themselves to process management, and adopt an approach for these that is process oriented, standardised, and strictly compliant with clearly defined and monitored guidelines.
On the other hand, it must also be recognised that not all aspects of healthcare lend themselves to the methods of industry. In general, diagnosis tends to be more demanding and depends more on experience and judgment than procedural work. Patients do not usually present with diagnoses emblazoned on their foreheads. A systematic and standardised approach will no doubt improve the likelihood of a correct diagnosis, but not all patients present in accordance with the textbooks. Even after a correct diagnosis has been made, there are many conditions for which the question of what to do next remains controversial. It is not easy to allow for uncertainty of this type when measuring the quality of healthcare.
Many procedural activities also involve considerable variation from case to case, and extend skilled practitioners to the limits of their ability. Performing a triple heart valve replacement in a 78-year-old patient is a very different proposition from replacing a single valve in a 40-year-old, for example. As another example, in major trauma each patient presents a unique combination of problems and requires sustained and creative effort from a large number of people working in unison. An activity of this sort is more like trying to win the World Cup in Rugby than like managing an industrial process.
Casemix and risk scores
Units that regularly undertake more complex and acute cases are likely to have more adverse events than those that concentrate on the routine and the straightforward. Some measure of differences in casemix is needed to take this variation into account. Various scoring systems have been adopted for this purpose – the EuroSCORE for cardiac surgery being one example (Nashef et al 2002) and the Goldman Index of cardiac risk for patients undergoing non-cardiac surgical procedures being another (Goldman et al 1977). Scores of this type are generated using regression analysis of information collected in large databases, and then validated by testing in other populations. They tend to become dated quite quickly as methods of managing medical conditions advance, and may not be reliable if applied to patient populations different from the ones in which they were developed.
Measuring performance over time
It is important to know not only whether a team or individual’s rate of adverse events is comparable with benchmark statistics, but also whether it is stable. Most time series of biological data exhibit variation, which can be of two types. Common cause variation may be thought of as ‘noise’. Thus a unit might have an infection rate that fluctuates by ± 2% around a mean of 5%. Fluctuation of this type usually reflects random variation from day to day, and the underlying rate may be stable from one year to the next. On the other hand, something may change. Some failure in process or alteration in resistance of microbes might lead to a jump to (say) 7% ± 2%, or some initiative to improve sterile procedures or the timely administration of antibiotics might lead to a fall to 3% ± 2%. The challenge is to detect special cause variation of this type in a reliable way. This is particularly important in relation to monitoring the effect of interventions to promote safety. Not only may such interventions fail to achieve their aim, they may even make matters worse (through so called ‘revenge effects’ (Tenner 1997)).
Simply comparing rates at two time periods may be misleading, in the absence of information about the long-term stability of the process in question. There are a number of better ways to distinguish special cause from common cause variation over time. Cumulative sum (cusum) charts (Bolsin & Colson 2000) and control charts (Carey, 2002a and Carey, 2002b) are two examples. The data for these charts may or may not be adjusted for risk. One method of using risk-adjusted data to monitor the ongoing performance of an individual or a unit is the variable life-adjusted display (VLAD) chart. It is sometimes used in cardiac surgery, where it is possible to calculate an expected survival rate using scoring systems and each patient’s known risk factors. Outcomes (death or survival) can be plotted against numbers of cases operated on. If a particular patient has an expected survival probability of 0.9 (or 90%) and survives, the plot is moved one unit along the X-axis and 0.1 along the Y-axis in a positive direction. If such a patient dies, the plot is moved one unit along the X-axis and 0.9 units along the Y-axis in a negative direction. At the end of 10 cases, if as expected one dies and nine survive, the plot will have moved 10 points along the X-axis and will be at zero on the Y-axis. Statistical limits can be set to identify points at which it becomes likely that one is dealing with special cause variation rather than common cause. VLAD charts have much to offer in relation to procedural work where high levels of standardisation are possible, and where clearly definable adverse outcomes (such as death) are relatively common. A Microsoft Excel spreadsheet for creating VLAD charts on the basis of the logistic EuroSCORE can be downloaded from The Clinical Operational Research Unit at University College, London. 14
Defining acceptable standards
A point often missed in relation to any of these methods is that results are inevitably defined as acceptable in relation to the norms for a particular group. It is important to understand certain implications of this approach. In any one clinical unit it is a statistical inevitability that one practitioner will get the best results and another will get the worst. If one had 10 surgeons, evaluated results and fired the worse performer in the name of quality improvement, one would simply have reduced the group to nine, with a different surgeon in the bottom place. In the same way, demands that all practitioners should be better than average are statistical nonsense. Some adequately performing clinicians must, by definition, be operating below the average, and there is no possible way of changing this fact.
Pause for reflection
Some healthcare professionals are ‘insiders’ and in the privileged position of knowing the results of their colleagues. Would such a person elect to undergo cardiac surgery from the member of the unit who has the worst outcome data? Would the decision to choose the surgeon with the best results be (a) rational and (b) ethical?
This discussion is not trite, because no patient, if asked, would say he or she wanted to be operated on by a surgeon whose results were ‘below average’, let alone the worst surgeon in a group. However, in a clinical unit, all surgeons have to contribute to the work.
Yet another difficulty is that the clinical situations that lend themselves to an analysis of this type are very much in the minority. Is it equitable that many cardiac surgeons today are required to have their results publicly scrutinised while their colleagues in general medicine, psychiatry and geriatrics are not? Actually, even their anaesthetic colleagues tend to be left out of this process, notwithstanding evidence that the anaesthetist may contribute to outcome after cardiac surgery (Merry et al 1992). It could be argued that there is merit in applying sound methods or monitoring performance where possible, and in working towards improving the situation where it is not. Alternatively it could be argued that the inequitable application of harsh standards to isolated groups is likely to do little more than promote gaming. For example, risk scores are known to be inaccurate at the extremes, so in practice patient selection will probably influence the results of a VLAD chart even though this should not happen in theory.
Two more points are relevant to this debate. Statistics apply to groups rather than individuals. A risk of 10% means that 10 of the next 100 patients are likely to die, but for each patient the result will be unpredictable, and will be either life or death (not 10% death). Morbidity is also important – in the example of cardiac surgery the risk of stroke is significant, may differ from the risk of death, and may be more feared by patients, but strokes are seldom incorporated into risk scores or monitored with VLAD charts. Also the management of patients goes beyond procedural results, and includes decision making in the first place, and then the whole amalgam of interpersonal skills, compassion and professionalism that might be very important to individual patients. Thus it can be seen again that the use of a uni-dimensional measurement such as a mortality rate is inadequate as a means of measuring performance in an endeavour as complex as healthcare.
Where databases are large, and many individuals contribute to the data, a normative approach based on reasonable outcome measures is fairly satisfactory, but its limitations should not be forgotten. In most cases the difference in outcome between the best and worst clinician in a unit should be small. Any difference will become statistically significant if very large numbers of data are available for analysis, but ideally the difference between individuals within one unit should not be clinically important. In fact the point is not whether one is the best or worst performing individual available to a patient, but whether one’s performance is good enough. The same thing can be said of units (see Box 11.1)
Box 11.1
At the paediatric cardiac unit of the Bristol Royal Infirmary 29 children died and four were left brain damaged following open heart surgery between 1984 and 1995. This was twice the expected mortality rate. A major inquiry was undertaken, and 198 recommendations were made, which led to many reforms in medical practice in the UK, including the establishment of more rigorous requirements for monitoring the results of surgery.
It can be seen that there may be clinical units in which the important question is not which surgeon is the best on the team, but rather whether the team as a whole is functioning to a standard that is acceptable at all.
The importance of the team
Many of the difficulties associated with monitoring performance become less marked if the emphasis is placed on the team rather than on the individuals within it. This approach still depends on making sure that all individuals are performing adequately, but it is more likely to be associated with standardisation, the universal adoption of evidence-based approaches, teamwork and supportiveness, and better outcomes for all patients.
Given the large numbers of units across the world, there is no reason why one’s own unit should not aspire to being better than average. If all units worked hard to achieve that goal, the average standard overall would improve (even if the number below average remained obdurately at 50%!).
Legal implications of risk in healthcare
Increasingly, risk management is being driven by legislative requirements. Some of the legal pressures are proactive – explicit demands for accreditation for example. Others are reactive – litigation in response to patient harm for example. In most countries today legal considerations weigh heavily when decisions have to be made about how much of a limited resource should be invested into risk management.
Accreditation
Accreditation is a formal process for demonstrating that an organisation complies with certain standards. The degree to which accreditation of healthcare is compulsory varies from country to country and so does the process by which it is achieved. In the US the Joint Commission on Accreditation of Healthcare Organizations (JCAHO) provides accreditation required to obtain reimbursement from Medicare and Medicaid (healthcare funding for the elderly and poor respectively). In Australia and New Zealand there is a trend towards greater emphasis on accreditation. For example, the Australian Commission on Safety and Quality in Healthcare developed a national standard for credentialling and defining the scope of clinical practice in 2004, and this has formed the basis for initiatives by state governments such as introducing a policy for the credentialling of senior doctors appointed to public health services in Victoria. 15
Compliance with standards can be assessed by considering structure, process or outcome (Donabedian 2003). In theory, if it were possible to measure relevant outcomes adequately, there would be little need to measure anything else, but in practice this may be much more difficult than establishing that the required buildings, equipment and personnel are in place (i.e. that the structure of the organisation is adequate) and that the right protocols, clinical pathways and other process tools have been established and are in use.
Tort
In many countries there has been a substantial increase in the cost of litigation related to healthcare during the second half of the last century, and in the UK, US and Australia the costs of the tort system now amount to 1% of expenditure on healthcare (Runciman et al 2007). In New Zealand a no-fault system of accident compensation was established following the 1967 Sir Owen Wodehouse report, and it is essentially unknown for doctors to be sued for negligence (Merry & McCall Smith 2001). Today the Accident Compensation Corporation is responsible for promoting safety within the healthcare system proactively and for compensating patients after they have been harmed. The tort system tends to be slow, inefficient and somewhat capricious in the degree to which it achieves any worthwhile outcomes for patients, healthcare professionals or the system as a whole. From first principles the New Zealand approach appears to be more effective, and it is popular with New Zealanders. Individual practitioners are still held to account through the investigations of the Health and Disability Commissioner and through disciplinary actions by the Medical Council, but on the whole, organisations are less at risk from the repercussions of harming patients than they would be if lawsuits were still possible. It is hard to obtain data on the relative effectiveness of these different systems in promoting safety, but it is at least possible that the loss of the tort system from New Zealand has removed one incentive for hospital administrators to invest in safety initiatives.
Criminal law
It ought to go without saying that the role of criminal law in healthcare is to deal with seriously culpable behaviour (Merry & McCall Smith 2001). Unfortunately, in New Zealand in the 1990s, and more recently in the UK, there has been a tendency to respond to tragic accidents that have resulted in the deaths of patients by charging healthcare professionals with manslaughter. In many cases the level of negligence involved has been minimal (Ferner & McDowell 2006) and only a minority of the charges have been successfully prosecuted, but the impact on all concerned has been very substantial. This topic has been discussed in greater depth elsewhere (Merry 2007).
Whose risk should we manage?
One of the difficulties with legal responses that focus on punishing individual practitioners, and even with those in which the primary aim is to provide compensation for patients, is that they do little to promote safety at an organisational level. In fact, the motivation for many so-called safety initiatives is the protection of administrators, clinical leaders and individual practitioners. This is particularly true of some policies instituted in the name of safety or quality (see Box 11.2.)
Buy Membership for Internal Medicine Category to continue reading. Learn more here
[/not-level-membership-for-internal-medicine-category]
