[level-membership-for-internal-medicine-category]
Chapter 1. Managing clinical processes: objectives, evidence and context
Roslyn Sorensen and Rick Iedema
Introduction
Good health is important to individuals and to national economies (Suhrcke et al 2006). Without good health, economic prosperity and the wellbeing of individuals suffer. Consequently, health is an important responsibility for governments, and is often the biggest and most politically sensitive of portfolios, especially in countries where healthcare is predominantly publicly funded. Governments actively manage the main indicator of a population’s health, health status, and their success in doing so is evident in their ranking on health outcome measures relative to their peers. To maintain their performance standing, governments must manage pressure on resources to balance the demands for healthcare with those of other portfolios, such as defence, education, and law and order. Making the best use of resources is therefore an important objective for all health systems.
The use of resources can be maximised by optimising the quality of care. Care provided in the right way the first time that produces expected outcomes will be less expensive than poor-quality care that has to be repeated. While the quality of care in most developed countries is good, it is not as good as it could be. Quality is being scrutinised and judged as deficient, based on findings that the level of adverse events in the health services of many developed countries is high. This is despite generally good health outcomes overall and patient satisfaction with the system. But optimising the quality of healthcare and maximising resource use, i.e. producing cost effective care, is difficult. Healthcare is complex: multiple caregivers from diverse backgrounds who are often geographically dispersed in independent services deliver a range of services that need to be coordinated. Healthcare is expensive: the rapidly advancing technologies of health are costly and the demand for them is potentially insatiable. Hence, cost effectiveness will depend on how well those who manage health services and those who deliver them agree on the goals of care, understand the methods for their achievement and cooperate to do so.
Healthcare goals are generally not well integrated at either the policy or service level. Emphasising any single goal to the exclusion of others can be detrimental to achieving comprehensive health service outcomes. Policymakers commonly use budgeting and service downsizing to contain the cost of care; clinicians commonly call for more funding as the answer to quality problems. But containing costs without attention to other equally important goals may have unintended effects on quality and safety, and increasing funding without reference to available resources or accounting for those consumed may jeopardise service sustainability. Hence, the overriding aim for all health systems should be to achieve good quality care without risk to patient safety while maximising resource use. Achieving this aim will mean simultaneously managing the three main elements of healthcare, namely quality, risk and resources, at the point at which care is produced, that is, in health services. Doing so will mean moving beyond just managing the clinical particularities of individual patients or the organisational abstractions of performance targets, to redesigning systems so as to link these two ends coherently, productively and practically. To discuss how this can be done, this introductory chapter:
▪ outlines the objectives of managing clinical processes in health services
▪ provides evidence for the importance of managing seemingly conflicting objectives simultaneously
▪ discusses the context within which clinical process management takes place.
The objectives of managing clinical processes
The relationship between health outcomes and health services
Health status is an indicator of the state of a nation’s health. Most OECD countries achieve similar levels of performance on key indicators of health status, particularly life expectancy (OECD 2005). Most countries seek to protect their ranking and actively manage this measure. However, while health status outcomes are impressive for non-Indigenous populations, those for Indigenous populations are often much lower (Bramley et al 2004) and the gap may be widening (Freemantle et al 2007). Table 1.1 below sets out selected indicators of performance on health status for selected peer countries. The data show overall performance and performance on specific life-expectancy measures for the four leading countries in 2004, compared with those of other selected OECD peers.
Health targets, such as health status measures, are important because, theoretically, they focus the system on the effectiveness as well as the efficiency of care. However, the extent to which health status outcomes are linked to health service effectiveness and efficiency is not clear. For instance, the proportion of funds spent on health is not necessarily an indicator of performance on health status outcomes. As an example, Japan has one of the lowest proportions of GDP spent on health (8% in 2003) but a high overall life expectancy (81.8 years), while the US spends a relatively high proportion of its GDP on health (15.2% in 2003) but has a lower overall life expectancy (77.5 years) (OECD 2006b). If health status outcomes are not necessarily linked to the size of health budgets, other factors must explain the difference. Knowing what factors ‘produce’ health and understanding how budgets are spent is therefore important in understanding such differences. But health reform policy and programs aimed at improving health service performance appear to be largely separated from the policies and programs that underpin health status outcomes. Busse & Wismar (2002) describe health targets as the ‘forgotten corner’, because of their separation from the main agenda of health services reform. A comparative study of national and regional health target programs among OECD peers, including the European Union, Australia, Canada, New Zealand and the US, showed that Australia alone linked health targets to health services performance (Busse & Wismar 2002).
Busse & Wismar offer a number of reasons for this separation. Firstly, the policies and programs that support health targets tend to be top-down and the involvement of the general public or their elected parliamentary officials is limited. This means that policy may not contain strategies to encourage grassroots alliances to mobilise health improvement activities in the community and in health services. Secondly, and consequently, there are few incentives for local and professional individuals and groups to be involved. This is important because getting the agreement and commitment of those who produce and co-produce health is a significant factor in improving health outcomes. Yet the evidence is clear that integrating community and professional groups in decisions that affect them is effective. Communities can make difficult decisions about prioritising health services in the face of scarce resources. This is evidenced by the Oregon experiment in the US that sought to involve communities in rationing decisions that took into account the health of vulnerable groups, and the New Zealand experience where professional groups assisted government to develop rationing criteria for elective surgery (Hadorn & Holmes 1997, Klein et al 1996). Importantly, Wiseman et al’s Australian study found that the public overwhelmingly want their preferences to inform decisions about priority-setting and funding allocation (Wiseman et al 2003) (see Mooney, Chapter 13).
Pause for reflection
Communities can participate meaningfully in decisions about setting priorities and allocating resources in health, and community values can become a criterion for decision making. How might governments take community capacity and values into account?
For governments, a constant priority is managing the gap between the supply of health services and the demand for them. Governments tend to use the blunt levers of economic policy to contain costs to manage the gap, in preference to more organic processes that involve communities in such decisions. The European Union, Australia, New Zealand and Canada all use economic policy in this way, as do the US and Japan (Abel-Smith & Mossialos 1994, Fujii & Reich 1988, Malcolm 1990, Segal 1998, Dickey 1997, Byrne & Rathwell 2005). Economic policy is a useful lever for governments to manage health services, because it allows control over resource allocation at the macro level at which government decision makers operate. Moreover, the pressures on the health system are likely to continue, hence the pressures on governments to manage the gap between service supply and demand will also continue. Managing the resource consumption of health services will remain an important strategy to contain public spending on health to within manageable levels as populations in developed countries age, the demand for expensive advanced medical technology rises and consumer expectations about choice, access, quality and accountability increase.
Pressures on the health system
These pressures on the health system need to be taken into account when assessing how well they perform. Health service performance is affected by the rising cost of care, the increasing demand for services, the levels of risk to patient safety and the overall quality of care. Each of these pressures is discussed briefly in turn.
First, in terms of the rising cost of care, health services consume a sizable portion of a nation’s resources. Table 1.2 below compares the total expenditure on health as a percentage of GDP (gross domestic product) for selected OECD peers from 1960 to 2004. The expenditure of these countries (Australia, Canada, New Zealand and the UK) is compared with that of countries with relatively low and high expenditure (Japan and the US respectively). The data show that for the six countries selected, all experienced substantial rises in the percentage of GDP spent on health over the 44-year period. National budgets are finite, and as health spending rises, the proportion of GDP spent in other areas of need reduces. Consequently, most governments actively manage their expenditure on health. The high level of public funding facilitates such management, although countries such as the US experience more difficulty, presumably because of a dominant private sector (OECD 2006a) less amenable to centralised cost containment objectives.
| 3OECD data for New Zealand GDP spent on health began in 1970. |
||||||
| Source: OECD 2006 | ||||||
| Country | Australia | Canada | NZ | UK | Japan | US |
|---|---|---|---|---|---|---|
| Year | ||||||
| 1960 | 4.0 | 5.4 | 5.1 (1970) 3 | 3.9 | 3.0 | 5.1 |
| 2004 | 9.6 | 9.9 | 8.4 | 8.3 | 8.0 | 15.3 |
Second, the demand for health services is rising, and is likely to continue to rise in line with the ageing of the population in developed countries. As an example, Figure 1.1 below shows the increase in admitted patients in Australian hospitals from 1998–99 to 2004–05.
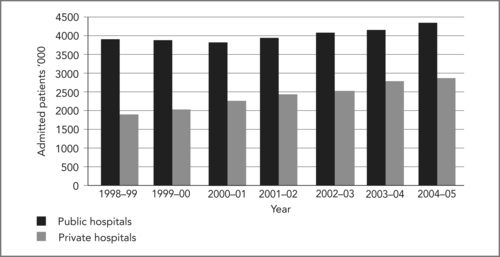 |
| Figure 1.1 |
Governments and health services must manage this increasing demand, and health resources must be rationed to manage it within allocated budgets. Reducing bed numbers and patients’ lengths of stay are common strategies to contain costs within budget limits while maintaining patient throughput. Table 1.3 below shows data for seven selected countries, as in Table 1.1, for 2004 on three key indicators of efficiency, namely waiting times for health services, average lengths of stay and proportion of hospital beds per 1000 population. The data vary widely. Of the two countries with lower lengths of stay (Sweden and New Zealand) and bed ratios (Sweden), each experiences waiting times for rationed hospital services to contain the proportion of GDP spent on health: for Sweden to 9.1%; for New Zealand to 8.4% (OECD 2006b). The two countries that report no waiting times for hospital services (Switzerland and France) also have the highest proportion of beds, and in the case of Switzerland, the highest average length of stay. Thus, the trade-off for maintaining access to health services with no waiting times appears to be a higher proportion of GDP spent: for Switzerland 11.6% in 2004; for France 10.5% (OECD 2006b).
| Performance statistics | Switzerland | Sweden | Spain | France | Australia | Canada | New Zealand |
|---|---|---|---|---|---|---|---|
| Are there waiting times at hospitals for health services? | No | Yes | Yes | No | Yes | Yes | Yes |
| Average length of stay in hospital – days | 9.2 | 5.0 | 7.5 | 5.5 | 6.2 | 7.2 | 3.3 |
| Hospital beds/1000 | 3.9 | 2.4 | 3.2 | 8.4 | 3.8 | 3.2 | 6 |
The extent to which reducing bed numbers is a sustainable strategy to manage throughput and cost emerges in Figure 1.2 overleaf. The data show that as an example the consistent reduction in bed numbers in Australia from 1998–99 to 2002–03 was not sustainable, with bed numbers rising again from 2003–04.
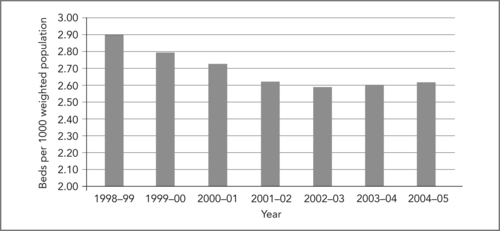 |
| Figure 1.2
Source: Australian Institute of Health and Welfare (AIHW) 2004, Australian Hospital Statistics 2002–03; Australian Government Department of Health and Ageing, Australian Health Care Agreement data reported by the states and territories (2003–04, 2004–05)
|
Third, risks to patient safety have become a priority for many health services in developed countries (see Warburton, Chapter 9 and Merry, Chapter 11). The methodology to quantify adverse events developed in the 1990s has revealed a pattern of patient risk associated with acute inpatient admissions within a relatively consistent range across selected countries for which data are available, from 7.5% in Canada to 17.7% in the US, as Table 1.4 shows.
| 4Similar protocols were used so that comparisons can be made across studies (Baker et al 2004). | ||
| Sources: Baker et al 2004, Andrews et al 1997, Davis et al 2001, Vincent et al 2001, Wilson et al 1995, Schioler et al 2001 | ||
| Country | Percentage of admissions associated with an adverse event | Focus of study |
|---|---|---|
| Australia | 16.6 | Acute hospital admissions |
| United States | 17.7 | Acute hospital admissions |
| United Kingdom | 10.0 | Emergency department |
| Canada | 7.5 | Acute hospital admissions |
| New Zealand | 12.9 | Acute hospital admissions |
| Denmark | 9.0 | Acute hospital admissions |
Three issues arise from these data. First, a large majority of the adverse events reported caused significant disability or death and were considered highly preventable: 57% in the Australian study (Wilson et al 1995). Second, the cost of adverse events was high, estimated to be in excess of $800 million per annum, again in the Australian case. This represents a significant proportion of the health budget that potentially could be directed to meeting the supply–demand gap. Third, these figures raise questions about their cause, whether individual clinicians are at fault, or inadequate systems. This issue is important when decisions about health service priorities and funding for improvements are being considered.
Errors occur in all health and hospital services and must be managed as routine. For instance, Cullen compared adverse drug events in ICUs with events in non-ICUs (Cullen et al 1997) and when adjusted for volume, the rates were found to be comparable. This study is significant, because it revealed that preventable and potential adverse drug events occurred in units that functioned normally, involving caregivers working under reasonably normal circumstances and not necessarily or not only in units at the extremes of workload and stress, such as ICUs. Cullen’s estimate of cost of between $5.6 and $2.8 million in a 700-bed teaching hospital suggests that eliminating error is not only good for patients, it is also good for budgets.
In addressing the issue of cause, Baker et al believes that poorly designed systems are at fault. This view notwithstanding
[H]ealth care organisations have historically focused on identifying and disciplining clinicians who were closest to incidents. However, experts suggest that the greatest gains in improving patient safety will come from modifying the work environment of healthcare professionals, creating better defences for averting adverse events and mitigating their effects.
(Baker et al 2004:1678)
The implications of this for managing clinical processes arise in terms of the types of solutions devised to address adverse events, and whether they should focus on improving the skills and competencies of individual clinicians, or rectifying underlying systems problems.
Fourth, the overall quality of health services has concerned policymakers, health service managers, clinicians and patients, and it had done so well before the high levels of adverse events came to light. The problems with quality are serious and extensive. Chassin (1998) maintains that they arise from treatment underuse (failure to provide a treatment when needed), overuse (when harm exceeds the benefit of a treatment) and misuse (when complications occur from the treatment). He maintains that the need for rapid change in health services is urgent because
[O]ur present efforts resemble a team of engineers trying to break the sound barrier by tinkering with a Model T Ford. We need a new vehicle or, perhaps, many new vehicles.
(Chassin 1998:1005)
Pause for reflection
New vehicles are required to manage the increasing demand for health services and the rising cost of care while minimising the risks to patient safety and improving the overall quality of health services. What might these new vehicles look like?
Strategies to improve performance
Policymakers and health service managers have generally responded to the problems in overall quality with broad quality improvement programs such as continuous quality improvement (CQI). Just how effective such programs are is uncertain, because of a paucity of evaluation. Some clinicians believe that the quality of care has actually deteriorated in the countries where they have been implemented (Ferlie & Shortell 2001). A possible reason for this is that the broad scope of programs is too ambitious as they attempt to cover the myriad systems that appear to impact on quality. Thus, the links between cause and effect have been difficult to establish. What these programs do reveal is further evidence of wide variations in the processes and outcomes of care in technologically advanced systems.
Ferlie & Shortell (2001) suggest that organisation-wide quality improvement programs may serve a ritualistic purpose – as a habitual response to the institutional demands of accreditation and government bodies. The programs are criticised because they often lack a consistent external driver, adequate information systems, clinician involvement and senior management leadership and support. Further, the difficulty of adapting private sector principles and practices (on which such programs are generally based) in the public health sector raises questions about their appropriateness. What these criticisms illustrate is that the particular environment of public health services is a critical factor in trying to change them, and that the underlying and more conventional and circumscribed ways of organisational working are influential. Concepts such as ‘the learning organisation’ have become popular in fostering attitude change and in initiating skills and practices to generate and manage knowledge around attributes such as culture, leadership, teamwork, communication and technology. Yet despite repeated recommendations that urgent attention be given to these underlying system connections, comprehensive action has yet to occur (Hindle et al 2006).
Efforts to remake these connections to improve quality are often hampered by a lack of clinically relevant information. Central administrators favour tools such as business process reengineering, lean thinking, six sigma, 5 root cause analysis and statistical process control. But when applied from the corporate level of the organisation, these tools can fail to provide meaningful information to operational clinicians and managers. Applying such tools in the public sector in the same way as they are applied in the private sector will not necessarily achieve expected results, especially if management commitment is not sustained, expectations are unrealistic or change is resisted in the workplace (Vakola 2000). Expectations, for instance, that ‘(t)he fundamental rethinking and radical redesign of business processes (will) … achieve dramatic improvements in critical, contemporary measures of performance, such as cost, quality, service and speed’ (Hammer & Champy 1993:32) suggest that a fashion is being followed rather than a sustainable strategy being adopted to address the difficult, complex, and different, problems in the public health sector.
5Six sigma is one of a number of performance improvement tools. Chassin (1998) defines it as ‘a statistical measure of variation … (A)dopting the goal of Six Sigma quality means setting tolerance limits for defective products at such high levels that fewer than 3.4 defects occur per million units (or opportunities)’ (Chassin 1998:566).
Nonetheless, the type of tools described above could potentially produce clinically relevant data for decision making if applied at clinical unit level. An example is developing and prioritising workplace strategies to detect errors and prevent adverse events.In this respect, while the systems origin of error is largely accepted, there is contention about where the responsibility for remedy should lie. Clinical governance policies place the main responsibility for practice change on clinicians, particularly doctors, but the voluntary uptake of clinical governance initiatives means they are variable and sporadic. Initiatives such as clinical incident monitoring do appear to have positively influenced clinicians’ critical reflection about their performance and practice, albeit in isolated pockets (Iedema et al 2006a), but as presently structured, clinical governance policies are not sufficient to comprehensively implement formal systems to routinely monitor performance in clinical workplaces and to integrate performance across the organisation. While this may suggest that the immediate responsibility for implementing risk management strategies should lie with hospital managers, the task is well beyond the capacities and resources of individual hospitals and of individual hospital managers.
Pause for reflection
Clinically relevant data is essential to providing clinicians and clinical managers with meaningful information with which to identify problems and generate workable solutions. How should this data be produced, who should do it and how can it be applied?
Yet managerial strategies to improve clinical performance are common in public health services – think of efficiency, downsizing, performance indicators, clinical targets and practice reform guidelines. These strategies have an advantage in shifting the focus of change to the health service itself, although centrally managed health service objectives can have unforeseen consequences. One critique is indicator proliferation. In the case of the UK National Health Service (NHS), indicators of performance on which managers were required to report rose to 2500 in 1989 (Carter et al 1995). Centralising health service management to this degree is neither feasible nor desirable, nor is it a coherent, constructive or sustainable strategy. The NHS, for example,
… is a confusing ant heap of frenetic, but frequently uncoordinated sets of unrelated activities, which somehow add up to the delivery of healthcare to the entire population. Not only is it the largest organisation in Britain; it is the only one whose services are used by almost every woman, man and child every year (with) … about 250 million contacts annually between the NHS and consumers.
(Carter et al 1995:102)
Such centralised objective setting and performance management is not popular with clinicians or with health service managers. In the view of clinicians, instrumental top-down management methods have contributed to the erosion of quality of care and public confidence in the system (Hornick et al 1997). In the view of managers, health service delivery is over-administered and under-managed (Hunter 1996). Neither clinicians nor managers have faith in the application of market-based private sector principles to public sector problems. Where objectives are in conflict or contradictory, bottom-up strategies may be more suitable to manage problems and implement realistic solutions. Top-down strategies that seek to separately micromanage single performance goals are unlikely to make a significant impact on the type of health system activity that Carter et al describe above. Rather, organic strategies are more likely to work if developed incrementally, are grounded in the social reality of clinical care, involve frontline staff in their design and implementation, and are capable of being incorporated within a comprehensive framework of service planning and performance evaluation.
Pause for reflection
Organically derived performance improvement strategies and associated performance indicators are needed to drive change from the bottom up, and capable of being incorporated within a comprehensive framework of service planning and performance evaluation. How might this occur?
Planning and evaluation frameworks are important to bring a sense of purpose and cohesion to complex systems, especially when they are in rapid transformation. Ideally, centrally developed frameworks would be limited to setting broad objectives and performance targets for national priorities (Ham 2005). Deciding on the particular strategies through which to implement these broad national targets should lie with health organisations themselves. Hence, decentralising decision making assumes a shift of power away from over-centralised strategies and micromanaged problems to more autonomous health services to tailor performance improvement strategies to local need, local conditions and local cultures.
Only in this way will the enterprise of managers and clinicians at the local level be released to deliver the further improvements in performances set out in (a) new planning framework.
(Ham 2005:107)
Thus, improvement is more likely to occur from knowing how clinical work is done and managing the clinical processes through which healthcare is evidence based and planned, organised, evaluated and managed by multidisciplinary teams around high-demand, high-cost, high-risk clinical treatments, than from generic, derivative, instrumental approaches. This will be the case especially if those who make the decisions about clinical treatment and hence resource use, namely clinicians and clinical managers, have the knowledge, resources, skills, enthusiasm and organisational authority to do so. As demand and resource containment intensifies in the public health sector, so too will pressure on clinicians and clinical work. This will further intensify with concerns about unsafe practices and inadequate systems. Thus, understanding the detail of clinical work and clinical systems is doubly critical to managing it. Yet the focus on managing inputs remains strong at the central policy level even though central scrutiny and surveillance has not significantly improved service access, cost, risk and quality.
Evidence for managing clinical processes
The technical dimension of clinical work is the one most often targeted for performance improvement. There is a view that implementing technically best practice models of care will reduce practice variations and eliminate unanticipated outcomes. It is generally not well recognised that this technical element is just one factor among others in successful organisational change (Iedema et al 2006b). Social factors also affect the way people relate to each other and communicate to produce complex and diverse care that is delivered by myriad clinicians in geographically dispersed locations (Muir Gray 1997). Hence, the social dimension of managing clinical work is emerging as an important element in organisational change (Harteloh 2003). However, social factors are not routinely included in change programs, especially in organisations where scientific paradigms dominate. Similarly, organisational factors that affect what is done, by whom, when, in what sequence, with what outcomes and purpose are also often neglected.
Box 1.1
A framework of health system objectives and health service performance is essential to prioritise improvement strategies, to coordinate and align actions and to evaluate outcomes. Who should set objectives and monitor performance and how can policy development be dynamically linked with strategy implementation?
Pressures on health services come from the rising cost of care, the increasing demand for services and consumer expectations of quality. If good health outcomes are important to individual people and national economies, how can the focus of performance be redirected from managing costs to managing cost effectiveness?
Cost effectiveness means managing quality, risk and resource use simultaneously. How can these three elements unite within a comprehensive method of clinical process management and how will the connections be made between those who make health policy, those who organise health services, those who deliver them and those who consume them?
Awareness of the significant variations in technical care across practitioners has brought forth a plethora of guidelines that enunciate and promote evidence. The range of guidelines developed in the diverse areas of medical, nursing and allied health attests to the potential of guidelines to improve quality, outcomes, service and resource use in a wide range of clinical conditions (see Claridge & Cook, Chapter 4 and Berding, Resources). The technical importance of guidelines has been well established to the point that guideline proliferation has become a problem. Our intention is not to go over this well-trodden ground but to consider how guidelines can be implemented and whether their use can be sustained. While technical–rational knowledge is essential in acquiring and appropriately applying clinical practice skills, it is just one facet of clinical practice improvement. Achieving evidence-based practice is a multifaceted endeavour that includes social, organisational and technical factors (Grol 2001).
Pause for reflection
Improving health service performance comprises technical, social and organisational factors integrated within a comprehensive strategy of organisational change. Why is this so?
In the case of guidelines for acute coronary syndrome (ACS) boxed below, implementing evidence-based models of practice requires not only technical skills, but also political, social and organisational ones (Gibler et al 2005).
Gibler (2005) identifies the predictors of successful guideline implementation as being strong clinical champions who have the necessary communication skills to influence others and a general willingness to collaborate. This implies that forging collaborative and collective approaches to managing care for populations of patients among clinicians socialised within traditional, individualistic professional cultures is a precondition to achieving the technical objectives of care. It appears that the scepticism of unprepared senior clinicians can alienate others and discourage their participation in improvement activities. Thus the social dimension of change is critical
… because organizations are composed of people who react or fail to react to perceivedchanges in the environment [;] it is the activities of people that determine how organizations become structured.
(Barley & Kunda 2001:79)
Box 1.2
Practical implementation of the guidelines for unstable angina/non–ST-segment elevation myocardial infarction in the emergency department
A variety of barriers to guideline implementation are experienced in the emergency setting. Delays in receiving cardiac biomarker data because of slow laboratory turnaround, high patient volume in the ED (emergency department), decreasing throughput, and a lack of standardised diagnostic and treatment approaches are only some of the barriers that can inhibit providing appropriate care to patients. Specialties other than cardiology provide inpatient care to individuals with ACS. Making all physicians who care for these patients aware of the 2002 ACC/AHA UA/NSTEMI guidelines is a significant challenge in any hospital setting. Finally, multiple cardiology groups at an institution can make an agreement on specific diagnostic and treatment regimens for patients with ACS difficult to achieve.
Source: Gibler et al 20056
Thus, collaboration and cooperation is the key to the way clinical work is done in health, specifically between doctors and nurses, clinicians and managers, and with patients and their families. But such collaboration is fraught with difficulty. People hold different perceptions about the meaning of collaboration and the extent to which it actually exists. Doctors report high levels of collaboration with nurses and other doctors; nurses report lower levels of collaboration than do doctors (Surgenor et al 2003). Further, nurses, and patients, are often excluded from participating in care planning and decision making that affects them (Bryan-Brown & Dracup 2002). An associated difficulty is the effect of cost containment policies on nursing numbers and the loss of morale, enthusiasm, corporate knowledge and organisational cohesion that this entails (Finlayson et al 2002). Moreover, collaboration between medical sub-specialists about patient care cannot be assumed (Sorensen & Iedema 2006) and the multidisciplinary treatment of patients within clinical units and the flow of patients between clinical units is often sub-optimal (McQuillan et al 1998).
Pause for reflection
Collaborating to achieve good patient care is based on values such as being an inclusive team member, pooling information and sharing decision making. What types of social skills will clinicians and managers require to become good team members?
The social capacity of clinicians and managers to communicate effectively is important to the organisation of care, specifically in generating, integrating and managing knowledge within and between clinical workplaces, between clinical and managerial domains and between different healthcare sectors. Assumptions are often made that clinicians and managers know what to do and how to do it. This is not always the case (Iedema et al 2004).
To illustrate this point, consider Table 1.5 below, which presents research findings from 12 acute clinical settings and details the number of multidisciplinary clinical caregivers who treated patients undergoing an elective caesarean section, a relatively routine procedure (Sorensen et al 2003). The data show that in a random sample of patients (between 32 and 46 patients across settings), the average number of clinicians caring for these patients ranged from 4.3 to 9.6. Of these, only 6.8% treated more than 10 patients in each setting, and patients were located in as many as 10 different wards. These findings suggest that bed management policies do not mandate the collocation of patients with similar conditions and that multiple caregivers with varying levels of knowledge, skills, confidence and expertise deliver and manage patient care. Hence, ward-based clinicians may be relatively inexperienced in managing the wide mix of patient care needs that confront them, including relatively routine treatment as well as complex care.
| Nursing | Medicine | Allied health | ||||||||
|---|---|---|---|---|---|---|---|---|---|---|
| Setting | Patients | No. of wards | Nurses | No. of nurses over 10 patients | Doctors | No. of doctors over 10 patients | Allied health | No. of AH over 10 patients | Total setting | Total over 10 patients |
| 1 | 35 | 4 | 165 | 6 | 75 | 5 | 2 | 0 | 242 | 11 |
| 2 | 46 | 5 | 160 | 13 | 67 | 8 | 6 | 2 | 233 | 23 |
| 3 | 43 | 3 | 148 | 3 | 50 | 8 | 8 | 0 | 206 | 11 |
| 4 | 43 | 6 | 177 | 4 | 74 | 8 | 5 | 1 | 256 | 13 |
| 5 | 41 | 10 | 219 | 6 | 92 | 2 | 14 | 3 | 325 | 11 |
| 6 | 39 | 3 | 161 | 13 | 80 | 5 | 25 | 0 | 266 | 18 |
| 7 | 39 | 2 | 124 | 5 | 54 | 9 | 8 | 1 | 186 | 15 |
| 8 | 38 | 1 | 146 | 15 | 46 | 8 | 13 | 0 | 205 | 23 |
| 9 | 42 | 4 | 178 | 14 | 63 | 7 | 4 | 0 | 245 | 21 |
| 10 | 32 | 4 | 196 | 2 | 108 | 3 | 3 | 0 | 307 | 5 |
| 11 | 38 | 2 | 160 | 25 | 80 | 7 | 1 | 0 | 241 | 32 |
| 12 | 38 | 4 | 221 | 8 | 73 | 13 | 11 | 1 | 305 | 22 |
| Total | 474 | 50 | 2055 | 114 | 862 | 83 | 100 | 8 | 3017 | 205 |
These data further suggest that caregivers manage patient care across differences in knowledge, experience, time and space. To overcome such differences clinical pathways are being promoted as a means to limit clinical complexity (Hindle & Yazbeck 2005), although their use is not without problems. Little research has been done into the links between pathways, patient outcomes and resource use (Dy et al 2006); they are often perceived as limiting or prejudicing medical autonomy (Hindle & Yazbeck 2005) and often regarded by clinicians as little more than a management efficiency tool (Sorensen et al 2003). Clearly, not all care can be systematised and standardised in pathways (Lillrank & Liukko 2004). Some patients will need to be case managed, especially where extensive comorbidities exist and the services they require are complex and exceptional. Managing clinical processes therefore will mean identifying the conditions and procedures that lend themselves to systematisation and standardisation, and those that do not, and flexibly managing patient care needs.
Box 1.3
High-demand, high-risk, high-cost treatments should be planned, organised and evaluated around evidence of what works; diverse multidisciplinary geographically dispersed clinicians must collaborate to standardise routine treatment for patient populations and to tailor care for individual patients with complex needs. How can health services transform to manage these two modes of patient care in parallel?
The expectations of clinicians and managers must be reoriented to recognise and accept that clinical work is delivered and managed by teams of multidisciplinary clinicians who collaborate to co-produce healthcare. How might this reorientation occur in professions that seek to guard their autonomy?
Social and organisational skills are needed to deliver and manage routine and complex healthcare between multiple caregivers from diverse disciplines located in dispersed, independent services. What characterises the relationships between those who provide care and those who manage it, and the environments that support clinical process management?
The context of clinical process management
Health organisations are complex entities and the detail of how they work is not well understood. Management texts often conceptualise organisations as amalgams of generic elements and this tendency reinforces a view that studying the detail of work is not necessary to understanding organisational effectiveness. In this event, organisational change is hampered by a lack of knowledge about how work is done and who does it. Studies of work tend to be ignored or marginalised, even though work and organising
… are bound in dynamic tension because organizational structures are, by definition, descriptions of and templates for ongoing patterns of action.
(Barley & Kunda 2001:76)
Thus, top-down management strategies can have far-reaching and unintended effects, particularly if they remain uninformed about local practice. By imposing new organisational structures
… the patterns of work are invariably altered, and there is a risk that when the nature of work changes, for example because of technologies, the organizational structures either adapt or become misaligned with the activities they organise.
(Barley & Kunda 2001:76)
Pause for reflection
Uninformed organisational restructures can fail to produce expected efficiency gains and can add to the stress and chaos of clinical work. How can this be overcome?
However, resources are finite, patient safety is a concern, and healthcare services must respond to these realities to remain efficient and effective. Improving the way care is managed in large organisations can be overwhelming for both clinicians and managers. Thus, understanding the context in which clinical practice improvement takes place will aid the process, specifically understanding the real and complex world of clinical decision making and the difficult and uncertain conditions within which many clinical decisions are made. Yet, in the case of healthcare, clinical practice improvement must also take into account the limited amount of care that is evidence based. For instance,
(a)ccepting that the ‘dominant medical paradigm of scientific truth and certainty’ is to a large extent a fiction, or at best an exaggeration, has profound implications for the way in which we think about the management of scarce resources.
(Klein et al 1996:93)
Hence, understanding the limits of existing approaches to researching and improving care and focusing our attention on the details of the clinical work to see what solutions can be derived ground-up will help shift healthcare from being constituted by cultures of top-down management and measurement, to cultures of participation and self-directed learning. Incompetence and unsafe practices cannot be condoned, and the capacity of individual clinicians to do their job will always be paramount in service effectiveness. However, the ability of health services as a system to provide a safe environment is also at issue. Inadequate systems of care exist within units, between units, within healthcare teams and between clinical and management domains. Within units, medical clinicians can be faced with daunting decisions often taken within a context of uncertainty and experimentation (Harvey 1996); between units, the lack of routine structured processes to coordinate patient planning, transfer and treatment is an impediment to effectiveness (McQuillan et al 1998). However, the strategies that clinicians devise and promote (Wachter 1999) to cut through the conflict, complexity and inadequacy of modern modes of acute healthcare delivery may be limited, specifically if they miss the very deep-seated structural, personal, professional and cultural problems that exist.
Pause for reflection
Quick-fix solutions, devised and promoted by consultant gurus, central managers or clinicians will fail if they do not address and actively manage the very deep-seated structural, personal, professional and cultural problems that exist in public healthcare. How might these problems be otherwise overcome?
The environment in which healthcare is delivered is changing rapidly. Environmental factors affect not only the context in which clinicians and managers work, but also the way they work, and the way they work together. Changes in social and demographic trends, a rise in chronic diseases and increasing consumer expectations are leading to a demand for evidence-based and patient-focussed healthcare in both hospitals and the community. The skills and responsibilities of caregiving groups is changing accordingly, and the traditional map of the healthcare professions may not align with a reorganising workforce (Barley & Kunda 2001). Hence, the pressures to reconfigure clinical care will intensify as each occupational group tries to justify its place in the healthcare team and in the healthcare environment. These workforce pressures will further intensify with the shift in employment patterns from ‘tight’ to ‘loose’ coupling, increasing contract employment and outsourcing, the rapidly changing technological environment that includes computerisation, expectations of service transparency and accountability, the shift of clinical work organisation from individual clinicians to multidisciplinary teams and the recognition that healthcare is a collective and social process. Hence, organisational change necessitates not just good clinical skills, but also good social skills, a high level of awareness of oneself and of others, and a knowledge of how healthcare organisations actually work.
Traditional skills will not be sufficient in this new system. Boundary crossing, teamwork, knowledge management and collaboration will be de rigueur. New competencies will initiate changes in recruitment, skill mix and gender divisions; resource allocation will acknowledge the changing patterns of disease and illness from acute to long-term chronic conditions and from cure to prevention; and advanced health technologies will alter the way work is conceived of and executed. Within this new system different mindsets will be needed to reorient a managerial emphasis from a preoccupation with resources and costs, to health outcomes and patient satisfaction. New processes are needed through which the expertise and values of clinicians can be heard, acknowledged and incorporated with those of managers, policymakers and consumers. The language of healthcare must likewise evolve to describe, negotiate and organise the complex and rapidly changing environment of this new system. In this way new approaches are emerging to reshape the way work is organised and managed and the words used to describe it.
How might studies of work be used to reorient and redesign systems to align with the changing objectives and expectations of healthcare? Who should undertake these studies? Who should initiate and participate in systems redesign?
What are the characteristics of environments that will be receptive to and supportive of the shift from cultures of blame to cultures of learning in which both active and latent errors can be admitted, explored and rectified?
What types of new processes will ensure that people with appropriate skills are available and employed to meet changing needs and what competencies will enable them to cross boundaries, work in teams and collaborate in a transformed health system?
Conclusion
The emphasis of health service management on the clinical care of individual patients and on meeting corporate performance targets is not sufficient to manage modern expensive, complex, dispersed and diverse healthcare. Between these two ends, healthcare occurs as a complex collection of services delivered by myriad caregivers, many of whom practice individually and autonomously. Understanding what healthcare entails and how to manage it is an emerging field of study and practice, demanding a new set of knowledge, attitudes, practices and values. This book is pitched at developing this understanding, so that clinicians, managers and policymakers can engage with the technical, social and organisational implications of producing cost effective healthcare. This will mean learning to simultaneously manage the increasing demand for health services, containing their costs, managing their risks and improving their quality.
The pressures on the health system and on health services to improve health outcomes are likely to increase and responding to them meaningfully is essential to ensure that health services are sustainable and the wellbeing of those who work in them is maintained. New skills and new roles are needed to reorient priorities and to redesign systems to connect the quality of individual patient care with organisational effectiveness coherently, productively and practically. Equally, new ways of researching health services are needed to illuminate the specifics of clinical work, and to use that knowledge for the redesign of services (Iedema & Jorm forthcoming). Developing such new knowledge, skills and motivation to design and manage clinical processes in the health services is central to this endeavour.
References
Abel-Smith, B.; Mossialos, E., Cost containment and health reform: a study of the European Union, Health Policy 28 (1994) 89–132.
Andrews, L.B.; Stocking, C.; Krizek, T., An alternative strategy for studying adverse events in medical care, Lancet 349 (9048) (1997) 309–313.
Baker, G.; Norton, P.G.; Flintoft, V.; et al., The Canadian Adverse Events Study: The incidence of adverse events among hospital patients in Canada, CMAJ 170 (11) (2004) 1678–1686.
Barley, S.R.; Kunda, G., Bringing Work Back In, Organization Science 12 (2001) 76–95.
Bramley, D.; Hebert, P.; Jackson, R.; et al., Indigenous disparities in disease-specific mortality, a cross-country comparison: New Zealand, Australia, Canada, and the United States, The New Zealand Medical Journal 117 (2004) 1215–1231.
Brennan, T.A.; Leape, L.L.; Laird, N., Incidence of adverse events and negligence in hospitalised patients: Results of the Harvard Medical Practice study, New England Journal of Medicine 324 (1991) 377–384.
Bryan-Brown, C.W.; Dracup, K., Keeping the turf (wars) trimmed, American Journal of Critical Care 11 (2002) 408–410.
Busse, R.; Wismar, M., Health target programmes and healthcare services – any link? A conceptual and comparative study (Part 1), Health Policy 59 (2002) 209–221.
Byrne, J.M.; Rathwell, R., Medical savings accounts and the Canada health act: complimentary or contradictory, Health Policy 72 (2005) 367–379.
Carter, N.; Klein, R.; Day, P., How organisations measure success. (1995) Routledge, London.
Chassin, M.R., The urgent need to improve quality, JAMA 280 (1998) 1000–1005.
Cullen, D.J.; Sweitzer, B.J.; Bates, D.W.; et al., Preventable adverse drug events in hospitalized patients: A comparative study of intensive care and general care units, Critical Care Medicine 25 (1997) 1289–1297.
Davis, P.; Lay-Yee, R.; Briant, R.; et al., Adverse events in New Zealand public hospitals: Principal findings from a national survey. (2001) NZ Ministry of Health, Wellington.
Dickey, B., Assessing cost and utilization in managed mental healthcare in the United States, Health Policy 41 (1997) S163–S174.
Dy, S.; Garg, P.; Nyberg, D.; et al., Critical pathway effectiveness: Assessing the impact of patient, hospital care and pathway characteristics using qualitative comparative analysis, Health Services Research 40 (2006) 499–507.
Ferlie, E.; Shortell, S., Improving the Quality of Healthcare in the United Kingdom and the United States: A Framework for Change, Milbank Quarterly 79 (2001) 281–315.
Finlayson, B.; Dixon, J.; Meadows, S.; et al., Mind the gap: the extent of the NHS nursing shortage, British Medical Journal 325 (2002) 538–541.
Freemantle, J.; Officer, K.; McCullay, D.; et al., Australian Indigenous Health – Within an International Context. (2007) Cooperative Research Centre for Aboriginal Health, Darwin, NT.
Fujii, M.; Reich, M., Rising medical costs and the reform of Japan’s health insurance system, Health Policy 9 (1988) 9–24.
Gibler, W.; Cannon, C.; Blomkalns, A.; et al., Practical Implementation of the Guidelines for Unstable Angina/Non-ST–Segment Elevation Myocardial Infarction in the Emergency Department, Circulation 111 (2005) 2699–2710.
Grol, R., Successes and Failures in the Implementation of Evidence-Based Guidelines for Clinical Practice, Medical Care 39 (2001) S46–S54.
Hadorn, D.; Holmes, A., The New Zealand priority criteria project, Part 1: Overview, British Medical Journal 314 (1997) 131–134.
Ham, C., From targets to standards: but not just yet, British Medical Journal 330 (2005) 106–107.
Hammer, M.; Champy, J., Reengineering the Corporation. (1993) Harper Business, New York.
Harteloh, P., Quality systems in healthcare: a sociotechnical approach, Health Policy 64 (2003) 391–398.
Harvey, J., Achieving the indeterminate: accomplishing degrees of certainty in life and death situations, The Sociological Review 44 (1996) 78–98.
Hindle, D.; Braithwaite, J.; Travaglia, J.; et al., Patient Safety: a comparative of eight inquiries in six countries. (2006) Centre for Clinical Governance Research in Health, Sydney.
Hindle, D.; Yazbeck, A.-M., Clinical pathways in 17 European Union countries: a purposive survey, Australian Health Review 29 (2005) 94–104.
Hornick, P.; Hornick, C.; Taylor, K.; et al., Should business management training be part of medical education?Annals of Royal College of Surgical Eng (supp) 79 (1997) 200–201.
Hunter, D.J., The changing roles of healthcare personnel in health and healthcare management, Social Science & Medicine 43 (1996) 799–808.
Iedema, R.; Degeling, P.; Braithwaite, J.; et al., It’s an Interesting Conversation I’m Hearing: The Doctor as Manager, Organization Studies 25 (2004) 15–34.
Klein, R.; Day, P.; Redmayne, S., Managing scarcity: priority setting and rationing in the National Health Service, In: (Editor: Ham, C.) State of Health Series (1996) Open University Press, Buckingham, UK.
Lillrank, P.; Liukko, M., Standard, routine and non-routine processes in health care, International Journal of Health Care Quality Assurance 17 (2004) 39–46.
Malcolm, L., Service management: New Zealand’s model of resource management, Health Policy 16 (1990) 255–263.
McQuillan, P.; Pilkinton, S.; Allan, A.; Taylor, B.; Short, A.; Mortan, G.; Nielsen, M.; Barrett, D.; Smith, G., Confidential inquiry into quality of care before admission to intensive care, British Medical Journal 316 (1998) 1853–1858.
Muir Gray, J.A., Evidence-Based Healthcare. (1997) Churchill Livingstone, Edinburgh.
Schioler, T.; Lipczah, J.H.; Pedersen, B.L.; et al., Danish Adverse Event Study, Ugeskr Laeger 163 (39) (2001) 5370–5378.
Segal, L., The importance of patient empowerment in health systems reform, Health Policy 44 (1998) 31–44.
Sorensen, R.; Maxwell, S.; Coyle, B.; et al., Systematising care in Elective Caesarian section – controlling costs or quality?. (2003) Centre for Clinical Governance Research: The University of New South Wales, Sydney.
Suhrcke, M.; McKee, M.; Stuckler, D.; et al., The contribution of health to the economy in the European Union, Public Health 120 (2006) 994–1001.
Surgenor, S.D.; Bilike, G.T.; Corwin, H.W., Teamwork and collaboration in critical care; Lessons from the cockpit, Critical Care Medicine 31 (2003) 992–993.
Vakola, M., Exploring the relationship between the use of evaluation in business process re-engineering and organisational learning and innovation, Journal of Management Development 19 (2000) 812–835.
Vincent, C.; Neale, G.; Woloshynowych, M., Adverse events in British hospitals: preliminary retrospective record review, British Medical Journal 322 (2001) 517–519.
Wachter, R.M., An introduction to the hospitalist model, Annals of Internal Medicine 130 (1999) 338–342.
Wilson, R.; Runciman, W.; Gibberd, R.; et al., The Quality in Australian Healthcare Study, The Medical Journal of Australia 163 (1995) 458–471.
Wiseman, V.; Mooney, G.; Berry, G.; et al., Involving the general public in priority setting: experiences from Australia, Social Science & Medicine 56 (2003) 1001–1012.
[/level-membership-for-internal-medicine-category][not-level-membership-for-internal-medicine-category]
Chapter 1. Managing clinical processes: objectives, evidence and context
Roslyn Sorensen and Rick Iedema
Introduction
Good health is important to individuals and to national economies (Suhrcke et al 2006). Without good health, economic prosperity and the wellbeing of individuals suffer. Consequently, health is an important responsibility for governments, and is often the biggest and most politically sensitive of portfolios, especially in countries where healthcare is predominantly publicly funded. Governments actively manage the main indicator of a population’s health, health status, and their success in doing so is evident in their ranking on health outcome measures relative to their peers. To maintain their performance standing, governments must manage pressure on resources to balance the demands for healthcare with those of other portfolios, such as defence, education, and law and order. Making the best use of resources is therefore an important objective for all health systems.
The use of resources can be maximised by optimising the quality of care. Care provided in the right way the first time that produces expected outcomes will be less expensive than poor-quality care that has to be repeated. While the quality of care in most developed countries is good, it is not as good as it could be. Quality is being scrutinised and judged as deficient, based on findings that the level of adverse events in the health services of many developed countries is high. This is despite generally good health outcomes overall and patient satisfaction with the system. But optimising the quality of healthcare and maximising resource use, i.e. producing cost effective care, is difficult. Healthcare is complex: multiple caregivers from diverse backgrounds who are often geographically dispersed in independent services deliver a range of services that need to be coordinated. Healthcare is expensive: the rapidly advancing technologies of health are costly and the demand for them is potentially insatiable. Hence, cost effectiveness will depend on how well those who manage health services and those who deliver them agree on the goals of care, understand the methods for their achievement and cooperate to do so.
Healthcare goals are generally not well integrated at either the policy or service level. Emphasising any single goal to the exclusion of others can be detrimental to achieving comprehensive health service outcomes. Policymakers commonly use budgeting and service downsizing to contain the cost of care; clinicians commonly call for more funding as the answer to quality problems. But containing costs without attention to other equally important goals may have unintended effects on quality and safety, and increasing funding without reference to available resources or accounting for those consumed may jeopardise service sustainability. Hence, the overriding aim for all health systems should be to achieve good quality care without risk to patient safety while maximising resource use. Achieving this aim will mean simultaneously managing the three main elements of healthcare, namely quality, risk and resources, at the point at which care is produced, that is, in health services. Doing so will mean moving beyond just managing the clinical particularities of individual patients or the organisational abstractions of performance targets, to redesigning systems so as to link these two ends coherently, productively and practically. To discuss how this can be done, this introductory chapter:
▪ outlines the objectives of managing clinical processes in health services
▪ provides evidence for the importance of managing seemingly conflicting objectives simultaneously
▪ discusses the context within which clinical process management takes place.
The objectives of managing clinical processes
The relationship between health outcomes and health services
Health status is an indicator of the state of a nation’s health. Most OECD countries achieve similar levels of performance on key indicators of health status, particularly life expectancy (OECD 2005). Most countries seek to protect their ranking and actively manage this measure. However, while health status outcomes are impressive for non-Indigenous populations, those for Indigenous populations are often much lower (Bramley et al 2004) and the gap may be widening (Freemantle et al 2007). Table 1.1 below sets out selected indicators of performance on health status for selected peer countries. The data show overall performance and performance on specific life-expectancy measures for the four leading countries in 2004, compared with those of other selected OECD peers.
Health targets, such as health status measures, are important because, theoretically, they focus the system on the effectiveness as well as the efficiency of care. However, the extent to which health status outcomes are linked to health service effectiveness and efficiency is not clear. For instance, the proportion of funds spent on health is not necessarily an indicator of performance on health status outcomes. As an example, Japan has one of the lowest proportions of GDP spent on health (8% in 2003) but a high overall life expectancy (81.8 years), while the US spends a relatively high proportion of its GDP on health (15.2% in 2003) but has a lower overall life expectancy (77.5 years) (OECD 2006b). If health status outcomes are not necessarily linked to the size of health budgets, other factors must explain the difference. Knowing what factors ‘produce’ health and understanding how budgets are spent is therefore important in understanding such differences. But health reform policy and programs aimed at improving health service performance appear to be largely separated from the policies and programs that underpin health status outcomes. Busse & Wismar (2002) describe health targets as the ‘forgotten corner’, because of their separation from the main agenda of health services reform. A comparative study of national and regional health target programs among OECD peers, including the European Union, Australia, Canada, New Zealand and the US, showed that Australia alone linked health targets to health services performance (Busse & Wismar 2002).
Busse & Wismar offer a number of reasons for this separation. Firstly, the policies and programs that support health targets tend to be top-down and the involvement of the general public or their elected parliamentary officials is limited. This means that policy may not contain strategies to encourage grassroots alliances to mobilise health improvement activities in the community and in health services. Secondly, and consequently, there are few incentives for local and professional individuals and groups to be involved. This is important because getting the agreement and commitment of those who produce and co-produce health is a significant factor in improving health outcomes. Yet the evidence is clear that integrating community and professional groups in decisions that affect them is effective. Communities can make difficult decisions about prioritising health services in the face of scarce resources. This is evidenced by the Oregon experiment in the US that sought to involve communities in rationing decisions that took into account the health of vulnerable groups, and the New Zealand experience where professional groups assisted government to develop rationing criteria for elective surgery (Hadorn & Holmes 1997, Klein et al 1996). Importantly, Wiseman et al’s Australian study found that the public overwhelmingly want their preferences to inform decisions about priority-setting and funding allocation (Wiseman et al 2003) (see Mooney, Chapter 13).
Pause for reflection
Communities can participate meaningfully in decisions about setting priorities and allocating resources in health, and community values can become a criterion for decision making. How might governments take community capacity and values into account?
For governments, a constant priority is managing the gap between the supply of health services and the demand for them. Governments tend to use the blunt levers of economic policy to contain costs to manage the gap, in preference to more organic processes that involve communities in such decisions. The European Union, Australia, New Zealand and Canada all use economic policy in this way, as do the US and Japan (Abel-Smith & Mossialos 1994, Fujii & Reich 1988, Malcolm 1990, Segal 1998, Dickey 1997, Byrne & Rathwell 2005). Economic policy is a useful lever for governments to manage health services, because it allows control over resource allocation at the macro level at which government decision makers operate. Moreover, the pressures on the health system are likely to continue, hence the pressures on governments to manage the gap between service supply and demand will also continue. Managing the resource consumption of health services will remain an important strategy to contain public spending on health to within manageable levels as populations in developed countries age, the demand for expensive advanced medical technology rises and consumer expectations about choice, access, quality and accountability increase.
Pressures on the health system
These pressures on the health system need to be taken into account when assessing how well they perform. Health service performance is affected by the rising cost of care, the increasing demand for services, the levels of risk to patient safety and the overall quality of care. Each of these pressures is discussed briefly in turn.
First, in terms of the rising cost of care, health services consume a sizable portion of a nation’s resources. Table 1.2 below compares the total expenditure on health as a percentage of GDP (gross domestic product) for selected OECD peers from 1960 to 2004. The expenditure of these countries (Australia, Canada, New Zealand and the UK) is compared with that of countries with relatively low and high expenditure (Japan and the US respectively). The data show that for the six countries selected, all experienced substantial rises in the percentage of GDP spent on health over the 44-year period. National budgets are finite, and as health spending rises, the proportion of GDP spent in other areas of need reduces. Consequently, most governments actively manage their expenditure on health. The high level of public funding facilitates such management, although countries such as the US experience more difficulty, presumably because of a dominant private sector (OECD 2006a) less amenable to centralised cost containment objectives.
| 3OECD data for New Zealand GDP spent on health began in 1970. |
||||||
| Source: OECD 2006 | ||||||
| Country | Australia | Canada | NZ | UK | Japan | US |
|---|---|---|---|---|---|---|
| Year | ||||||
| 1960 | 4.0 | 5.4 | 5.1 (1970) 3 | 3.9 | 3.0 | 5.1 |
| 2004 | 9.6 | 9.9 | 8.4 | 8.3 | 8.0 | 15.3 |
Second, the demand for health services is rising, and is likely to continue to rise in line with the ageing of the population in developed countries. As an example, Figure 1.1 below shows the increase in admitted patients in Australian hospitals from 1998–99 to 2004–05.
|
|
| Figure 1.1 |
Governments and health services must manage this increasing demand, and health resources must be rationed to manage it within allocated budgets. Reducing bed numbers and patients’ lengths of stay are common strategies to contain costs within budget limits while maintaining patient throughput. Table 1.3 below shows data for seven selected countries, as in Table 1.1, for 2004 on three key indicators of efficiency, namely waiting times for health services, average lengths of stay and proportion of hospital beds per 1000 population. The data vary widely. Of the two countries with lower lengths of stay (Sweden and New Zealand) and bed ratios (Sweden), each experiences waiting times for rationed hospital services to contain the proportion of GDP spent on health: for Sweden to 9.1%; for New Zealand to 8.4% (OECD 2006b). The two countries that report no waiting times for hospital services (Switzerland and France) also have the highest proportion of beds, and in the case of Switzerland, the highest average length of stay. Thus, the trade-off for maintaining access to health services with no waiting times appears to be a higher proportion of GDP spent: for Switzerland 11.6% in 2004; for France 10.5% (OECD 2006b).
| Performance statistics | Switzerland | Sweden | Spain | France | Australia | Canada | New Zealand |
|---|---|---|---|---|---|---|---|
| Are there waiting times at hospitals for health services? | No | Yes | Yes | No | Yes | Yes | Yes |
| Average length of stay in hospital – days | 9.2 | 5.0 | 7.5 | 5.5 | 6.2 | 7.2 | 3.3 |
| Hospital beds/1000 | 3.9 | 2.4 | 3.2 | 8.4 | 3.8 | 3.2 | 6 |
The extent to which reducing bed numbers is a sustainable strategy to manage throughput and cost emerges in Figure 1.2 overleaf. The data show that as an example the consistent reduction in bed numbers in Australia from 1998–99 to 2002–03 was not sustainable, with bed numbers rising again from 2003–04.
|
|
| Figure 1.2
Source: Australian Institute of Health and Welfare (AIHW) 2004, Australian Hospital Statistics 2002–03; Australian Government Department of Health and Ageing, Australian Health Care Agreement data reported by the states and territories (2003–04, 2004–05)
|
Third, risks to patient safety have become a priority for many health services in developed countries (see Warburton, Chapter 9 and Merry, Chapter 11). The methodology to quantify adverse events developed in the 1990s has revealed a pattern of patient risk associated with acute inpatient admissions within a relatively consistent range across selected countries for which data are available, from 7.5% in Canada to 17.7% in the US, as Table 1.4 shows.
| 4Similar protocols were used so that comparisons can be made across studies (Baker et al 2004). | ||
| Sources: Baker et al 2004, Andrews et al 1997, Davis et al 2001, Vincent et al 2001, Wilson et al 1995, Schioler et al 2001 | ||
| Country | Percentage of admissions associated with an adverse event | Focus of study |
|---|---|---|
| Australia | 16.6 | Acute hospital admissions |
| United States | 17.7 | Acute hospital admissions |
| United Kingdom | 10.0 | Emergency department |
| Canada | 7.5 | Acute hospital admissions |
| New Zealand | 12.9 | Acute hospital admissions |
| Denmark | 9.0 | Acute hospital admissions |
Three issues arise from these data. First, a large majority of the adverse events reported caused significant disability or death and were considered highly preventable: 57% in the Australian study (Wilson et al 1995). Second, the cost of adverse events was high, estimated to be in excess of $800 million per annum, again in the Australian case. This represents a significant proportion of the health budget that potentially could be directed to meeting the supply–demand gap. Third, these figures raise questions about their cause, whether individual clinicians are at fault, or inadequate systems. This issue is important when decisions about health service priorities and funding for improvements are being considered.
Errors occur in all health and hospital services and must be managed as routine. For instance, Cullen compared adverse drug events in ICUs with events in non-ICUs (Cullen et al 1997) and when adjusted for volume, the rates were found to be comparable. This study is significant, because it revealed that preventable and potential adverse drug events occurred in units that functioned normally, involving caregivers working under reasonably normal circumstances and not necessarily or not only in units at the extremes of workload and stress, such as ICUs. Cullen’s estimate of cost of between $5.6 and $2.8 million in a 700-bed teaching hospital suggests that eliminating error is not only good for patients, it is also good for budgets.
In addressing the issue of cause, Baker et al believes that poorly designed systems are at fault. This view notwithstanding
[H]ealth care organisations have historically focused on identifying and disciplining clinicians who were closest to incidents. However, experts suggest that the greatest gains in improving patient safety will come from modifying the work environment of healthcare professionals, creating better defences for averting adverse events and mitigating their effects.
(Baker et al 2004:1678)
The implications of this for managing clinical processes arise in terms of the types of solutions devised to address adverse events, and whether they should focus on improving the skills and competencies of individual clinicians, or rectifying underlying systems problems.
Fourth, the overall quality of health services has concerned policymakers, health service managers, clinicians and patients, and it had done so well before the high levels of adverse events came to light. The problems with quality are serious and extensive. Chassin (1998) maintains that they arise from treatment underuse (failure to provide a treatment when needed), overuse (when harm exceeds the benefit of a treatment) and misuse (when complications occur from the treatment). He maintains that the need for rapid change in health services is urgent because
[O]ur present efforts resemble a team of engineers trying to break the sound barrier by tinkering with a Model T Ford. We need a new vehicle or, perhaps, many new vehicles.
(Chassin 1998:1005)
Pause for reflection
New vehicles are required to manage the increasing demand for health services and the rising cost of care while minimising the risks to patient safety and improving the overall quality of health services. What might these new vehicles look like?
Strategies to improve performance
Policymakers and health service managers have generally responded to the problems in overall quality with broad quality improvement programs such as continuous quality improvement (CQI). Just how effective such programs are is uncertain, because of a paucity of evaluation. Some clinicians believe that the quality of care has actually deteriorated in the countries where they have been implemented (Ferlie & Shortell 2001). A possible reason for this is that the broad scope of programs is too ambitious as they attempt to cover the myriad systems that appear to impact on quality. Thus, the links between cause and effect have been difficult to establish. What these programs do reveal is further evidence of wide variations in the processes and outcomes of care in technologically advanced systems.
Ferlie & Shortell (2001)
Buy Membership for Internal Medicine Category to continue reading. Learn more here
[/not-level-membership-for-internal-medicine-category]
