Management of the High-Risk Surgical Patient
Cardiothoracic anaesthesia and emergency anaesthesia are considered elsewhere (Chs 33, 34 and 37), and this chapter will concentrate on the patient undergoing scheduled major non-cardiac surgery. However, the principles of treatment, particularly fluid management, generally apply also to the patient undergoing an emergency procedure.


RISK PREDICTION SCORING SYSTEMS
Shoemaker’s Criteria
 Previous severe cardiorespiratory illness (acute MI, COPD, stroke)
 Extensive ablative surgery planned for carcinoma
 Severe multiple trauma (more than three organs or two body cavities involved)
 Massive acute blood loss (more than 8 units)
 Age over 70 years with limited physiological reserve


Revised Cardiac Risk Index


POSTOPERATIVE PULMONARY COMPLICATION RISK PREDICTORS


LABORATORY INVESTIGATIONS FOR RISK ASSESSMENT
Cardiopulmonary Exercise Testing (CPET)
Anaerobic Threshold
AT is identified as the point at which there is onset of lactate production through the activation of anaerobic pathways. The lactate produced is buffered by bicarbonate to produce water and carbon dioxide. The net effect is an increase in the slope of the graph of carbon dioxide production relative to oxygen uptake (Fig. 23.1)
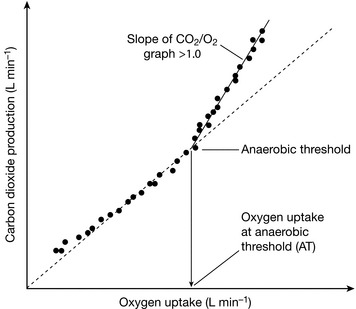
FIGURE 23.1 V-slope method for estimating Anaerobic Threshold. Oxygen uptake increases as exercise intensity increases. During the initial aerobic phase the slope of the graph of CO2 production vs. O2 uptake is less than 1. After the onset of lactate production from anaerobic pathways (the Anaerobic Threshold), extra CO2 is generated by the buffering of lactate with bicarbonate, and the slope of the CO2/O2 graph is greater than 1.
Identification of Myocardial Dysfunction
 Oxygen uptake per heart beat (VO2/HR, also known as the ‘oxygen pulse’). This should increase steadily during exercise as a reflection of increases in underlying stroke volume initially, followed by increases in oxygen extraction. Flattening of the slope of the graph during exercise may reflect underlying myocardial wall motion abnormalities.
 Oxygen uptake to work rate relationship (VO2/WR) (Fig. 23.2). For each 1 W increase in work rate, oxygen uptake should increase by 10 mL min− 1.
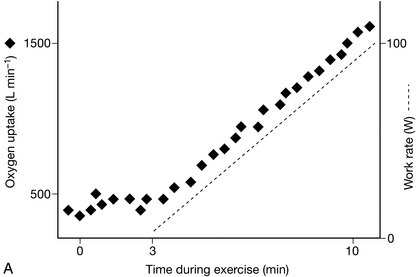
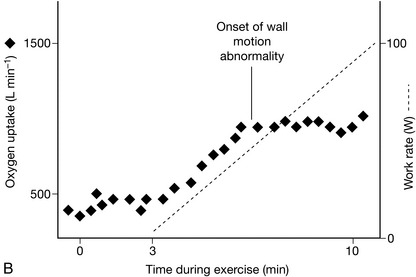
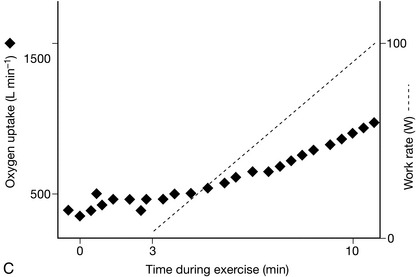
FIGURE 23.2 Relationship between oxygen uptake and work rate (VO2/WR). (A) Normal: for each 1 W increase in work rate intensity, oxygen uptake increases by 10 mL min− 1. In this example, O2 uptake is 500 mL min− 1 at the onset of loaded cycling, and 1500 mL min− 1 after 100 W, an increase of 10 mL min− 1 W− 1. (B) Ischaemic heart disease: The VO2/WR relationship starts normally, but O2 uptake abruptly stops increasing at the critical ischaemic point as wall motion abnormalities develop. (C) Chronic heart failure: VO2/WR is significantly decreased, as the myocardial pump does not respond normally to increasing exercise intensity.
REDUCING RISK BEFORE SURGERY


PREOPERATIVE INTERVENTIONS TO REDUCE RISK
IDENTIFYING PATIENTS IN NEED OF POSTOPERATIVE CRITICAL CARE
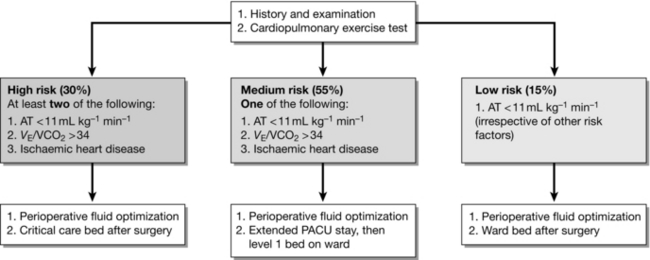
A reduced value of anaerobic threshold (AT), measured from cardiopulmonary exercise testing (CPET), has been used to define groups at higher risk of complications after surgery. A protocol for triage of patients to ICU, HDU or to ward care after surgery based on CPET results was described by Older in 1999. Mortality rates were very low among patients who were allocated to ward care on the basis of good AT values, indicating that CPET was accurate in identifying patients who did not need HDU care, irrespective of clinical history or age. This model of care is now becoming established in hospitals with access to preoperative CPET. A typical protocol is shown in Figure 23.3.
PERIOPERATIVE MANAGEMENT OF THE HIGH-RISK PATIENT
Haemodynamic Monitoring, Fluid Therapy, and Optimization of Oxygen Delivery
Oxygen delivery (DO2) is dependent upon cardiac output and the oxygen content of arterial blood.

Additionally, there is a small but clinically insignificant amount of dissolved oxygen.


Stroke Volume
 Preload decreases if the patient becomes hypovolaemic, either through blood loss, insensible losses or relative hypovolaemia through excessive vasodilatation and capacitance increase of the circulation.


Figure 23.4 shows the effect of boluses of fluid on stroke volume at different points on the Frank–Starling curve. On the lower portion of the curve, when preload is low, a fluid bolus is likely to produce an increase in stroke volume of greater than 10%. As preload increases, the increases in stroke volume reduce, until a rise of less than 10% is obtained, indicating that the plateau of the Frank–Starling curve has been reached, and that further fluid boluses are not required.
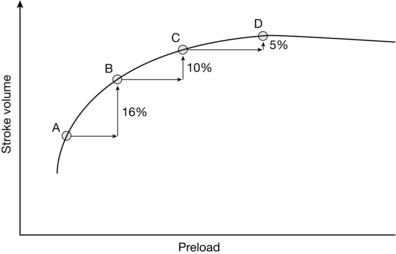
FIGURE 23.4 Optimizing stroke volume with fluid: the Frank–Starling curve. At point A on the curve, the patient is significantly hypovolaemic and responds to a fluid bolus with a 16% increase in stroke volume at point B. The second bolus (B to C) produces a smaller but still significant increase, but the third bolus (C to D) produces only a small (< 10%) increase in SV, signifying that the plateau portion of the Frank–Starling curve has been reached and that further fluid boluses will not lead to an increase in stroke volume.


Intraoperative Stroke Volume Optimization
The measured parameters of the Doppler waveform (Fig. 23.5) include:
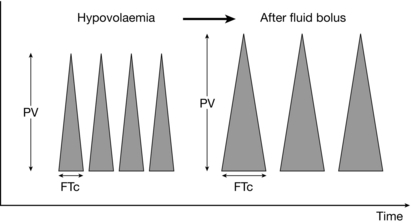
FIGURE 23.5 Oesophageal Doppler trace with response to fluid. The height of the trace represents the peak velocity (PV), a marker of contractility. The corrected Flow Time (FTc) is the systolic ejection time in milliseconds; a value less than 330 ms indicates hypovolaemia. The hypovolaemic patient responds to a fluid bolus by increasing both flow time and peak velocity.


Figure 23.6 shows a typical protocol for Doppler-guided fluid administration in which boluses of fluid are given until no further increases in stroke volume occur.
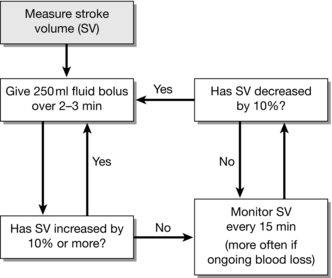
FIGURE 23.6 Protocol for administering fluid guided by oesophageal Doppler. In the anaesthetized patient, stroke volume is the optimal parameter to guide fluid therapy when using the oesophageal Doppler. The approach followed in this example aims to optimize the patient’s Frank–Starling curve (see Fig. 23.4) by sequential boluses of fluid until no further increases in stroke volume are observed.
Preload Responsiveness to Guide Fluid Therapy


The ability of these variables to determine preload responsiveness is based on observation of the cyclical changes which occur in stroke volume in response to mechanical ventilation (Fig. 23.7).
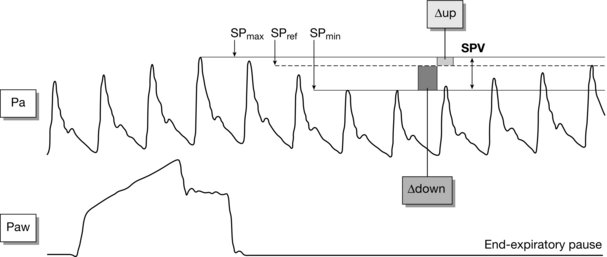
FIGURE 23.7 Variation in arterial pulse with ventilation. In the mechanically ventilated patient, the amplitude of the arterial pulse varies during the ventilatory cycle. Variations in the systolic pulse (SPV) greater than 12–14% indicate that a patient is hypovolaemic and likely to respond to fluid by increasing stroke volume. (Adapted from: Michard F. Changes in arterial pressure during mechanical ventilation. Anesthesiology 2005; 103:419–428.)


POSTOPERATIVE MANAGEMENT
Monitoring on the General Ward
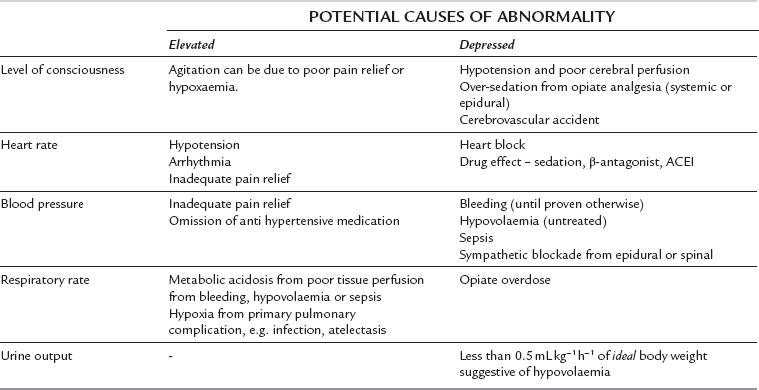
General ward monitoring is normally restricted to standard clinical observations, although some wards may be able to monitor central venous pressure (CVP) as well. The same principles of monitoring apply to both general ward patients and critical care patients in that the clinician is using the monitoring to detect organ dysfunction and decreased tissue perfusion at the earliest possible stage. The variables shown in Table 23.1 should be monitored routinely. These variables are usually combined into a scoring system known as a ‘patient at risk’ (PAR) score, or ‘early warning system’ (EWS) score. A particular PAR or EWS score value, or change in value, is pre-defined as a trigger point for nursing staff to summon medical assistance so that a potentially deteriorating patient can be identified early and appropriate treatment can be given, including transfer to critical care if indicated.
Monitoring in the Critical Care Unit
Central Venous Catheter


Canet, J., Galart, L., Gomar, C., et al. Prediction of postoperative pulmonary complications in a population-based surgical cohort. Anesthesiology. 2010;113:1338–1350.
Copeland, G.P., Jones, M.W. POSSUM: a scoring system for surgical audit. Br. J. Surg. 1991;78:355–360.
Davies, S.J., Wilson, R.J.T. Preoperative optimisation of the high-risk surgical patient. Br. J. Anaesth. 2004;93:121–128.
Davies, S.J., Wilson, R.J.T. Rationalising the use of surgical critical care: the role of cardiopulmonary exercise testing. In: Vincent J.L., ed. Yearbook of Intensive Care and Emergency Medicine. Berlin: Springer-Verlag, 2009.
Grocott, M.P.W., Mythen, M.G., Gan, T.J. Perioperative fluid management and clinical outcomes in adults. Anesth. Analg. 2005;100:1093–1106.
Lee, T.H., Marcantonio, E.R., Mangione, C.M., et al. Derivation and validation of a simple index for prediction of cardiac risk of major noncardiac surgery. Circulation. 1999;100:1043–1049.
Loftus I., ed. Care of the critically ill surgical patient, third ed., London: Hodder Arnold, 2010.
McConachie I., ed. Anaesthesia for the high-risk patient, second ed., Cambridge: Cambridge University Press, 2009.