Chapter 1 Mammography Acquisition
Screen-Film and Digital Mammography, the Mammography Quality Standards Act, and Computer-Aided Detection
Randomized, controlled trials (RCTs) of women invited to mammography screening conducted between 1963 and 1990 showed that early detection and treatment of breast cancer led to a 25% to 30% decrease in breast cancer mortality. More recent studies of service screening in Sweden and Canada have shown that screening mammography can reduce breast cancer mortality by 40% to 50% compared to unscreened women (Tabar et al., Duffy et al., Coleman et al.). As a result, the American Cancer Society recommends that asymptomatic women age 40 years and older have an annual mammogram and receive a clinical breast examination as part of a periodic health examination, preferably annually (Saslow et al.) (Box 1-1).
In all of these studies, image quality was demonstrated to be a critical component of early detection of breast cancer. To standardize and improve the quality of mammography, in 1987 the American College of Radiology (ACR) started a voluntary ACR Mammography Accreditation Program (MAP). In 1992, the U.S. Congress passed the Mammography Quality Standards Act (MQSA; P.L. 102-539), which went into effect in 1994 and remains in effect today through reauthorizations in 1998, 2004, and 2007. MQSA mandates requirements for facilities performing mammography, including equipment and quality assurance requirements, as well as personnel qualifications for physicians, radiologic technologists, and medical physicists involved in the performance of mammography in the United States, whether screening or diagnostic, screen-film or digital (Box 1-2).
Box 1-2 Mammography Quality Standards Act of 1992
Congressional act to regulate mammography
Regulations enforced by the FDA require yearly inspections of all U.S. mammography facilities
All mammography centers must comply; noncompliance results in corrective action or closure
Falsifying information submitted to the FDA can result in fines and jail terms
Regulations regarding equipment, personnel credentialing and continuing education, quality control, quality assurance, and day-to-day operations
Technical Aspects of Mammography Image Acquisition
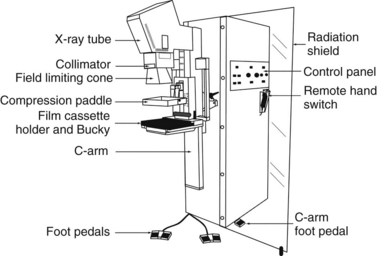
Mammograms are obtained on specially designed, dedicated x-ray machines using either x-ray film and paired fluorescent screens or digital detectors to capture the image. All mammography units are comprised of a rotating anode x-ray tube with matched filtration for soft-tissue imaging, a breast compression plate, a moving grid, an x-ray image receptor, and an automatic exposure control (AEC) device that can be placed under or detect the densest portion of the breast, all mounted on a rotating C-arm (Fig. 1-1). A technologist compresses the patient’s breast between the image receptor and compression plate for a few seconds during each exposure. Breast compression is important because it spreads normal fibroglandular tissues so that cancers, which have similar attenuation properties to fibroglandular tissues, can be better seen. Breast compression also decreases breast thickness, thereby decreasing exposure time, radiation dose to the breast, and the potential for image blurring as a result of patient motion and unsharpness.
The generator for a mammography system provides power to the x-ray tube. The peak kilovoltage (kVp) of mammography systems is lower than that of conventional x-ray systems, because it is desirable to use softer x-ray beams to increase both soft-tissue contrast and the absorption of x-rays in the cassette phosphor (absorption efficiency), especially for screen-film mammography (SFM). Typical kVp values for mammography are 24 to 32 kVp for molybdenum targets, 26 to 35 kVp for rhodium or tungsten targets. A key feature of mammography generators is the electron beam current (milliampere [mA]) rating of the system. The higher the mA rating, the shorter the exposure time for total tube output (milliampere second [mAs]). A compressed breast of average thickness (5 cm) requires about 150 mAs at 26 kVp to achieve proper film densities in SFM. If the tube rating is 100 mA (typical of the larger focal spots used for nonmagnification mammography), the exposure time would be 1.5 seconds. A higher-output system with 150-mA output would cut the exposure time to 1 second for the same compressed breast thickness and kVp setting. Because of the wide range of breast thicknesses, exposures require mAs values ranging from 10 to several hundred mAs. Specifications for generators are listed in Box 1-3.
Box 1-3 Mammography Generators
Half-value layer between kVp/100 + 0.03 and kVp/100 + 0.12 (in mm of aluminum) for Mo/Mo anode/filter material
Average breast exposure is 26–28 kVp (lower kVp for thinner or fattier breasts, higher kVp for thicker or denser breasts)
Screen-film systems deliver an average absorbed dose to the glandular tissue of the breast of 2 mGy (0.2 rad) per exposure
The most commonly used anode/filter combination is Mo/Mo: a molybdenum (Mo) anode (or target) and a Mo filter (25–30 microns thick), especially for thinner compressed breasts (<5 cm thick). Most current manufacturers also offer a rhodium (Rh) filter, to be used with the Mo target (Rh/Mo), to produce a slightly more penetrating (harder) x-ray beam for use with thicker breasts. Some manufacturers offer other target materials, such as Rh/Rh: a rhodium target paired with a rhodium filter, or tungsten (W), which is paired with a rhodium filter (W/Rh) or aluminum (Al) filter (W/Al). These anode/filter combinations are designed for thicker (>5 cm) and denser breasts. Typically, higher kVp settings are also used with these alternative target/filter combinations to result in a harder x-ray beam for thicker breasts, because fewer x-rays are attenuated with a harder x-ray beam (Box 1-4). One of the best parameters to measure the hardness or penetrating capability of an x-ray beam is the half-value layer (HVL), which represents the thickness of aluminum that reduces the exposure by one half. The harder the x-ray beam, the higher the HVL. The typical HVL for mammography is 0.3 to 0.5 mm of Al. The Food and Drug Administration (FDA) requires that the HVL for mammography cannot be less than kVp/100 ± 0.03 (in mm of Al), so that the x-ray beam is not too soft. For example, at 28 kVp, the HVL cannot be less than 0.31 mm of Al. There is also an upper limit on the half-value layer that depends on the target-filter combination. For the upper limit of Mo/Mo, the HVL must be less than kVp/100 + 0.12 (in mm of Al); so for 28 kVp, the HVL must be less than 0.4 mm of Al.
Box 1-4 Anode-Filter Combinations for Mammography
Ag, silver; Al, aluminum; Mo, molybdenum; Rh, rhodium; W, tungsten.
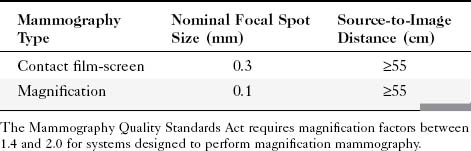
Geometric magnification is achieved by moving the breast farther from the image receptor (closer to the x-ray tube) and switching to a small focal spot (Fig. 1-2). Placing the breast halfway between the focal spot and the image receptor (as in Fig. 1-2B) would magnify the breast by a factor of 2.0 from its actual size to the image size because of the divergence of the x-ray beam. The MQSA requires that mammography units with magnification capabilities must provide at least one fixed magnification factor of between 1.4 and 2.0 (Table 1-1). Geometric magnification makes small, high-contrast structures such as microcalcifications more visible by making them larger relative to the noise pattern in the image (increasing their signal-to-noise ratio [SNR]). Optically or electronically magnifying a contact image, as would be done with a magnifier on SFM or using a zoom factor greater than 1 on a digital mammogram, does not increase the SNR of the object relative to the background, because both are increased in size equally. To avoid excess blurring of the image with geometric magnification, it is important to use a sufficiently small focal spot (usually 0.1 mm nominal size) and not too large a magnification factor (2.0 or less). When the small focal spot is selected for geometric magnification, the x-ray tube output is decreased by a factor of 3 to 4 (to 25–40 mA) compared to that from a large focal spot (80–150 mA). This can extend imaging times for magnification mammography, even though the grid is removed in magnification mammography. The air gap between the breast and image receptor provides adequate scatter rejection in magnification mammography without the use of an antiscatter grid.
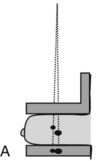
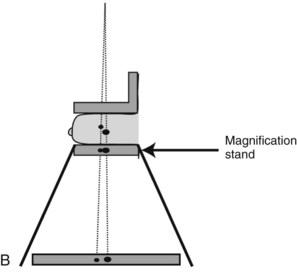
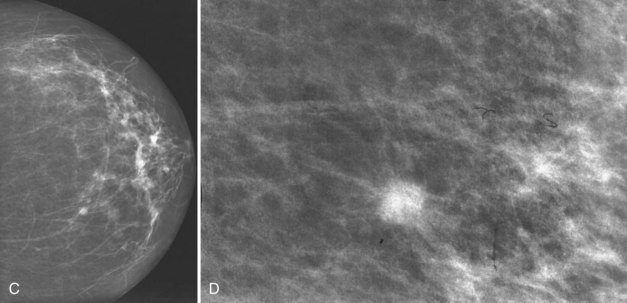
Table 1-1 Mammography Focal Spot Sizes and Source-to-Image Distances
| Mammography Type | Nominal Focal Spot Size (mm) | Source-to-Image Distance (cm) |
|---|---|---|
| Contact film-screen | 0.3 | ≥55 |
| Magnification | 0.1 | ≥55 |
The Mammography Quality Standards Act requires magnification factors between 1.4 and 2.0 for systems designed to perform magnification mammography.
The compression plate and image receptor assembly hold the breast motionless during the exposure, decreasing the breast thickness and providing tight compression, better separating fibroglandular elements in the breast (Fig. 1-3). The compression plate has a posterior lip that is more than 3 cm high and usually is oriented at 90 degrees to the plane of the compression plate at the chest wall. This lip keeps chest wall structures from superimposing and obscuring posterior breast tissue in the image. The compression plate must be able to compress the breast for up to 1 minute with a compression force of 25 to 45 pounds. The compression plate can be advanced by a foot-controlled motorized device and adjusted more finely with hand controls.
Screen-Film Mammography Image Acquisition
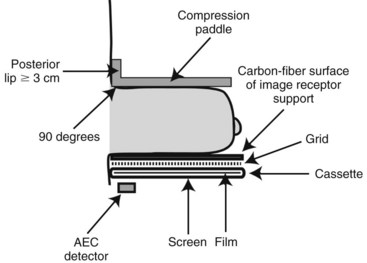
In SFM, the image receptor assembly holds a screen-film cassette in a carbon-fiber support with a moving antiscatter grid in front of the cassette and an AEC detector behind it. Screen-film image receptors are required to be 18 × 24 cm and 24 × 30 cm in size to accommodate various sized breasts (Box 1-5). Each size image receptor must have a moving antiscatter grid composed of lead strips with a grid ratio (defined as the ratio of the lead strip height to the distance between strips) between 3.5 : 1 and 5 : 1. The reciprocating grid moves back and forth in the direction perpendicular to the grid lines during the radiographic exposure to eliminate grid lines in the image by blurring them out. One manufacturer uses a hexagonal-shaped grid pattern to improve scatter rejection; this grid is also blurred by reciprocation during exposure. Use of a grid improves image contrast by decreasing the fraction of scattered radiation reaching the image receptor. Grids increase the required exposure to the breast by approximately a factor of 2 (the Bucky factor), due to attenuation of primary as well as scattered radiation. Grids are not used with magnification mammography. Instead, in magnification mammography, scatter is reduced by collimation and by rejection of scattered x-rays due to a significant air gap between the breast and the image receptor.
Box 1-5 Compression Plate and Imaging Receptor
Both 18 × 24-cm and 24 × 30-cm sizes are required
A moving grid is required for each image receptor size
The compression plate has a posterior lip >3 cm and is oriented 90 degrees to the plane of the plate
Compression force of 25–45 pounds
Paddle advanced by a foot motor with hand compression adjustments
Film processing is affected by many variables, the most important of which are developer chemistry (weak or oxidized chemistry makes films lighter and lower contrast), developer temperature (too hot may make films darker, too cool lighter), developer replenishment (too little results in lighter, lower-contrast films), inadequate agitation of developer, and uneven application of developer to films (causes mottling) (Table 1-2).
Table 1-2 Variables Affecting Image Quality of Screen-Film Mammograms
| Film too dark |
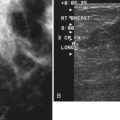
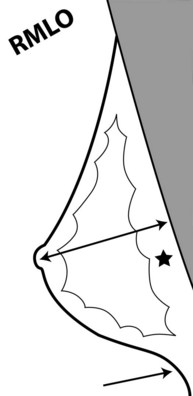
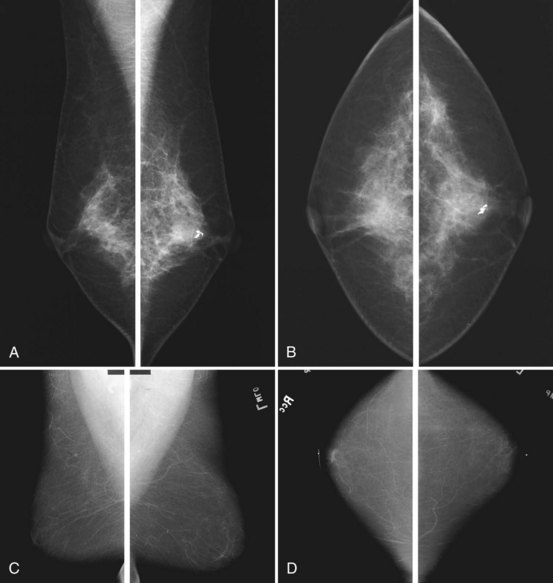
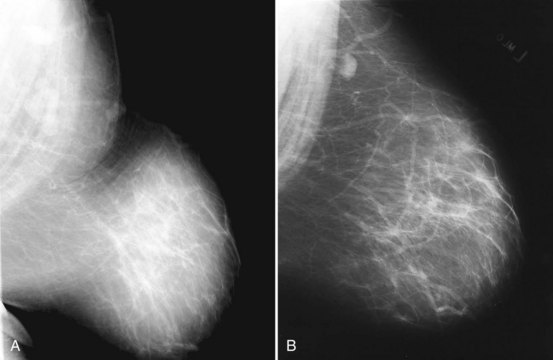
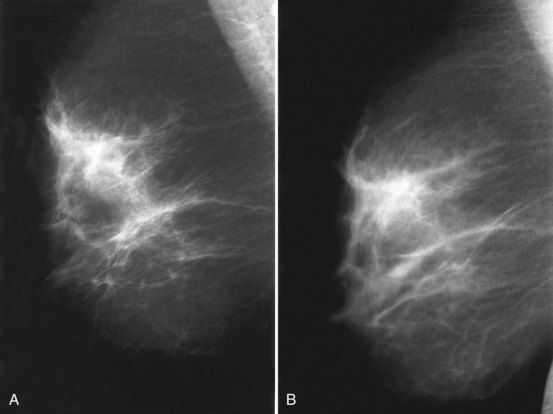
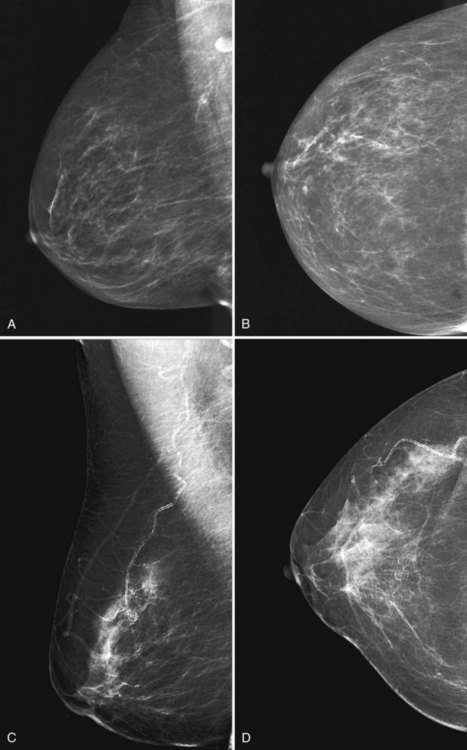
To pass ACR accreditation clinical image review, the MLO mammogram must show most of the breast tissue in one projection, with portions of the upper inner and lower inner quadrants partially excluded (Fig. 1-4). Clinical evaluation of the MLO view should show fat posterior to the fibroglandular tissue and a large portion of the pectoralis muscle, which should be concave and extend inferior to the posterior nipple line (PNL). The PNL describes an imaginary line drawn from the nipple to the pectoralis muscle or film edge and perpendicular to the pectoralis muscle. The PNL should intersect the pectoralis muscle in the MLO view in more than 80% of women. Although the technologist tries to avoid producing skin folds on the film when possible, they are seen occasionally but do not usually cause problems for the radiologist reading the film. The MLO view should show adequate compression, exposure, contrast, and an open inframammary fold, in which both the lower portion of the breast and a portion of the upper abdominal wall should be seen.
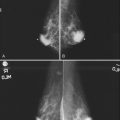
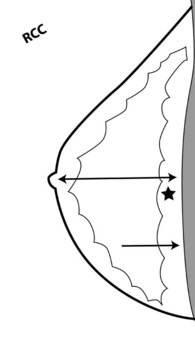
To pass ACR accreditation clinical image review, the CC view should include the medial posterior portions of the breast without sacrificing the outer portions (Figs. 1-5 and 1-6). With proper positioning technique, the technologist should be able to include the medial portion of the breast without rotating the patient medially by lifting the lower medial breast tissue onto the image receptor. The pectoralis muscle should be seen when possible on the CC view. On the CC view, the PNL extends from the nipple to the pectoralis muscle or the edge of the film, whichever comes first, perpendicular to the pectoralis muscle or film edge. For a given breast, the length of the PNL on the CC view should be within 1 cm of its length on the MLO view.
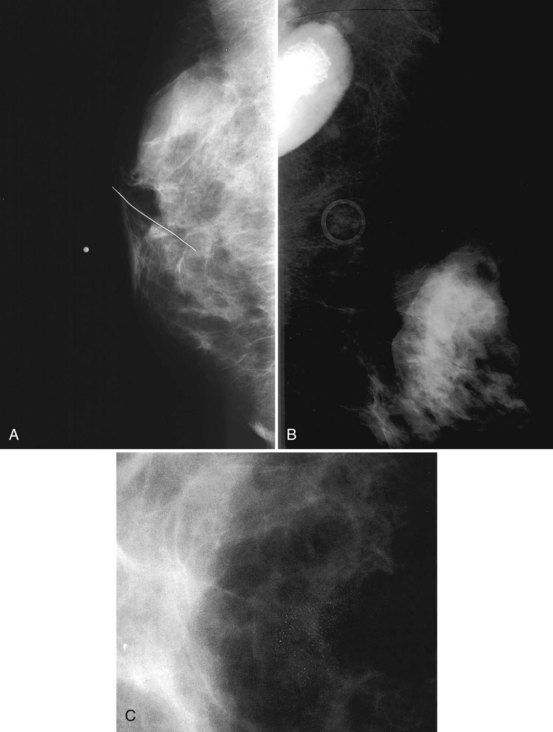
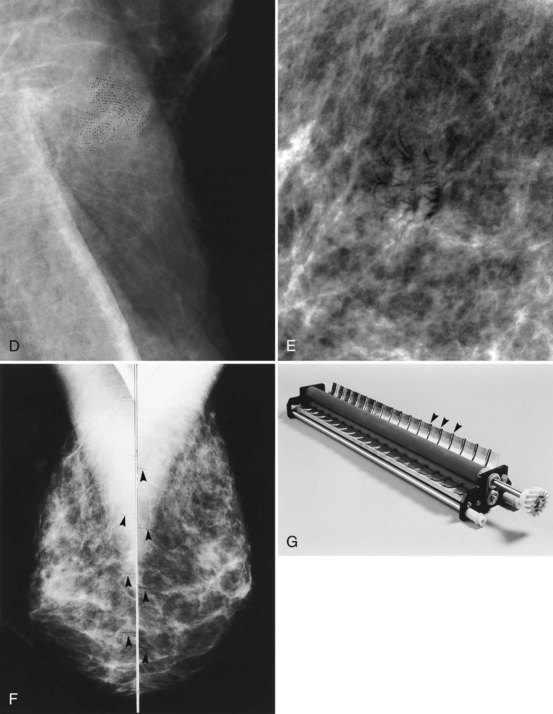
Clinical images are evaluated on positioning, compression, contrast, proper exposure, random noise (radiographic mottle or quantum mottle produced by varying numbers of x-rays contributing to the image in different locations, even with a uniform object), sharpness, and artifacts (or structured noise). Imaging on a phantom is helpful in evaluating most of these factors, except for positioning and compression (Fig. 1-7). Adequate exposure (to achieve adequate film OD) and adequate contrast (OD difference) are important to ensure detection of subtle abnormalities (Fig. 1-8). Artifacts seen on clinical images include processing artifacts (roller marks, wet pressure marks, guide shoe marks), white specklike artifacts from dust or lint between the fluorescent screen and film emulsion, grid lines from incomplete grid motion, motion artifacts from patient movement (made more likely by longer exposure times), skin folds from positioning, tree static caused by static electricity from low humidity in the dark room, or film handling artifacts (fingerprints, crimp marks, or pressure marks) (Figs. 1-9 to 1-12).
Film labeling is important (Box 1-6) because proper labeling ensures accurate facility, patient, laterality, and projection identification. Guidelines from the ACR Mammography Accreditation Program for mammogram labeling state that an identification label on the mammogram should specify the patient’s first and last name, unique identification number, facility name and address, date, view and laterality, an Arabic number indicating the cassette used, and the technologist’s initials. The laterality and projection marker should be placed near the axilla on all screen-film views.
Box 1-6
Film Labeling
Patient’s first and last names
Unique patient identification number
Name and address of the facility
View and laterality placed near the axilla
From Hendrick et al: Mammography quality control manual, Reston, VA, 1999, American College of Radiology, p 27.
Digital Mammography Image Acquisition
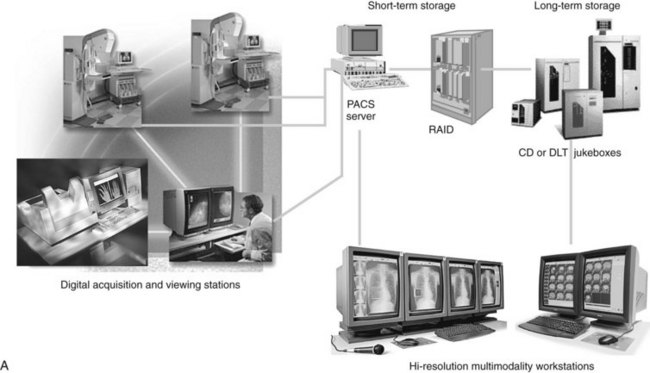
In digital mammography, the image is obtained in the same manner as in screen-film mammography, using a compression plate and an x-ray tube, with the screen-film cassette replaced by a digital detector (Figs. 1-13 and 1-14). Digital image acquisition has several potential advantages in terms of image availability, image processing, and CAD (Fig. 1-15). One advantage is elimination of the film processor, which eliminates artifacts and image noise added by processing films.
In terms of breast dose, FFDM has a mean glandular dose lower than, or comparable to, the radiation dose of SFM. Recent results from the American College of Radiology Imaging Network (ACRIN) Digital Mammographic Imaging Screening Trial (DMIST) found the average single-view mean glandular dose for FFDM to be 1.86 mGy, 22% lower than the average SFM mean glandular dose of 2.37 mGy (Hendrick et al., 2010). Specific manufacturers, especially those using slot-scanning techniques, produce lower doses than SFM. Slot-scanning systems, such as the Fischer SenoScan, have a narrow slot of detector elements that are scanned under the breast in synchronization with a narrow fan beam of x-rays swept across the breast. This design, although more technically difficult to implement, has the advantage of eliminating the need for a grid to reduce scattered radiation. Scatter is partially eliminated by the narrow slot itself. The absence of a grid reduces the amount of radiation to the breast needed to get the same SNR in the detector. Some full area detectors with AEC systems have also demonstrated lower breast doses compared to SFM, especially for thicker breasts.
As of May 2010, about two thirds (65.4%) of the mammography units in the United States were digital mammography systems. The FDA-approved manufacturers for digital mammography and their unit properties are listed in Table 1-3.
Quality Assurance in Mammography and the Mammography Quality Standards Act
MQSA, a federal law regarding mammography that is enforced by the FDA, stipulates that all institutions performing mammography must be certified by the FDA. A prerequisite to FDA certification is accreditation to perform mammography by an FDA-approved accrediting body, such as the ACR or an FDA-approved state accrediting body. Arkansas, Iowa, and Texas are approved to accredit mammography facilities in their own states. MQSA regulations are listed in the Federal Register. To update facilities on the latest regulation changes and updates, the FDA maintains a Web site on MQSA (www.fda.gov/cdrh/mammography/) that includes a section to guide users who have questions on MQSA compliance (www.fda.gov/cdrh/mammography/guidance-rev.html).
MQSA equipment requirements for mammography are summarized in Box 1-7. MQSA qualification requirements for radiologists, technologists, and medical physicists are outlined in Boxes 1-8 to 1-10.
Box 1-7
Mammography Quality Standards Act Equipment Requirements for Mammography
Be specifically designed for mammography
Have a breast compression device and have additional hand-operated compression to augment motor-driven compression
Have provision for operation with a removable grid for either 18 × 24-cm or 24 × 30-cm image receptors (screen-film only)
The mean glandular dose to a 4.5-cm thick breast is less than 3 mGy (0.3 rad) when the site’s clinical technique is used
Can angulate 180 degrees from craniocaudal orientation in at least one direction
Other minimum standards for beam limitation and light field, magnification capability, display of focal spot selection, technique factor selection and display, automatic exposure control, x-ray film, intensifying screens, film processing solutions, lighting and hot lights, film masking devices
Modified from The federal register. Available at www.fda.gov/cdrh/mammography/.
Box 1-8
Mammography Quality Standards Act Qualifications for Interpreting Physicians
Be licensed to practice medicine in the state
Be certified by a body approved by the FDA to certify interpreting physicians or have 3 months’ full-time training in mammography interpretation, radiation physics, radiation effects, and radiation protection and
Have earned 60 hours of documented mammography continuing medical education (CME) (time in residency will be accepted if documented in writing) and 8 hours of training in each modality (such as screen-film or digital mammography) and
Have read at least 240 examinations in the preceding 6 months under supervision or have read mammograms under the supervision of a fully qualified interpreting physician (see The Federal Register for exact requirements) and
Have read 960 mammograms over a period of 24 months
Have earned at least 15 Category 1 CME credits in mammography over a 36-month period, with 6 credits in each modality used
Modified from The federal register. Available at www.fda.gov/cdrh/mammography/.
Box 1-9
Mammography Quality Standards Act Qualifications for Radiologic Technologists
Have a license to perform radiographic procedures in their state or
Be certified by one of the bodies (such as the American Registry of Radiologic Technologists) approved by the FDA
Have undergone 40 hours of documented mammography training, with 8 hours of instruction in each modality used, and have completed at least 25 examinations or
Be exempted by having qualified under interim regulations
Complete 200 examinations in the previous 24 months and teach or complete at least 15 continuing education units (CEUs) in the past 36 months, including 6 in each modality used
Modified from The federal register. Available at www.fda.gov/cdrh/mammography/.
Box 1-10
Mammography Quality Standards Act Qualifications for Medical Physicists
Have a license or approval by a state to conduct evaluations of mammography equipment under the Public Health Services Act or have certification in an accepted area by one of the accrediting bodies approved by the FDA
Have a master’s or higher degree in physics, radiologic physics, applied physics, biophysics, health physics, medical physics, engineering, radiation science, or public health with a bachelor’s degree in the physical sciences and
Have 1 year in training in medical physics specific to diagnostic radiologic physics and
Have 2 years’ experience in conducting performance evaluation of mammography equipment and
Teach or complete 15 hours of continuing medical education in mammography physics every 36 months
Modified from The federal register. Available at www.fda.gov/cdrh/mammography/.
One radiologist at each facility must be designated the supervising interpreting physician to oversee the facility’s quality assurance (QA) program (Boxes 1-11 and 1-12). The supervising physician oversees assessment of mammography outcomes to evaluate the accuracy of interpretation. The facility must have a method for recording outcomes on interpretation of all abnormal mammographic findings and tallying these interpretations for each individual physician and for the group as a whole, providing feedback to each radiologist on a yearly basis (Box 1-13). A portion of the medical audit includes review of the pathology in cases recommended for biopsy.
Box 1-11
Quality Assurance Program for Equipment
All programs must establish and maintain a quality assurance (QA) program with periodic monitoring of the dose delivered by the examinations
For screen-film systems, the QA program is the same as described in Hendrick et al: Mammography Quality Control Manual: Radiologist’s Manual (1999), Radiological Technologist’s Manual, and Medical Physicist’s Manual prepared by the American College of Radiology Committee on Quality Assurance in Mammography
Maintenance of log books documenting compliance and corrective actions for each unit
Establish and maintain radiographic images of phantoms to assess performance of the mammography system for each unit
Major changes from the interim regulations include weekly phantom image quality testing and mammography unit performance tests after each relocation of the mobile unit
Modified from The federal register. Available at www.fda.gov/cdrh/mammography/.
Box 1-12
Quality Assurance for Clinical Images
Monitoring of repeat rate for repeated clinical images and their causes
Record keeping, analysis of results, and remedial actions taken on the basis of this monitoring
Modified from The federal register. Available at www.fda.gov/cdrh/mammography/.
Box 1-13
Quality Assurance for Interpretation of Clinical Images
Modified from The federal register. Available at www.fda.gov/cdrh/mammography/.
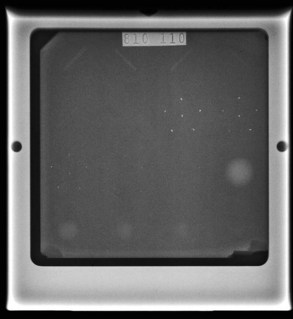
One radiologic technologist designated the QC technologist oversees the quality control (QC) tasks outlined in Table 1-4, which specifies the minimum frequency of each QC test and action limits for test performance. One important test performed by the QC technologist and reviewed by the interpreting physician is evaluation of the mammography phantom image; this test is performed at least weekly and evaluates the entire imaging system. The phantom consists of fibers, speck clusters, and masses of various sizes imbedded in a uniform phantom material. The technologist takes a phantom radiograph using the site’s clinical technique for a 4.5-cm thick compressed breast, the radiograph is processed on the site’s film processor, and the image is evaluated for the number of objects seen in each category. To pass accreditation and meet MQSA requirements, the phantom should show a minimum of four fibers, three speck groups, and three masses (Box 1-14). The phantom image should also be free of significant artifacts. These and other tests are used to evaluate the entire imaging system.
Table 1-4 Technologist Quality Control Tests for Screen-Film Mammography
| Periodicity | Quality Control Test | Desired Result |
|---|---|---|
| Daily | Darkroom cleanliness | No dust artifacts |
| Daily | Processor quality control | Density difference and mid-density changes not to exceed control limits of ±0.15 |
| Weekly | Screen cleanliness | No dust artifacts on films |
| Weekly | View box cleanliness | No marks on panels, uniform lighting |
| Weekly | Phantom image evaluation |
From Hendrick et al: Mammography quality control manual. Reston, VA, 1999, American College of Radiology, p. 119.
Box 1-14
Phantom Image
Evaluates the entire mammographic imaging chain (other than technologist positioning)
From Hendrick et al: Mammography quality control manual, Reston, VA, 1999, American College of Radiology, p 119.
The medical physicist surveys the equipment just after installation, after important major equipment repairs or upgrades, and annually, performing the QC tests outlined in Box 1-15. The medical physicist’s survey report is an important component of the QA program and is reviewed by the supervising physician to ensure high-quality mammography. The facility is responsible for correcting deficiencies pointed out by the site medical physicist.
Box 1-15 Medical Physicist’s Screen-Film Mammography Quality Control Tests (Annually and after Major Equipment Changes)
Screen-Film Mammography Quality Control
For SFM, MQSA specifies the QA/QC tests to be carried out by the QC technologist and the site medical physicist, as well as how frequent these tests must be performed. Technologist test frequencies range from daily to semi-annually, as specified in Table 1-4. Medical physicist tests are required annually, on acceptance of new equipment, or after major equipment changes and before its use on patients or volunteers (see Box 1-15). The technologist and medical physicist tests for SFM are described in detail in the 1999 edition of the ACR Mammography Quality Control Manual (Hendrick et al. 1999).
Full-Field Digital Mammography Quality Assurance and Quality Control
To comply with MQSA requirements, all personnel must have 8 hours of training specific to digital mammography documented in writing before clinical use of FFDM units in that facility (Box 1-16). Specifically, the radiologist must receive 8 hours of training in interpretation of digital mammography, with the strong recommendation from the FDA that training include instruction from a radiologist experienced in digital mammography interpretation on the specific system used. Technologists and medical physicists must also have documented training by appropriately qualified individuals; for example, the manufacturer’s application specialists or other qualified individuals should train technologists, and medical physicists qualified in digital mammography should provide hands-on training for medical physicists. It was originally specified that after initial certification, all personnel involved in digital mammography should receive 6 hours of Category I continuing medical education (CME) or continuing educational units (CEU) every 3 years, which could be part of the required 15 hours of continuing education required for all personnel in mammography. The completion of the required 15 hours of Category I CME in mammography every 3 years must be documented in writing.
Box 1-16 Educational Requirements for New Personnel Using Digital Mammography
For some tests, such as mean glandular dose to the ACR phantom being less than 3 mGy, the FDA specifies that failures must be corrected immediately before that component of the FFDM system (e.g., the digital mammography unit, review workstation, or laser imager) can be used. Test failures that must be corrected immediately include phantom image quality, contrast-to-noise ratio, radiation dose, and review workstation calibration. For other test failures, such as repeat analysis, collimation assessment, and other physics tests, 30 days are permitted for correction after problem identification. Typical digital mammography QC tests are listed in Box 1-17, although these vary by digital manufacturer.
Box 1-17 Medical Physicist’s Digital Mammography Quality Control Tests (Annually and after Major Equipment Changes)
1 Full-field digital mammography (FFDM) unit assembly evaluation
4 Automatic exposure control mode and signal-to-noise ratio check*
6 Contrast-to-noise ratio test*
7 Modulation transfer function measurement*
9 Evaluation of focal spot size
10 kVp accuracy and reproducibility
11 Assessment of beam quality (half-value layer measurement)
12 Breast entrance exposure, mean glandular dose,* and radiation output rate
Computer-Aided Detection
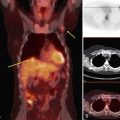
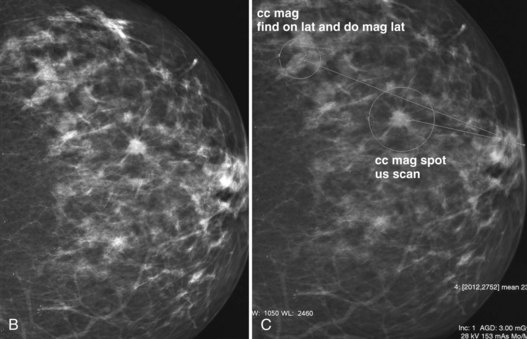
Mammography data used for CAD algorithms are obtained digitally from FFDM units or are digitized from screen-film mammograms. The digital or digitized mammograms undergo analysis by computer schemes, which mark potential abnormal findings on a low-resolution paper print or monitor image (Fig. 1-16). For FFDM, CAD marks potential abnormalities directly on the image displayed on the workstation monitor. The radiologist interprets and analyzes the marked findings, and each finding is dismissed as insignificant or recalled for further workup (Fig. 1-17).
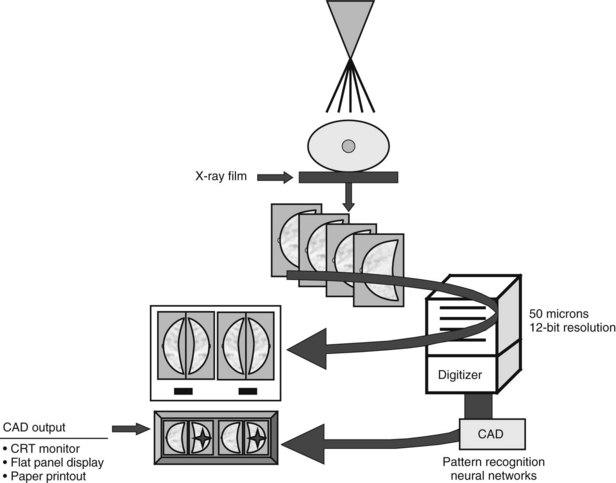
Figure 1-16 Computer-aided detection (CAD) schematic for screen-film and full-field digital mammograms. Film digitizers typically operate at 50-micron pixel (or 10 lp/mm) spatial resolution. Digital spatial resolution is set by the digital detector (see Table 1-3). CRT, cathode ray tube.
(Courtesy of R. Castellino, R2 Technology, San Jose, CA.)
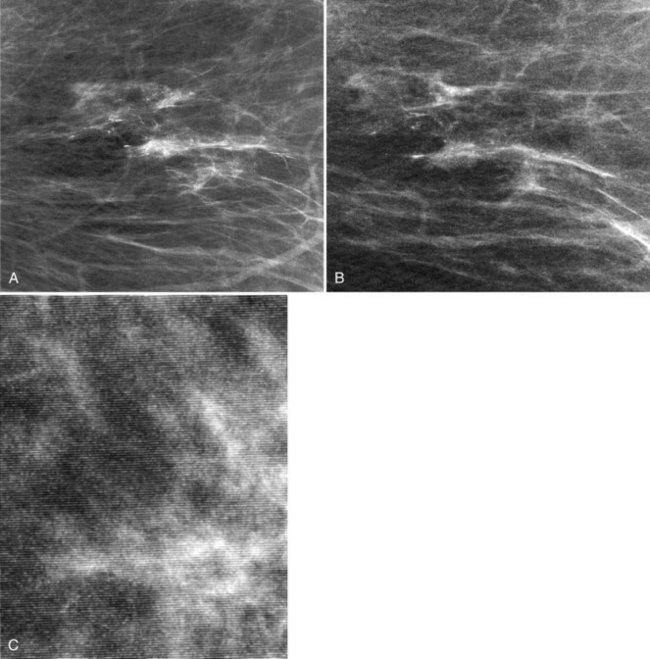
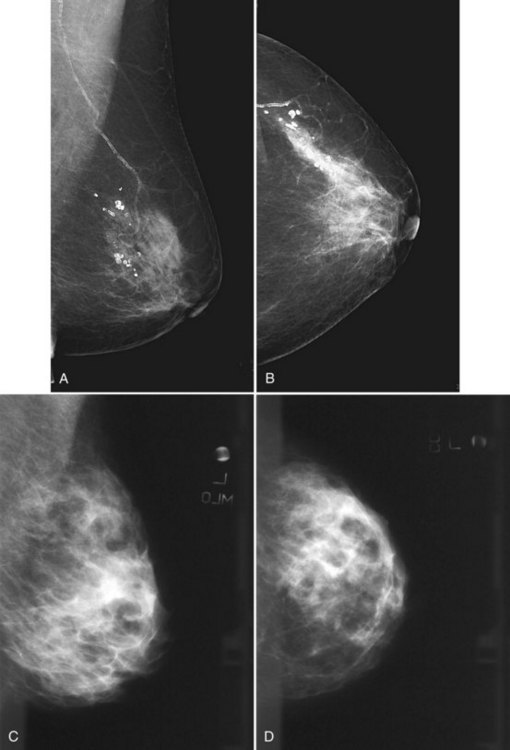
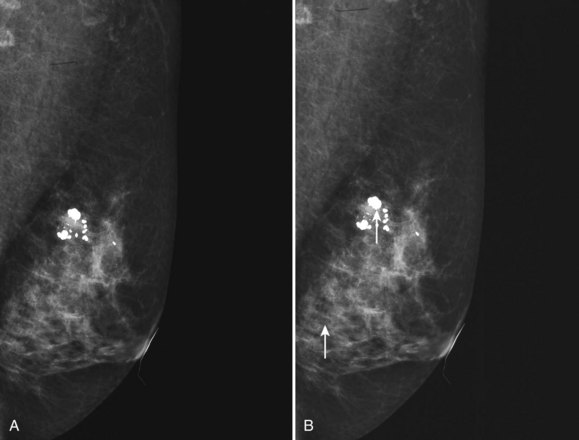
CAD algorithms detect microcalcifications, masses, and parenchymal distortions on images using computer schemes derived from large numbers of mammograms in which biopsy results are known. The computer scheme’s ability to mark true cancers is optimized by reviewing the “true positive” and “false positive” marks on the training set of mammograms. These optimized algorithms are later tested on both known subtle and obvious cancers. Using the optimized schemes, commercial CAD systems mark abnormalities that represent cancers (“true positive” marks, a measure of CAD sensitivity), and findings that do not represent cancer or where no known cancer has occurred (“false positive” marks, a measure of CAD specificity) (Fig. 1-18). Because detection of masses or calcifications by the CAD scheme is directly affected by image quality, good-quality mammograms are required to obtain good CAD output. Mammograms of suboptimal quality will result in poor CAD output. CAD output also can be affected by the type and reproducibility of the digitizer if the data is from digitized SFM. Thus, it is essential to have high-quality mammograms since CAD cannot overcome poor image quality.
Key Elements
American Cancer Society Guidelines for breast cancer screening of asymptomatic women include annual mammography starting at age 40.
The Mammography Quality Standard Act of 1992 is a congressional act enforced by the FDA under which mammography facilities in the United States are regulated.
The usual exposure for a mammogram is 24 to 32 kVp at 25 to 200 mA.
Screen-film and digital systems deliver a mean glandular breast dose of about 2 mGy per exposure (4 mGy per two-view examination) to a woman of average breast thickness and glandularity; mean glandular dose is lower for thin breasts, higher for thick breasts.
Anode/filter combinations for mammography are Mo/Mo, Mo/Rh, Rh/Rh, and W/Rh.
Screen-film image receptors are 18 × 24 cm and 24 × 30 cm in size.
Focal spot sizes for contact mammography and magnification mammography are nominally 0.3 and 0.1 mm, respectively.
Magnification mammography should produce 1.4× to 2.0× magnification.
Moving grids with grid ratios between 3.5 : 1 and 5 : 1 are used for contact mammography; no grid is used for magnification mammography.
The phantom image using the ACR mammography phantom evaluates the entire mammography imaging chain, is performed weekly, and at a minimum should detect four fibers, three speck groups, and three masses.
Film labeling includes the patient’s first and last names and unique identification number, the name and address of the facility, the date, the view and laterality positioned near the axilla, numbers indicating the cassette and the mammography unit, and the technologist’s initials.
The mediolateral oblique view should show good compression, contrast, exposure, sharpness, little noise, a posterior nipple line that intersects a concave pectoralis muscle, and an open inframammary fold.
The craniocaudal view should show good compression, contrast, exposure, sharpness, little noise, and a PNL that has a distance within 1 cm of the mediolateral oblique PNL length, and it should include medial breast tissue without sacrificing lateral breast tissue.
The MQSA requires specific training, experience, and continuing education for technologists, radiologists, and medical physicists.
To use a new modality, such as digital mammography, technologists, radiologists, and medical physicists are all required to have an initial 8 hours of training on that new modality prior to use.
Digital mammography detectors are composed of cesium iodide plus amorphous silicon diodes, cesium iodide plus arrayed charge-coupled devices, charged selenium plate read by silicon diodes, or CR plates consisting of a barium fluorobromide plate, which is read by a CR laser scanner.
Digital mammograms may be interpreted on printed films or on high-resolution 2K × 2.5K (5 Mpixel) monitors.
CAD programs can detect subtle but suspicious mammographic findings in dense or complex breast tissue.
CAD programs do not detect every breast cancer.
When CAD is used for interpretation of mammograms, the decision to recall a finding on a mammogram rests solely on the radiologist’s experience and judgment in interpretation of films.
American College of Radiology. ACR BI-RADS®—Mammography, ed 4. Reston, VA: American College of Radiology; 2003.
Baker JA, Rosen EL, Lo JY, et al. Computer-aided detection (CAD) in screening mammography: Sensitivity of commercial CAD systems for detecting architectural distortion. AJR Am J Roentgenol. 2003;181:1083-1088.
Bassett LW, Feig SA, Hendrick RE, et al. Breast Disease (Third Series) Test and Syllabus. Reston, VA: American College of Radiology; 2000.
Berns EA, Hendrick RE, Cutter GR. Performance comparison of full-field digital mammography to screen-film mammography in clinical practice. Med Phys. 2002;29:830-834.
Berns EA, Hendrick RE, Solari M, et al. Digital and screen-film mammography: comparison of image acquisition and interpretation times. AJR Am J Roentgenol. 2006;187:38-41.
Birdwell RL, Ikeda DM, O’Shaughnessy KF, Sickles EA. Mammographic characteristics of 115 missed cancers later detected with screening mammography and the potential utility of computer-aided detection. Radiology. 2001;219:192-202.
Ciatto S, Del Turco MR, Risso G, et al. Comparison of standard reading and computer aided detection (CAD) on a national proficiency test of screening mammography. Eur J Radiol. 2003;45:135-138.
Coldman A, Phillips N, Warren L, Kan L. Breast cancer mortality after screening mammography in British Columbia women. Int J Cancer. 2007;120:1076-1080.
Curry TS, Dowdy JE, Murray RC. Christensen’s Physics of Diagnostic Radiology, ed 4. Malvern, PA: Lea & Febiger; 1990.
Duffy SW, Tabar L, Chen THH, et al. for The Swedish Organized Service Screening Evaluation Group: Reduction in breast cancer mortality from organized service screening with mammography: 1. Further confirmation with extended data. Cancer Epidemiol Biomarkers Prev. 2006;15:45-51.
Feig SA, Sickles EA, Evans WP, Linver NM. Re: Changes in breast cancer detection and mammography recall rates after the introduction of a computer-aided detection system. J Natl Cancer Inst. 2004;96:1260-1261.
Fenton JJ, Taplin SH, Carney PA, et al. Influence of computer-aided detection on performance of screening mammography. N Engl J Med. 2007;356:1399-1409.
Freer TW, Ulissey MJ. Screening mammography with computer-aided detection: prospective study of 12,860 patients in a community breast center. Radiology. 2001;220:781-786.
Galen B, Staab E, Sullivan DC, Pisano ED. Congressional update: Report from the Biomedical Imaging Program of the National Cancer Institute. American College of Radiology Imaging Network: The digital mammographic imaging screening trial—an update. Acad Radiol. 2002;9:374-375.
Gur D, Sumkin JH, Rockette HE. Changes in breast cancer detection and mammography recall rates after the introduction of a computer-aided detection system. J Natl Cancer Institute. 2004;96:185-190.
Gromet M. Comparison of computer-aided detection to double reading of screening mammograms: review of 231,221 mammograms. AJR Am J Roentgenol. 2008;190:854-859.
Hemminger BM, Dillon AW, Johnston RE, et al. Effect of display luminance on the feature detection rates of masses in mammograms. Med Phys. 1999;26:2266-2272.
Hendrick RE, Bassett LW, Botsco MA, et al. Mammography Quality Control Manual. Reston, VA: American College of Radiology; 1999.
Hendrick RE, Cole E, Pisano ED, et al. ACRIN DMIST retrospective multi-reader study comparing the accuracy of softcopy digital and screen-film mammography by digital manufacturer. Radiology. 2008;247:38-48.
Hendrick RE, Cutter G, Berns EA, et al. Community-based screening mammography practice: services, charges and interpretation methods. AJR Am J Roentgenol. 2005;84:433-438.
Hendrick RE, Pisano ED, Averbukh A, et al. Comparison of acquisition parameters and breast dose in digital mammography and screen-film mammography in the American College of Radiology Imaging Network Digital Mammographic Screening Trial. Am J Roentgenology. 2010;194:362-369.
Lewin JM, D’Orsi CJ, Hendrick RE, et al. Clinical comparison of full-field digital mammography and screen-film mammography for detection of breast cancer. AJR Am J Roentgenol. 2002;179:671-677.
Lewin JM, Hendrick RE, D’Orsi CJ, et al. Comparison of full-field digital mammography with screen-film mammography for cancer detection: Results of 4,945 paired examinations. Radiology. 2001;218:873-880.
Linver MN, Osuch JR, Brenner RJ, Smith RA. The mammography audit: A primer for the Mammography Quality Standards Act (MQSA). AJR Am J Roentgenol. 1995;165:19-25.
Markey MK, Lo JY, Floyd CEJr. Differences between computer-aided diagnosis of breast masses and that of calcifications. Radiology. 2002;223:489-493.
Monsees BS. The Mammography Quality Standards Act. An overview of the regulations and guidance. Radiol Clin North Am. 2000;38:759-772.
1998 MQSA (Mammography Quality Standards Act) final rule released. American College of Radiology. Radiol Manage. 1998;20:51-55.
Nass SJ, Henderson IC, Lashof LJ, editors. Mammography and Beyond: Developing Technologies for the Early Detection of Breast Cancer. Washington, DC: National Academy Press, 2001.
Pisano ED, Cole EB, Kistner EO, et al. Interpretation of digital mammograms: comparison of speed and accuracy of soft-copy versus printed-film display. Radiology. 2002;223:483-488.
Pisano ED, Cole EB, Major S, et al. for the International Digital Mammography Development Group: Radiologists’ preferences for digital mammographic display. Radiology. 2000;216:820-830.
Pisano ED, Gatsonis CA, Yaffe MJ, et al. American College of Radiology Imaging Network Digital Mammographic Imaging Screening Trial: objectives and methodology. Radiology. 2005;236:404-412.
Pisano ED, Gatsonis CA, Hendrick RE, et al. Diagnostic performance of digital versus film mammography for breast-cancer screening: the results of the American College of Radiology Imaging Network (ACRIN) Digital Mammographic Imaging Screening Trial (DMIST). N Engl J Med. 2005;353:1773-1783.
Pisano ED, Hendrick RE, Yaffe MJ, et al. Diagnostic accuracy of digital versus film mammography: exploratory analysis of selected population subgroups in DMIST. Radiology. 2008;246:376-383.
Pisano ED, Yaffe MJ. Digital mammography. Radiology. 2005;234:353-361.
Quek ST, Thng CH, Khoo JB, Koh WL. Radiologists’ detection of mammographic abnormalities with and without a computer-aided detection system. Australas Radiol. 2003;47:257-260.
Rong XJ, Shaw CC, Johnston DA, et al. Microcalcification detectability for four mammographic detectors: flat-panel, CCD, CR, and screen/film. Med Phys. 2002;29:2052-2061.
Rothenberg LN, Feig SA, Hendrick RE, et al: A Guide to Mammography and Other Breast Imaging Procedures, NCRP Report #149. Bethesda, MD, 31 December 2004, National Council of Radiation Protection and Measurements.
Saslow D, Boetes C, Burke W, et al. American Cancer Society guidelines for breast screening with MRI as an adjunct to mammography, for the American Cancer Society Breast Cancer Advisory Group. CA Cancer J Clin. 2007;57:75-89.
Skaane P, Hofvind S, Skjennald A. Randomized trial of screen-film versus full-field digital mammography with soft-copy reading in population-based screening program: follow-up and final results of Oslo II study. Radiology. 2007;244:708-717.
Skaane S, Skjennald A. Screen-film mammography versus full-field digital mammography with soft-copy reading: randomized trial in a population-based screening program—the Oslo II study. Radiology. 2004;232:197-204.
Smith RA, Saslow D, Sawyer KA, et al. American Cancer Society guidelines for breast cancer screening: update 2003. CA Cancer J Clin. 2003;53:141-169.
Tabar L, Yen MF, Vitak B, et al. Mammography service screening and mortality in breast cancer patients: 20-year follow-up before and after introduction of screening. Lancet. 2003;361:1405-1410.
U.S. Department of Health and Human Services. Food and Drug Administration. Compliance Guidance: The Mammography Quality Standards Act Final Regulations Document #1; Availability. Notice. Fed Reg. 1999;64(53):13590-13591.
U.S. Department of Health and Human Services. Food and Drug Administration. State certification of mammography facilities. Final rule. Fed Reg. 2002;67(25):5446-5469.
Vedantham S, Karellas A, Suryanarayanan S, et al. Breast imaging using an amorphous silicon-based full-field digital mammographic system: stability of a clinical prototype. J Digit Imaging. 2000;13:191-199.
Vedantham S, Karellas A, Suryanarayanan S, et al. Full breast digital mammography with an amorphous silicon-based flat panel detector: physical characteristics of a clinical prototype. Med Phys. 2000;27:558-567.
Venta LA, Hendrick RE, Adler YT, et al. Rates and causes of disagreement in interpretation of full-field digital mammography and film-screen mammography in a diagnostic setting. AJR Am J Roentgenol. 2001;176:1241-1248.
Warren Burhenne LJ, Wood SA, D’Orsi CJ, et al. Potential contribution of computer-aided detection to the sensitivity of screening mammography. Radiology. 2000;215:554-562.
Zheng B, Shah R, Wallace L, et al. Computer-aided detection in mammography: an assessment of performance on current and prior images. Acad Radiol. 2002;9:1245-1250.
Zhou XQ, Huang HK, Lou SL. Authenticity and integrity of digital mammography images. IEEE Trans Med Imaging. 2001;20:784-791.