Chapter 2 Mammogram Interpretation
Breast Cancer Risk Factors
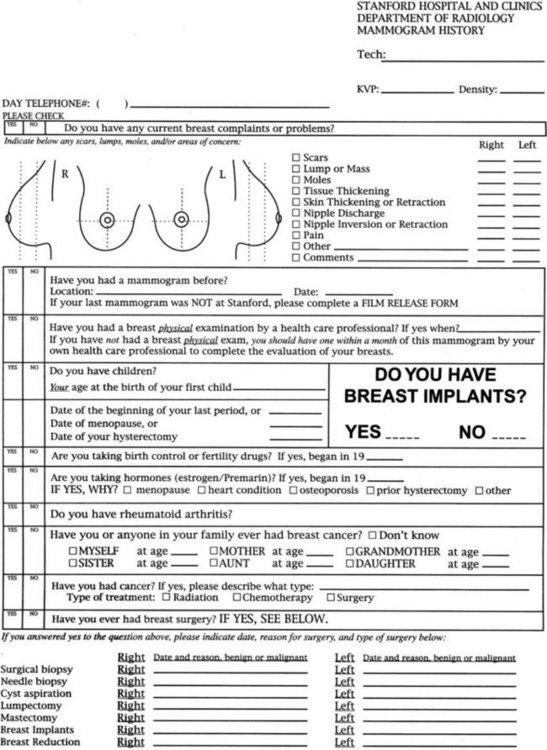
Risk factors for breast cancer are important to consider when reading mammograms, because they indicate a pretest probability of breast cancer. Compiling risk information on the breast history sheet provides the interpreting radiologist quick and easy-to-use access to this information (Fig. 2-1). Breast cancer risk factors are listed in Box 2-1. The most important risk factors are older age and female gender; U.S. statistics indicate that breast cancer will develop in one in eight women, if the women have a 90-year life span. Men also develop breast cancer, but only 1% of all breast cancers occur in men.
A family history of breast or ovarian cancer is a particularly important risk factor. The age, number, and cancer type in the affected relative is especially significant. Women with a first-degree relative (mother, daughter, or sister) with breast cancer have about double the risk of the general population and are at particularly high risk if that cancer was premenopausal or bilateral. If many relatives had breast or ovarian cancer, the woman may be a carrier of BRCA1 or BRCA2, the autosomal dominant breast cancer susceptibility genes. Genetic testing for these genes is possible. However, genetic testing is most appropriate when combined with the counseling, evaluation, and support provided by a genetic screening center because of the untoward social effects of positive (or negative) results. Carriers of the breast cancer susceptibility gene BRCA1 on chromosome 17 have a breast cancer risk of 85% and an ovarian cancer risk of 63% by age 70. Women with BRCA2 on chromosome 15 have a high risk of breast cancer and a low risk of ovarian cancer. These genes account for 5% of all breast cancers in the United States and for 25% of breast cancers in women younger than age 30. Women of Ashkenazi (Eastern European) Jewish heritage have a slightly higher risk of breast cancer than does the general population (Box 2-2), but additional work is being done to determine whether this population has a higher rate of breast and ovarian cancer related to BRCA1 and BRCA2 mutations. Other genetic syndromes that have a higher risk of breast cancer include the Li-Fraumeni, Cowden, and ataxia-telangiectasia syndromes.
Box 2-2 Family History Suggesting an Increased Risk of Breast Cancer
>2 relatives with breast or ovarian cancer
Breast cancer in relative age <50 years
Relatives with breast and ovarian cancer
Relatives with 2 independent breast cancers or breast plus ovarian cancer
Male relative with breast cancer
Family history of breast or ovarian cancer and Ashkenazi Jewish heritage
Signs and Symptoms of Breast Cancer
Women, or their partners, often find their own breast cancer by discovering a palpable hard breast lump. Breast lumps are a common symptom for which women seek advice (Box 2-3). Of particular concern are new, growing, or hard breast masses. Masses that are stuck to the skin or chest wall are particularly worrisome for an invasive breast cancer.
The Normal Mammogram
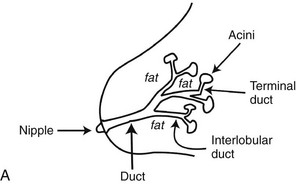
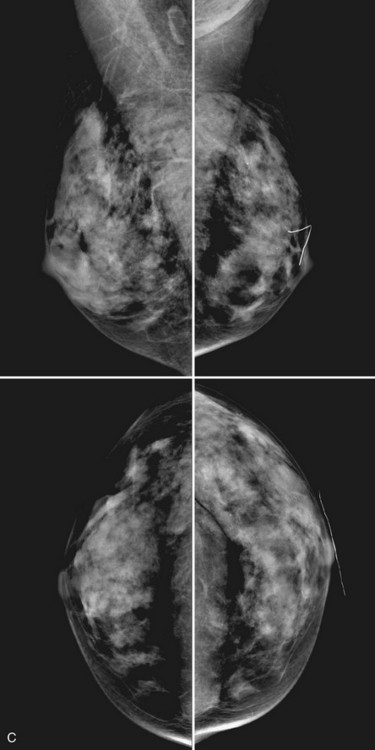
A normal breast is composed of a honeycomb supporting fibrous structure made up of Cooper ligaments that houses fatty tissue, which in turn supports the glandular elements of the breast (Fig. 2-2A). The glandular elements are composed of lactiferous ducts leading from the nipple and branching into excretory ducts, interlobular ducts, and terminal ducts leading to the acini that produce milk. The ducts are lined throughout their course by epithelium composed of an outer myoepithelial layer of cells and an inner secretory cell layer. The ducts and glandular tissue extend posteriorly in a fanlike distribution consisting of 15 to 20 lobes draining each of the lactiferous ducts, with most of the dense tissue found in the upper outer quadrant. Posterior to the glandular tissue is retroglandular fat, described by Dr. Laszlo Tabar as a “no man’s land,” in which no glandular tissue should be seen. The pectoralis muscle lies behind the fat on top of the chest wall.
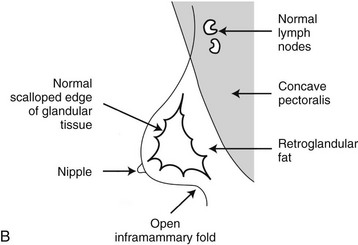
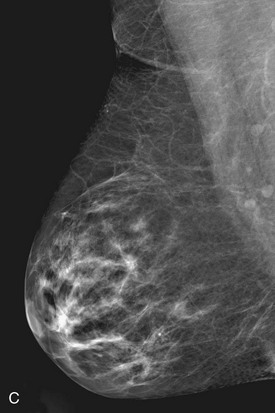
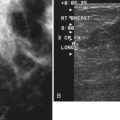
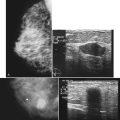
On the normal mediolateral oblique (MLO) mammogram, the pectoralis muscle is a concave structure posterior to the retroglandular fat near the chest wall. Normal lymph nodes high in the axilla overlie the pectoralis muscle (see Fig. 2-2B and C). Normal lymph nodes are sharply marginated, oval, or lobulated dense masses with a radiolucent fatty hilum. They are commonly found in the upper outer quadrant of the breast along blood vessels. Lymph nodes also occur normally within the breast and are known as normal “intramammary” lymph nodes. If the lymph node has the typical kidney bean shape and a fatty hilum, it should be left alone. If one is uncertain about whether a mass represents an intramammary lymph node, mammographic magnification views may help display the fatty hilum, or ultrasound may show the typical hypoechoic appearance of the lymph node and the echogenic fatty hilum.
Usually fibroglandular tissue occurs symmetrically in the upper outer quadrants of the breasts. The breast tissue is usually distributed fairly symmetrically from left to right. When viewing mammograms, the clinician should place the mammograms back to back so that the chest walls face each other for easy viewing of tissue symmetry (see Fig. 2-5A). Fatty tissue surrounds the glandular tissue.
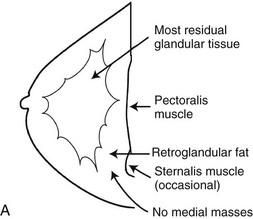
On the normal craniocaudal (CC) projection, the pectoralis muscle produces a half-moon–shaped density near the chest wall (Fig. 2-3A and B). Fat lies anterior to the muscle, and the white glandular tissue lies anterior to the fat. In older women, most of the glandular tissue in the medial breast undergoes fatty involution, and therefore most of the residual dense glandular tissue exists in the upper outer breast.
There should be only fatty tissue in the medial breast near the chest wall. The only normal exception is the sternalis muscle, a muscular density near the medial aspect of the chest wall that should not be mistaken for a mass (see Fig. 2-3C and D). If there is a question that the density is a mass instead of the sternalis muscle, a cleavage view (CV) mammogram or ultrasound can prove that the density is a muscle and a normal structure.
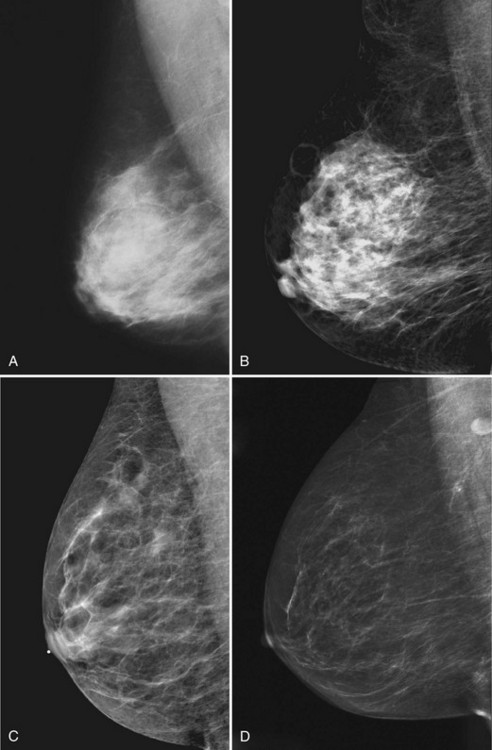
The American College of Radiology’s (ACR) Breast Imaging Reporting and Data System (BI-RADS®) lexicon separates breast density into quartiles depending on how much glandular tissue the breast contains by volume. “Dense” contains the most white (>75% dense), “heterogeneously dense” is less white (50–75% dense), “scattered fibroglandular” is even less white (25–50%), and “fatty” is the least white (<25% dense) (Box 2-4). A “dense” breast does not mean the breast is hard to the touch. Breast density has little correlation to how hard or soft the breast feels on physical examination; that is, you cannot predict how soft a breast will feel by looking at the mammogram. Radiologists describe breast density in the mammogram report so that referring doctors will know how white the breast looks and how confident the radiologist is in excluding cancer.
Box 2-4
ACR BI-RADS® Terms for Breast Density
The breast is almost entirely fat (<25% glandular).
There are scattered fibroglandular densities (approximately 25–50% glandular).
The breast tissue is heterogeneously dense, which could obscure detection of small masses (approximately 51–75% glandular).
From American College of Radiology: ACR BI-RADS®—mammography, ed 4, In ACR Breast Imaging and Reporting and Data System, breast imaging atlas, Reston, VA, 2003, American College of Radiology.
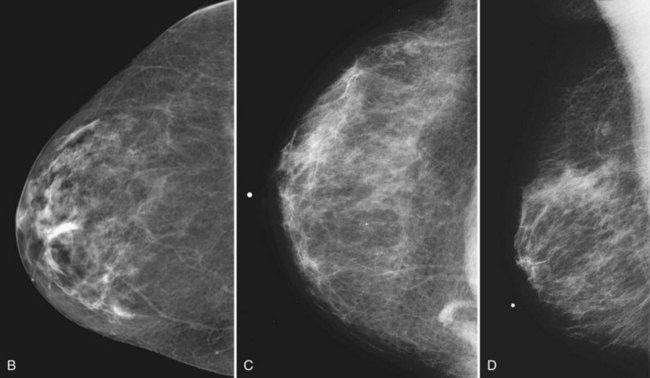
Young women have mostly glandular breasts, and their mammograms are described as “dense.” As women age, the fibroglandular tissue involutes into fat, which is black. The natural progression of the mammogram is mostly white (dense) at a young age when the breasts are filled with glandular tissue, becoming progressively darker as the woman ages and her glandular tissue turns into fat. The amount of remaining glandular tissue varies from woman to woman. Some older women have surprisingly large amounts of dense white tissue on the mammogram; the amount remaining depends on genetics, parity, and exogenous hormone replacement therapy. But generally as women age, the glandular tissue involutes so that there are relatively greater amounts of dense glandular tissue remaining in the upper outer quadrant of the breast and darker fatty areas in the medial and lower part of the breast. In some women, only fatty tissue is left after the menopause (Fig. 2-4).
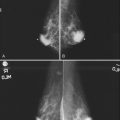
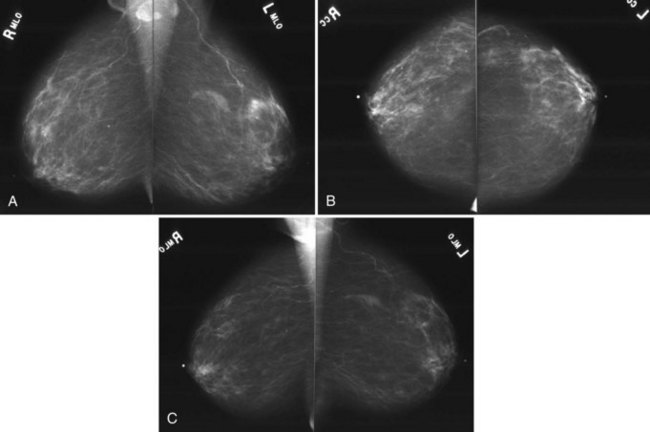
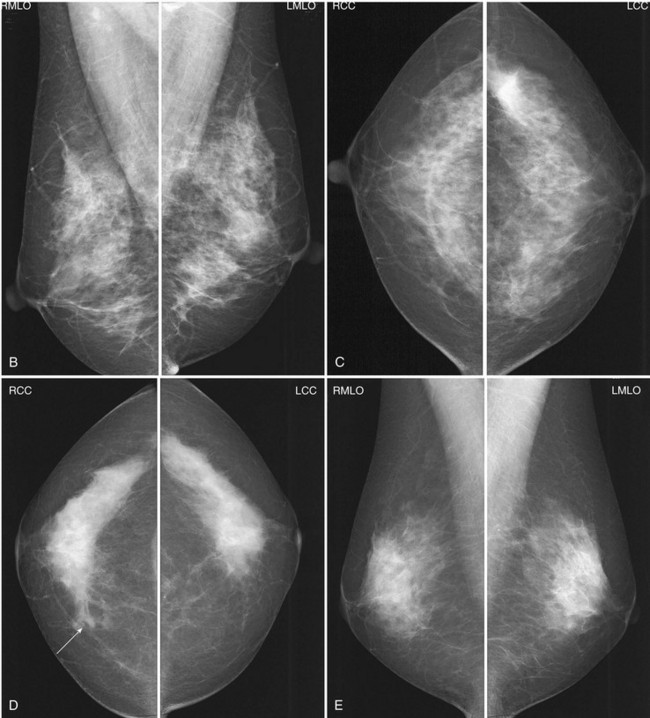
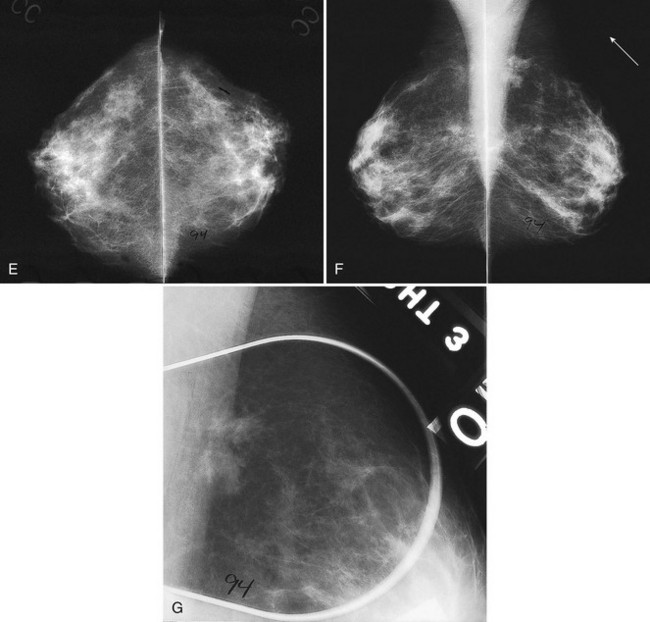
Breast tissue is usually symmetric, or “mirror image,” when comparing left to right mammograms, although 3% of women have normal asymmetric glandular tissue. Normal asymmetric glandular tissue is a larger volume of normal fibroglandular tissue in one breast than in the other, but with one breast not necessarily being larger than the other. One method of evaluating for symmetry is to view the left and right MLO mammograms back to back and the CC mammograms back to back. The glandular tissue pattern is usually fairly symmetric from side to side, and asymmetries are easily identified using this technique (Fig. 2-5A to C).
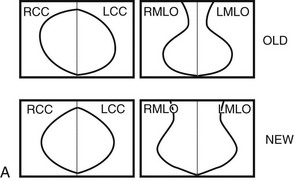
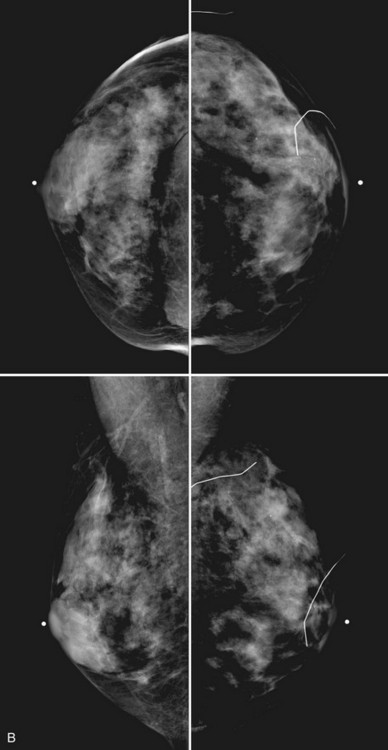

A normal mammogram does not usually change from year to year after taking into account the normal involution of glandular tissue over time. Because the mammogram stays the same from year to year, comparing old studies with current studies makes it easier to see new or developing changes. For this reason, older films of good quality are placed next to the new films to look for subtle change (see Fig 2-5D to H). Because subtle changes may take longer than a year to become evident, one should compare both last year’s films and films more than 2 years old (or the oldest films of comparable quality) to the new ones. If the mammograms are screen-film studies, the images are viewed on a high-intensity view box with the light parts of the films masked to block extraneous light. For full-field digital mammograms (FFDMs) viewed on soft copy, the images are displayed on high-resolution bright monitors in a dark room with little to no ambient light, comparing old mammograms to new ones in the display protocol.
Mammographic Findings of Breast Cancer
Mammographic detection of breast cancer depends on the sensitivity of the test, the experience of the radiologist, the morphologic appearance of the tumor, and the background on which it is displayed. Cause for a “missed” breast cancer can usually be traced to one of these factors (Table 2-1).
| Errors in technique |
Radiologists see breast cancers on screening mammography because they see pleomorphic calcifications or spiculations produced by the tumor. Radiologists also may see architectural distortion, asymmetric density, a developing density, a round mass, breast edema, lymphadenopathy, or a single dilated duct, which are the other mammographic signs of breast cancer. The radiologist has to not only see the finding, but to also recognize that the finding is abnormal and correctly interpret the study as needing further action (i.e., is “actionable”) (Box 2-5).
The mammographic signs of breast cancer listed in Table 2-2 are discussed in further detail in Chapter 3 on breast calcifications, Chapter 4 on breast masses, and Chapter 10 on clinical problems. The trick is to see the cancer, perceive it and have it register in one’s mind, then interpret the findings correctly and act on the finding.
Table 2-2 Mammographic Findings of Breast Cancer
| Finding | Differential Diagnosis |
|---|---|
| Pleomorphic calcifications | Cancer (most common), benign disease, fat necrosis |
| Spiculated mass | Cancer, postsurgical scar, radial scar, fat necrosis |
| Round mass | Cyst, fibroadenoma, cancer, papilloma, metastasis |
| Architectural distortion | Postsurgical scarring, cancer |
| Developing density | Cancer, hormone effect, focal fibrosis |
| Asymmetry: focal or global | Normal asymmetric tissue (3%), cancer (suspicious: new, palpable, a mass containing suspicious calcifications or spiculation) |
| Breast edema | |
| Lymphadenopathy | |
| Single dilated duct | Normal variant, papilloma, cancer |
| Mass with calcifications | Cancer, fibroadenoma, papilloma; exclude calcifying oil cyst |
| Nothing | 10% of all cancers are false-negative on mammography |
An Approach to the Mammogram
Many tools are available to help the radiologist correctly interpret mammograms (Table 2-3). The first is the breast history and physical findings. The breast history sheet alerts the radiologist to the patient’s risk factors for cancer and the patient’s pretest probability of cancer (see Fig. 2-1). The history sheet includes the patient’s clinical history of breast biopsies and a schematic diagram of their location so that old scars are not misinterpreted as cancer.
| Tool | Use |
|---|---|
| Breast history, risk factors | Evaluate patient’s complaint and risks |
| Technologist’s marks | Show skin lesions, scars, problem areas |
| Putting images back to back |
CAD, computer-aided detection; FFDM, full-field digital mammogram; SFM, screen-film mammogram.
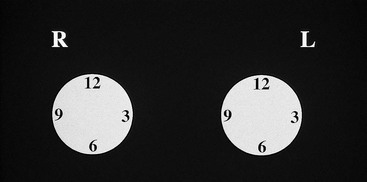
A technologist or aide usually interviews the patient, marking the location of any palpable finding on a diagram on the history sheet. Positions of findings in the breast are described in breast quadrants, with the upper outer quadrant representing the breast quadrant nearest the axilla. Another way to describe a breast location is by using the “clock face” method, in which the location of breast findings is described as though a clock were superimposed on each breast as the woman faces the examiner (Fig. 2-6). This means that the upper outer quadrant in the right breast is between the 9- and 12-o’clock positions, but the upper outer quadrant in the left breast is between the 12- and 3-o’clock positions.
The radiologist then starts a targeted systematic review of each film (Table 2-4). The radiologist first evaluates the images for good positioning, contrast, and compression. Next, the radiologist looks at the dense breast tissue for symmetry between the left and right breasts, which should be symmetric. The radiologist then looks at the whitest, or densest, part of the mammogram to see whether there is a mass or distortion there.
Table 2-4 Systematic Approach to Interpretation of Mammograms
| Search Pattern | Normal Findings |
|---|---|
| Overall Search | |
| Evaluation of technique | Good technique |
| Fibroglandular symmetry | |
| White areas in glandular tissue | No mass or distortion; white areas look like normal tissue on the orthogonal views |
| Targeted Search | |
| Edge of glandular tissue | No “pulling in” or tent sign, no concave masses |
| Nipple/areolar complex | Nipple everted, no skin thickening |
| Retroareolar region | Normal ducts, vessels, nipple in profile on at least one view |
| Skin | 2–3 mm in thickness, no edema |
| Axilla | Normal lymph nodes, normal variant axillary breast tissue |
| Retroglandular fat | All fat, no masses between glandular tissue and chest wall |
| Medial breast | Mostly fat, normal variant medial sternalis muscle |
| Film edge | No mass or spiculation from findings lying outside the field of view |
| Use magnifying lens or magnifier | No pleomorphic calcifications, subtle distortion, or masses |
| Use bright light (SFM) or adjust window/level (FFDM) | Evaluate dark areas as needed |
| Compare with old films | No change; be alert for a developing density, new or changing calcifications or masses |
| CAD | Do a second look of the marked areas; CAD comes last because it does not pick up all cancers |
CAD, computer-aided detection; FFDM, full-field digital mammogram; SFM, screen-film mammogram.
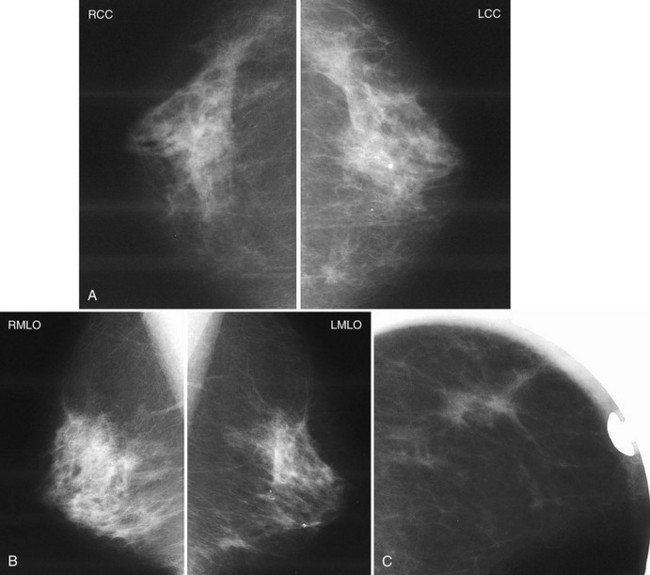
The following section details the individual components of the systematic approach to the mammogram (see Table 2-4). The first step is to look at the mammographic technique for good quality and then to look for symmetry between the breasts, which are usually symmetric. Sometimes breast tissue is asymmetric, meaning that there is more normal glandular tissue in one breast than the other; this is a normal variant, like having one foot bigger than the other. Normal asymmetry consists of a normal asymmetric volume of breast tissue, more in one side than the other. On the CC and MLO views, the glandular asymmetry should “spread out” and not look like a mass (Fig. 2-7). Normal asymmetry can also be caused by removal of fibroglandular tissue from one breast by biopsy, making the other breast look like it has more tissue. Normal asymmetries should have no suspicious calcifications, spiculations, or palpable masses. Normal asymmetries are stable when compared with older studies. They are composed of fibroglandular tissue. If the asymmetry is palpable, has suspicious calcifications or spiculations, is new, or is a mass, the asymmetry may represent cancer and should prompt a workup or biopsy.
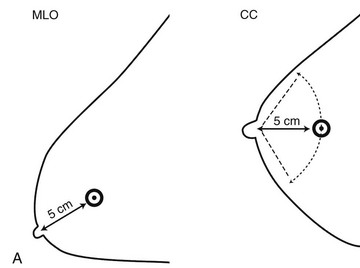
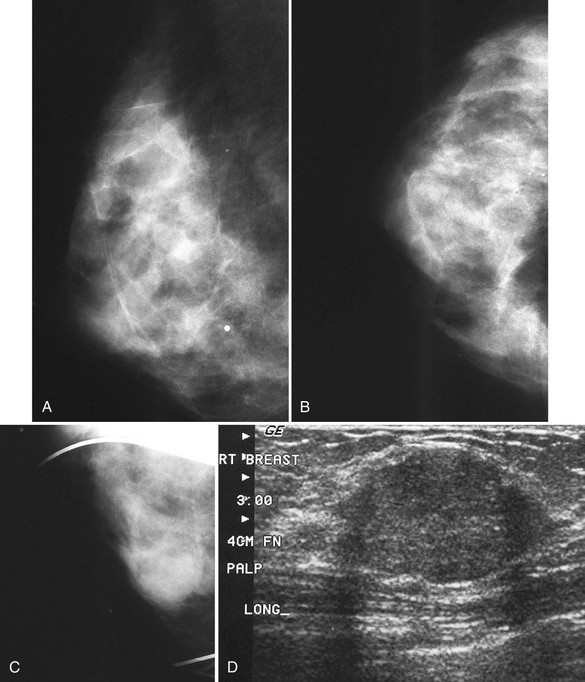
The next step is to look at the white parts of the mammograms for masses. Radiologists see masses because they are whiter than the surrounding tissue. Alternatively, a round or spiculated mass edge is seen against fat. If a possible mass is present on one projection, the radiologist looks for the mass on the orthogonal view. To do this the radiologist measures the distance from the nipple to the mass and searches the orthogonal view for the mass at this distance (Fig. 2-8A). If the finding is seen on two views, it is considered a mass. If it is seen on only one view, it is called a density and represents either a summation shadow (see Fig. 2-8B and C) or a mass (see Fig. 2-8D to H) that is obscured on the second view. The decision to recall this type of finding and prompt a workup is based on the radiologist’s experience and the degree of suspicion of the one-view finding.
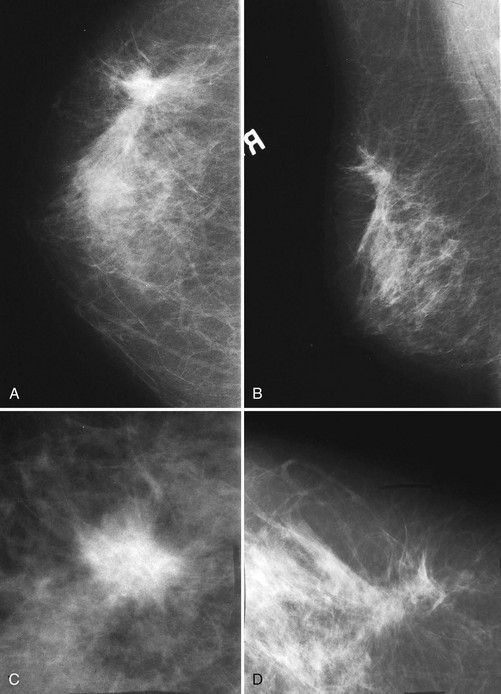
The radiologist next looks at all the normal glandular tissue edges where they interface with fat. A layer of fat typically surrounds the cone of normal fibroglandular tissue and should contain no masses. As part of the systematic review, the radiologist checks the fat all around the glandular tissue to make sure that no masses are present. These edges should be gently curving, scalloped, and without tethering. Masses at the glandular edge or in breast tissue can “pull in” the fat, producing a tent sign caused by productive fibrosis from cancer retracting the Cooper ligaments and breast ducts. In other cases, tumor spiculation produces straight lines extending into the glandular tissue that draw attention to a mass at the center of the radius of spicules (see Fig. 2-8F). Subtle equal-density cancers can be difficult to detect, but looking for secondary signs of straightened lines in glandular tissue or tethering of the glandular tissue edge guides the radiologist to the cancer.
Normal breast skin is approximately 2 to 3 mm thick on the mammogram, and normal subcutaneous fat is dark. The skin should be smooth all around the breast and not pulled in (Fig. 2-9). Skin thickening greater than 2 to 3 mm that is asymmetric to the contralateral side is abnormal and is especially worrisome if the subcutaneous tissue has become gray and the thin tethering lymphatics and ligaments become thick and trabeculated. This is worrisome for breast edema. In general, skin thickening from cancer should be investigated.
The axilla normally contains lymph nodes, which are smooth oval or kidney bean-shaped masses containing fatty hila on the mammogram (Fig. 2-10A). Lymph nodes that grow larger become dense, round, and lose their fatty hila; they represent lymphadenopathy and are abnormal (see Fig. 2-10B).
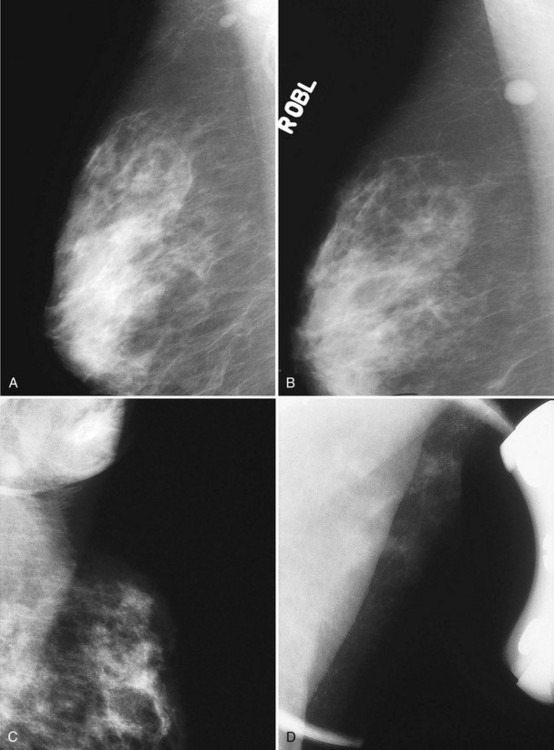
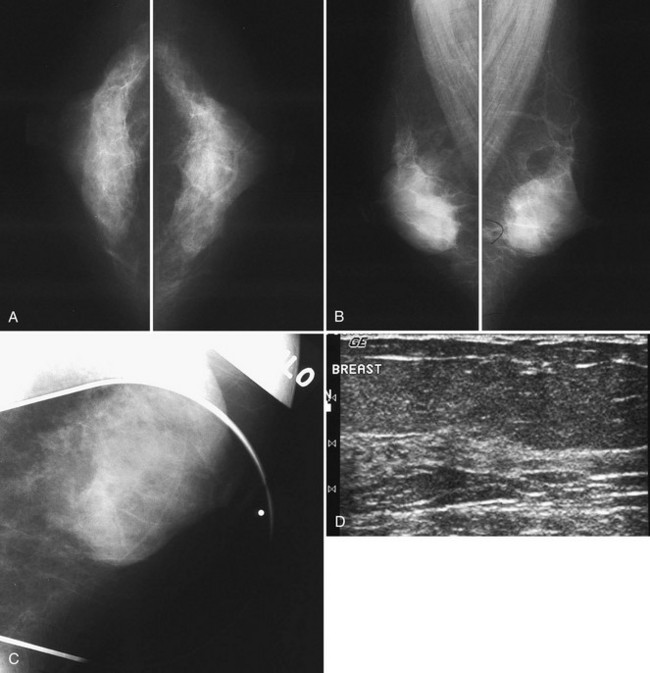
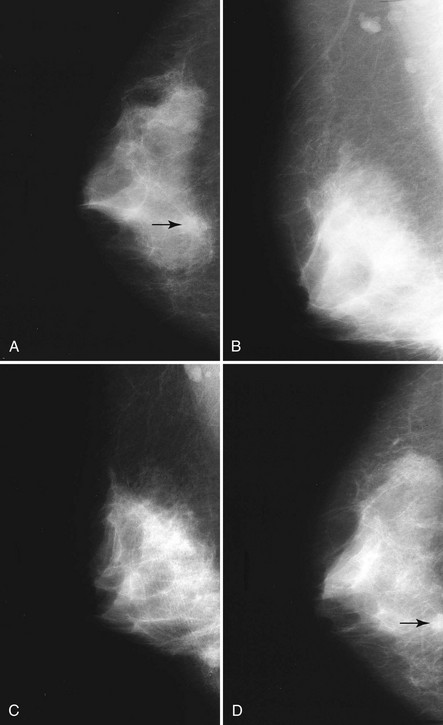
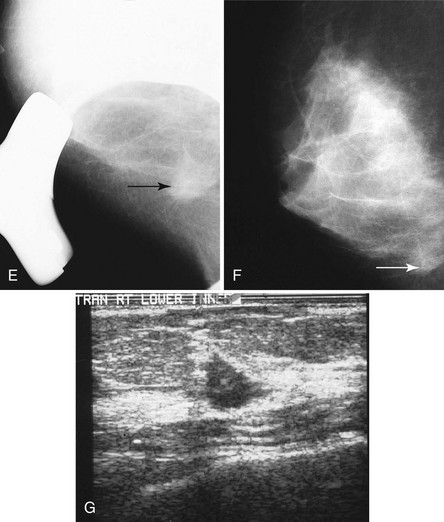
Axillary breast tissue is a normal variant and consists of breast tissue in the axilla. Axillary breast tissue develops along the normal nipple line that extends (in animals) from the axilla along the chest to the abdomen. Axillary breast tissue can be, but is rarely, attached to an extra nipple. Noncompressed axillary breast tissue can simulate a mass, but it can be separated into its normal fibroglandular components by spot compression (see Fig. 2-10C and D). Spiculated masses in the axilla can mimic normal lymph nodes or axillary breast tissue. Any masses in the axilla should be scrutinized carefully to make sure they are normal lymph nodes or axillary tissue and not cancer (see Fig. 2-10E to G).
By law (Mammography Quality Standards Act [MQSA]; P.L. 102-539), all mammograms must have a summary BI-RADS® code that indicates the radiologist’s final impression of the study. Both the BI-RADS® number and the words must be spelled out in the report (Box 2-6). Yearly, federal inspectors read mammographic reports at all U.S. facilities and check them for BI-RADS® summary codes and words. It is against U.S. federal law to exclude the BI-RADS® codes and words on mammogram repeats. Both monetary fines and jail sentences can be imposed on facilities that do not comply with MQSA.
Box 2-6 ACR BI-RADS® Code Assessment Categories
Assessment Is Complete
Category 3—Probably benign finding: short-interval follow-up suggested
Category 4—Suspicious abnormality: biopsy should be considered
Category 5—Highly suggestive of malignancy-appropriate action should be taken: almost certainly malignant
Category 6—Known biopsy-proven, malignancy-appropriate action should be taken
Diagnostic Versus Screening Mammography
There is a crucial difference between screening and diagnostic mammography. Diagnostic mammography is used for symptomatic women or for women with findings detected on screening mammography (Table 2-5). A radiologist is on-site for diagnostic mammograms to personally guide the workup by using special mammographic views or ultrasound.
| Screening |
CC, craniocaudal; MLO, mediolateral oblique.
Additional Views to Confirm or Exclude the Presence of a True Lesion
Radiologists use additional mammographic views in three common scenarios: to confirm or exclude a real lesion, to localize or triangulate a true lesion, and to characterize a true lesion (Box 2-7). A common reason to use additional views is in the setting of a “one-view-only” finding. Specifically, the radiologist sees a finding on one view that is not reinforced on the orthogonal view. Additional special views determine whether the finding is real. The first step is to estimate the finding’s location on the orthogonal view by measuring the distance from the nipple to the finding. The breast tissue is scrutinized along a radius of the same distance on the orthogonal view to identify the finding (see Fig. 2-8A). If the finding shows up on the second view, it is considered a true finding and the radiologist then uses additional views to characterize the lesion. If the finding is invisible on the second view, it may represent a true finding hidden on the second view or a fortuitous summation of normal breast tissue.
Many fine-detail mammographic views can be used to determine whether a “one-view” finding is a true lesion or a summation shadow (Box 2-8 and Tables 2-6 and 2-7).
Table 2-6 Mammographic Views Used to Visualize and Characterize Findings
| Mammographic Problem | Mammographic View |
|---|---|
| True finding versus summation | Rolled views, spot view, step oblique views; repeat the same view |
| Triangulation |
CC, craniocaudal; ML, mediolateral; MLO, mediolateral oblique; XCCL, laterally exaggerated craniocaudal; XCCM, medially exaggerated craniocaudal.
Table 2-7 Mammographic Views and Abbreviations Used to Describe Them
| View | Abbreviation |
|---|---|
| Craniocaudal | CC |
| Mediolateral oblique | MLO |
| Mediolateral | ML |
| Lateral-medial | LM |
| Laterally exaggerated craniocaudal | XCCL |
| Medially exaggerated craniocaudal | XCCM |
| Cleavage view | CV |
| Rolled view laterally | RL |
| Rolled view medially | RM |
| From below | FB |
By convention, the side (left or right) precedes the view abbreviation.
From Mammography quality control manual, Reston, VA, 1999, American College of Radiology.
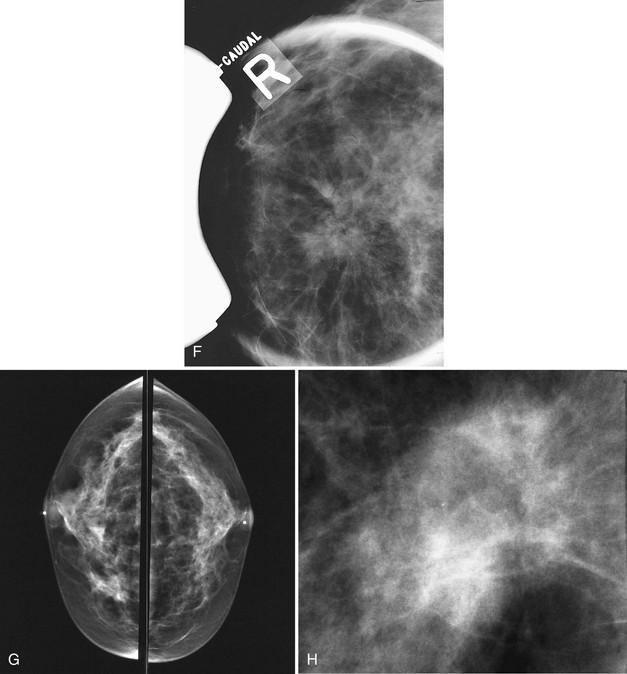
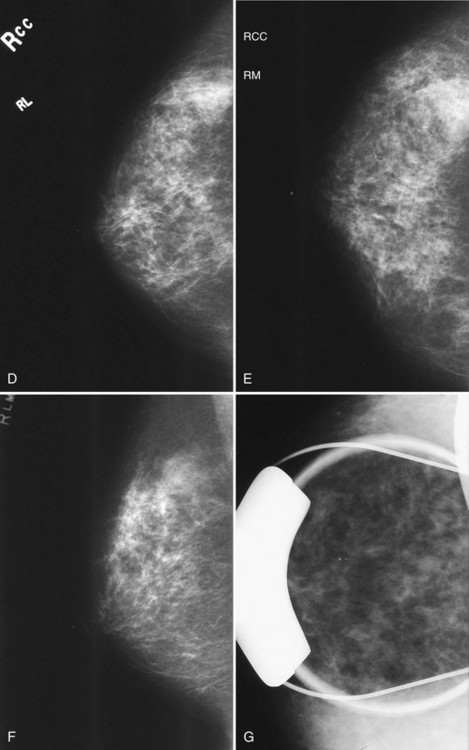
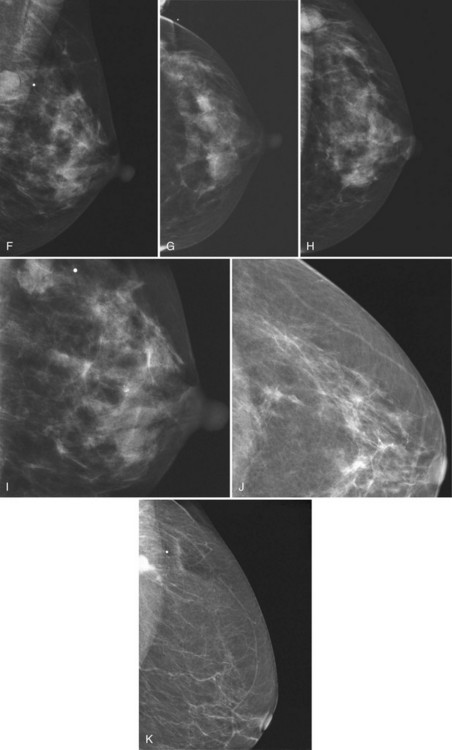
A “one-view” finding often prompts requests for “rolled views.” Rolled CC views separate normal fibroglandular elements into their individual components (see Table 2-6). The technologist “rolls” the breast tissue so that the top of the breast is rolled toward the axilla and then recompresses the breast. The bottom of the breast is now directed toward the sternum (Fig. 2-11A). This action rolls the fibroglandular components that form the “fake mass” away from each other. On the rolled view a summation shadow is separated into its normal fibroglandular components and the mass goes away (see Fig. 2-11B to G). On the other hand, true masses retain their shape and size on the rolled view.

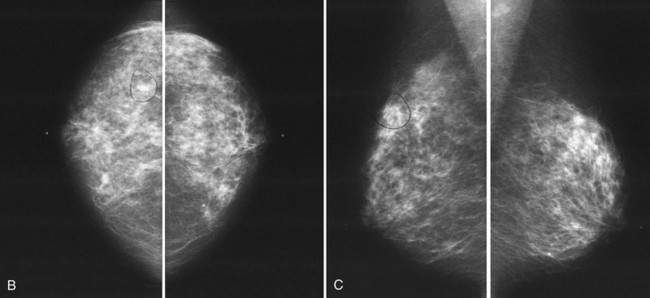
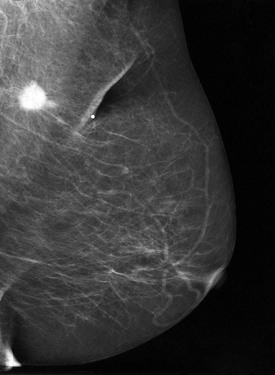
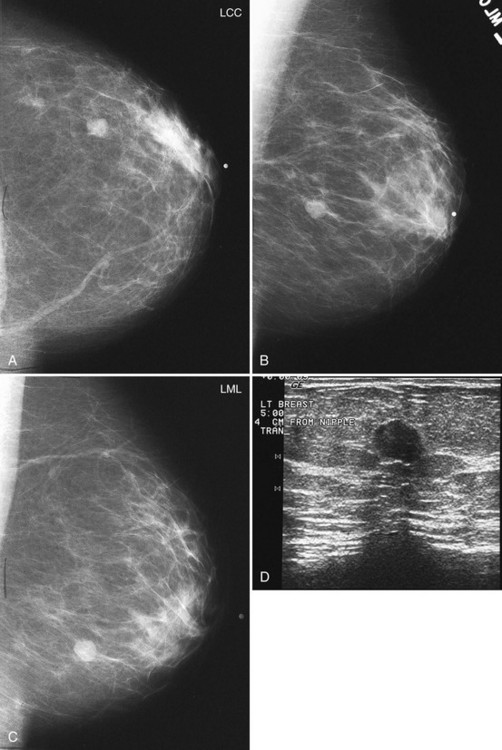
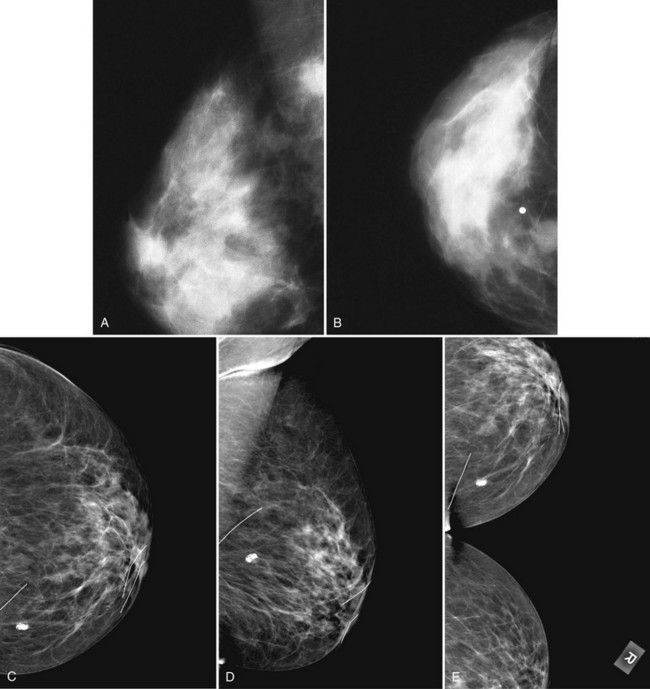
Another way to separate true masses from fake ones is to use spot compression. A small compression paddle is used to compress tightly and directly over a finding. This provides greater compression on the area of interest. If used to determine if a finding is a real mass or a superimposition, spot compression separates fake summation shadows into normal fibroglandular components. If the finding is a real mass, the mass should persist within the spot compression field of view (Figs. 2-12 and 2-13). A true mass will retain its shape, size, and density, whereas a summation shadow will disperse into its fibroglandular components. It is important to perform the spot view in the projection in which the finding is best seen or displayed against fat to increase the chance of discovering if it is real (Fig. 2-14).
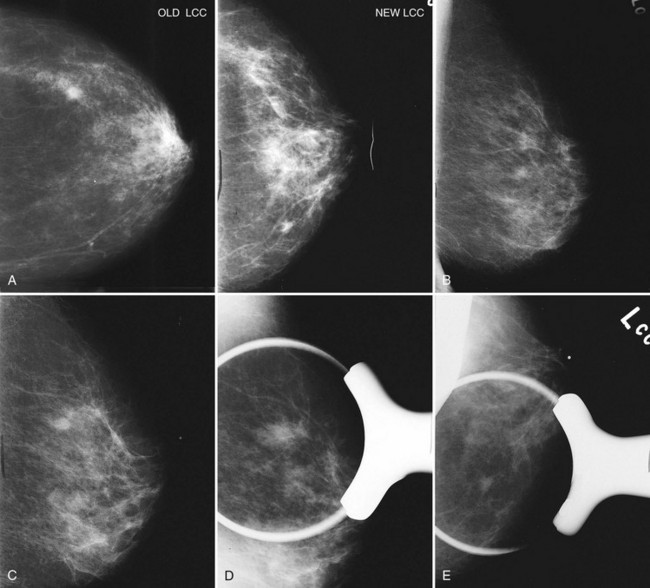
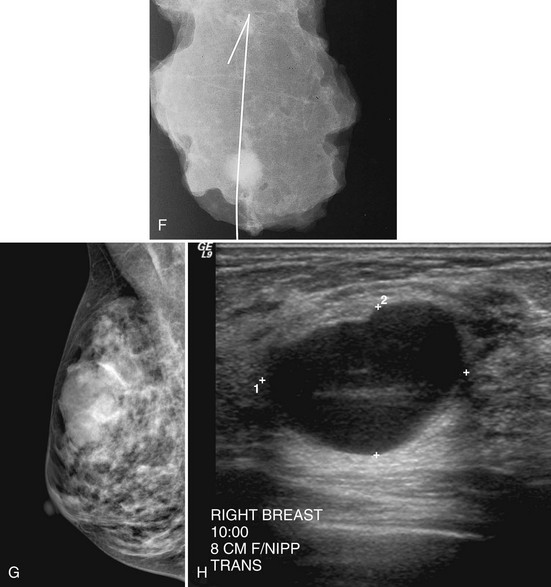
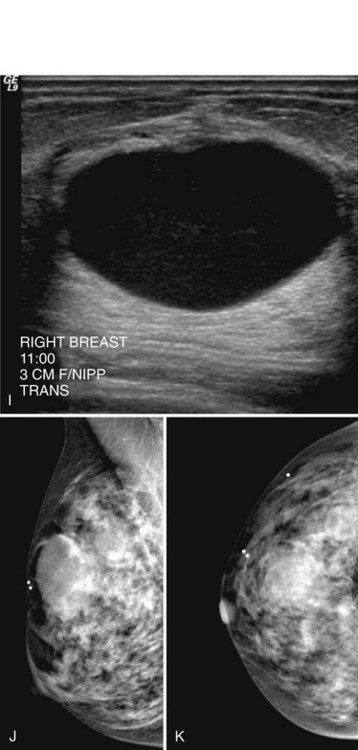
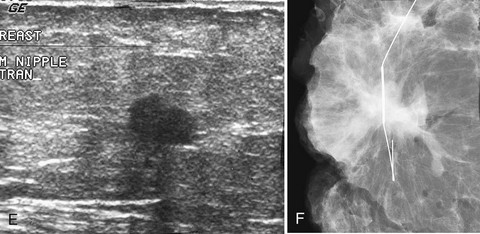
In all cases in which a mass is suspected, ultrasound provides indispensible information. The negative ultrasound confirms findings on “negative” mammograms. If the ultrasound is positive, a mass is confirmed. A repeat mammogram with a marker over the ultrasound-detected mass may show ultrasound findings that correspond to the mammographic findings and show a mass. If they do not correspond, more workup is needed (see Fig. 2-14 G to K).
Triangulation
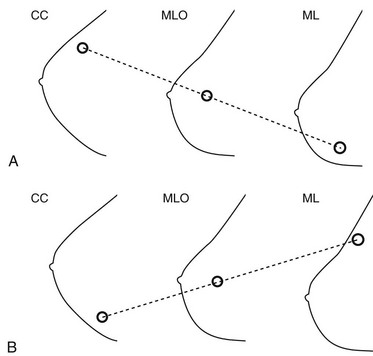
To predict a finding’s location from the CC and ML screening views, place the CC and MLO views so that the breasts face the same direction and the nipple is at the same level. An imaginary line drawn through the lesion on the CC and MLO views will predict the lesion’s location on the ML view. If CC, MLO, and ML views are available, place the MLO between the CC and ML views, with the nipple at the same level on each view (Figs. 2-15 and 2-16). An imaginary line drawn through the lesion on any two of the three views in which it is seen will predict where it will be on the third view.
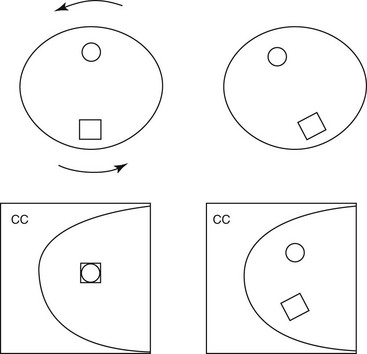
Sometimes suspicious findings are thought to be true findings but are seen only on the CC view and not on either the ML or MLO views. Rolled CC views can show if true masses are located in the upper or lower breast. One does this by comparing the rolled view with the standard CC view. The technologist does a “rolled laterally” view by rolling the top of the breast toward the axilla and the bottom of the breast medially. An upper breast mass should roll laterally with the rolled upper breast tissue. A lower breast mass should roll medially with the lower breast tissue. The radiologist looks at the “regular” CC view and sees how the finding moves on the “rolled laterally” view. If the mass moves toward the axilla, the mass must be in the upper portion of the breast. If the mass moves medially on the “rolled laterally,” the mass must be in the lower portion of the breast (Figs. 2-17 and 2-18).
Visualizing Findings in “Hard to See” Locations
Some lesions are located in the extreme outer part of the breast not included on the standard CC view. A view that sees more of the outer breast is the CC view exaggerated laterally (XCCL). The technologist obtains an XCCL by modifying a standard CC view. She rotates the patient’s body to display more outer breast tissue than is seen on a standard CC view and excludes the medial portion of the breast (Fig. 2-19). This projection sees more outer breast, but doesn’t see the inner breast (Fig. 2-20).
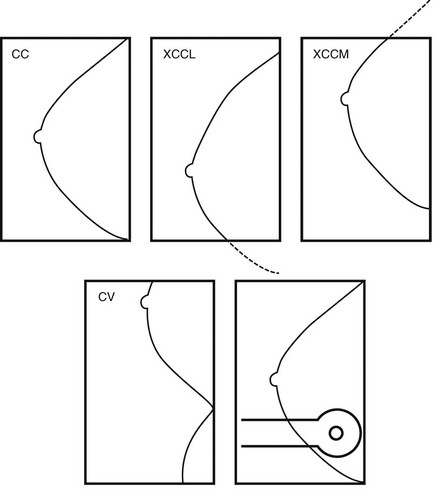
The Cleopatra view also includes more outer breast tissue. In this view, the patient rotates laterally, as in the XCCL, but also leans obliquely like Cleopatra reclining on a bed of pillows (see Fig. 2-20E). The Cleopatra view includes much more of the outer part of the breast while excluding inner breast tissue. But unlike the XCCL, which is taken with the patient standing straight up, the Cleopatra view is taken with the patient leaning slightly backward and oblique.
For inner breast lesions, CC views exaggerated medially (XCCM) image the medial portion of the breast while excluding the outer breast tissue (Fig. 2-21A and B). Another view that visualizes the inner breast is the cleavage view (CV), or valley view, which includes the medial portions of both breasts on the image receptor in a modified CC projection. Such views allow visualization of even more of the inner part of the breast than is seen on standard CC views, but also images some of the opposite inner breast (see Fig 2-21C to E).
Some lesions in the upper part of the breast are so far back against the chest wall that they can be pushed out of the field of view by the compression paddle (Fig. 2-22). This problem can be solved by the from-below (FB) or caudal-cranial view. For this view, the image receptor is placed on the upper part of the breast. The breast is then compressed from below, excluding the lower part of the breast but including tissue high on the chest wall. In another approach for imaging lesions high on the chest wall, the image receptor is placed on the midportion of the breast with the lower portion excluded; this approach, first described by Sickles and colleagues, incorporates more of the upper portion of the breast because the compression paddle does not have to include lower breast tissue in the field of view.
Another area that is hard to see is the region immediately behind the nipple, which can be hidden by adjacent blood vessels and ducts. Spot compression compresses normal ducts, blood vessels, and tissue while pulling the nipple into profile (Fig. 2-23A and B). The nipple should be in profile on at least one view to see the retroareolar region; otherwise, the nipple may hide a cancer.
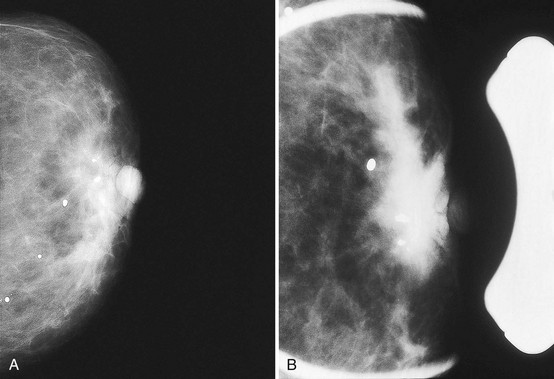
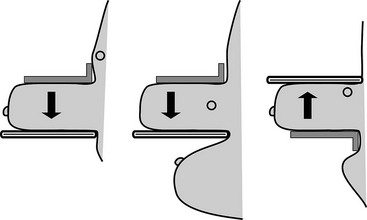
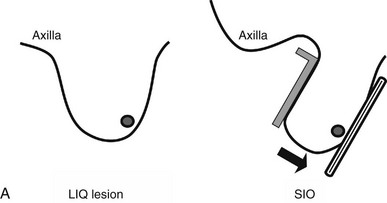
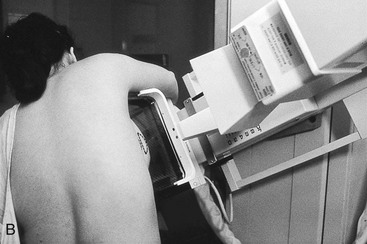
Lesions in the lower inner part of the breast are very hard to see. A superior-inferior oblique (SIO), or reverse oblique, view visualizes the lower inner breast. In this view, the technologist places the imaging receptor on the medial part of the breast and the compression plate on the superior breast while the patient leans over the imaging receptor (Fig. 2-24A and B). The compression paddle approaches the breast from the superior axillary side, allowing more of the inner breast tissue to be visualized.
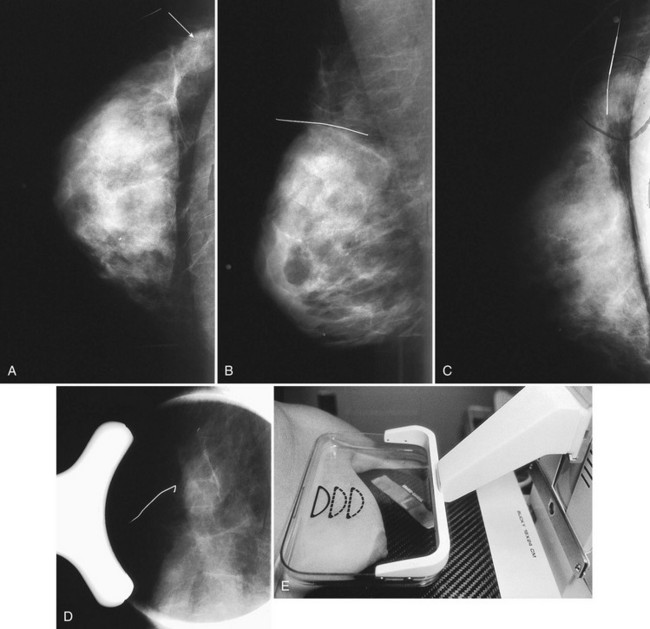
Palpable findings imaged near the periphery of the breast are seen better with spot compression. This type of spot compression tangential to the palpable finding can push the mass against subcutaneous fat, allowing it to be seen. Spot compression directly over the palpable mass, previously known as a lumpogram, also can show masses by compressing the surrounding glandular tissue away from the suspicious finding (Fig. 2-25).
Additional Views to Characterize True Findings
After the radiologist determines that a mass or cluster of calcifications is a true finding and triangulates its position within the breast, additional mammographic views are used to characterize the finding (Box 2-9). Microfocal spot air-gap magnification views of clustered calcifications sharpen and separate calcification forms and display calcifications not detected on nonmagnified studies. Magnification can also depict mass shapes and margins to greater advantage, showing spiculated or irregular margins not discernible at lower resolutions (Fig. 2-26). Spot compression magnification views not only provide greater visualization of the region of interest by pushing fibroglandular tissue away from the finding, but also produce higher resolution of mass margins and calcification shapes. Thus, spot compression magnification mammograms are a mainstay of the radiologist’s diagnostic tools to characterize both masses and calcifications.
Key Elements
Breast cancer screening in women invited to undergo mammography decreases breast cancer mortality by about 30%.
Risk factors for breast cancer include age older than 50 years, personal history of or first-degree relative with breast cancer, nulliparous status, early menarche, late menopause, first birth after age 30, radiation treatment, atypical ductal hyperplasia, lobular carcinoma in situ, and presence of BRCA1 or BRCA2 breast cancer susceptibility genes.
Seventy percent of women who have breast cancer have no risk factors other than being female and being older than age 50.
Signs and symptoms of breast cancer include a breast lump, bloody or new spontaneous nipple discharge, new nipple or skin retraction, peau d’orange, and symptoms from metastasis.
Signs of breast cancer on mammography include a spiculated mass, pleomorphic calcifications, a round mass, architectural distortion, a developing density, an asymmetric density, a single dilated duct, lymphadenopathy, and breast edema; in some patients, no mammographic signs are present (occult cancer).
A normal mammogram is dense in young women and becomes darker over time as the dense tissue is replaced by fat.
Increasing breast density may be due to pregnancy or hormone replacement therapy.
Unexplained increasing breast density should prompt a workup to exclude breast edema or cancer.
Evaluation of a normal mammogram includes routine inspection for fibroglandular symmetry and examination of the periglandular edges, the skin, retroareolar region and nipple, retroglandular fat, medial part of the breast, chest wall, and axilla.
Normal asymmetric glandular tissue occurs in 3% of women and looks like an asymmetry of normal glandular tissue without a palpable mass, suspicious calcifications or spiculations, a three-dimensional mass, or new findings.
Be alert for findings in the medial part of the breast; the normal sternalis muscle variant is the one normal finding in the medial breast.
To detect developing densities, change, or asymmetries, view films back to back and compare them with old films.
Review both the breast history and the technologist’s physical sheet before interpretation of the mammogram to know where previous biopsies were, the meaning of skin markers, and to be aware of patient complaints.
From 10% to 15% of women with breast cancer have normal mammograms.
The skin should normally be 2 to 3 mm thick. Skin thicker than 2 to 3 mm might be breast edema or scarring.
Special mammographic views confirm or exclude questionable findings seen on screening mammography, characterize true lesions, and triangulate the location of a lesion.
Rolled views, compression views, and step oblique views distinguish true lesions from summation shadows.
Magnification spot compression views characterize mass margins and shapes, and see calcification numbers, shapes, and forms better.
Air-gap magnification views resolve the shape and number of calcifications better than standard mammograms.
Laterally exaggerated CC and Cleopatra views display the outer part of the breast.
Medially exaggerated CC and cleavage views display the inner portion of the breast.
“From-below” and upper breast views display the upper part of the breast.
Spot compression and nipple-in-profile images view the nipple and retroareolar region.
Superior-inferior oblique views (reverse oblique) display the lower inner portion of the breast.
The breast location most often excluded by screening mammograms is the upper inner quadrant.
Lesions displayed at the nipple level on the MLO view may be in the upper, lower, or midportion of the breast on the ML view.
Triangulation with the CC and MLO views can be used to predict the location of the lesion on the lateral view.
American College of Radiology. ACR BI-RADS®—Mammography. ACR Breast Imaging Reporting and Data System, Breast Imaging Atlas, ed 4. Reston, VA: American College of Radiology. 2003.
Andersson I, Janzon L. Reduced breast cancer mortality in women under age 50: Updated results from the Malmö Mammographic Screening Program. J Natl Cancer Inst Monogr. 1997;22:63-67.
Beyer T, Moonka R. Normal mammography and ultrasonography in the setting of palpable breast cancer. Am J Surg. 2003;185:416-419.
Birdwell RL, Bandodkar P, Ikeda DM. Computer-aided detection with screening mammography in a university hospital setting. Radiology. 2005;236(2):451-457.
Birdwell RL, Ikeda DM, O’Shaughnessy KF, Sickles EA. Mammographic characteristics of 115 missed cancers later detected with screening mammography and the potential utility of computer-aided detection. Radiology. 2001;219:192-202.
Bjurstam N, Bjorneld L, Duffy SW, et al. The Gothenburg breast screening trial: First results on mortality, incidence, and mode of detection for women ages 39–49 years at randomization. Cancer. 1997;80:2091-2099.
Boyd NF, Guo H, Martin LJ, et al. Mammographic density and the risk and detection of breast cancer. NEJM. 2007;356(3):227-238.
Boyd NF, Martin LJ, Rommens JM, et al. Mammographic density: A heritable risk factor for breast cancer. Methods Mol Biol. 2009;472:343-360.
Bradley FM, Hoover HCJr, Hulka CA, et al. The sternalis muscle: An unusual normal finding seen on mammography. AJR Am J Roentgenol. 1996;166:33-36.
Brenner RJ, Sickles EA. Acceptability of periodic follow-up as an alternative to biopsy for mammographically detected lesions interpreted as probably benign. Radiology. 1989;171:645-646.
Claus EB, Risch N, Thompson WD. Genetic analysis of breast cancer in the cancer and steroid hormone study. Am J Hum Genet. 1991;48:232-242.
Claus EB, Risch N, Thompson WD. Autosomal dominant inheritance of early-onset breast cancer. Implications for risk prediction. Cancer. 1994;73:643-651.
Colditz GA, Egan KM, Stampfer MJ. Hormone replacement therapy and risk of breast cancer: Results from epidemiologic studies. Am J Obstet Gynecol. 1993;168:1473-1480.
Colditz GA, Willett WC, Hunter DJ, et al. Family history, age, and risk of breast cancer. Prospective data from the Nurses’ Health Study. JAMA. 1993;270:338-343.
Cook KL, Adler DD, Lichter AS, et al. Breast carcinoma in young women previously treated for Hodgkin disease. AJR Am J Roentgenol. 1990;155:39-42.
Faulk RM, Sickles EA. Efficacy of spot compression-magnification and tangential views in mammographic evaluation of palpable breast masses. Radiology. 1992;185:87-90.
Gail MH, Brinton LA, Byar DP, et al. Projecting individualized probabilities of developing breast cancer for white females who are being examined annually. J Natl Cancer Inst. 1989;81:1879-1886.
Goergen SK, Evans J, Cohen GP, MacMillan JH. Characteristics of breast carcinomas missed by screening radiologists. Radiology. 1997;204:131-135.
Gunhan-Bilgen I, Bozkaya H, Ustun EE, Memis A. Male breast disease: Clinical, mammographic, and ultrasonographic features. Eur J Radiol. 2002;43:246-255.
Hartge P, Struewing JP, Wacholder S, et al. The prevalence of common BRCA1 and BRCA2 mutations among Ashkenazi Jews. Am J Hum Genet. 1999;64:963-970.
Homer MJ. Proper placement of a metallic marker on an area of concern in the breast. AJR Am J Roentgenol. 1996;167:390-391.
Homer MJ, Smith TJ. Asymmetric breast tissue. Radiology. 1989;173:577-578.
Ikeda DM, Andersson I, Wattsgard C, et al. Interval carcinomas in the Malmö Mammographic Screening Trial: Radiographic appearance and prognostic considerations. AJR Am J Roentgenol. 1992;159:287-294.
Ikeda DM, Birdwell RL, O’Shaughnessy KF, et al. Analysis of 172 subtle findings on prior normal mammograms in women with breast cancer detected at follow-up screening. Radiology. 2003;226(2):494-503.
Jonsson H, Bordas P, Wallin H, et al. Service screening with mammography in Northern Sweden: Effects on breast cancer mortality—an update. J Med Screen. 2007;14(2):87-93.
Kopans DB. Negative mammographic and US findings do not help exclude breast cancer. Radiology. 2002;222:857-859.
Kopans DB, Swann CA, White G, et al. Asymmetric breast tissue. Radiology. 1989;171:639-643.
Larsson LG, Andersson I, Bjurstam N, et al. Updated overview of the Swedish Randomized Trials on Breast Cancer Screening with Mammography: Age group 40–49 at randomization. J Natl Cancer Inst Monogr. 1997;22:57-61.
Li Y, Baer D, Friedman GD, et al. Wine, liquor, beer and risk of breast cancer in a large population. Eur J Cancer. 2009;45(5):843-850.
Logan WW, Janus J. Use of special mammographic views to maximize radiographic information. Radiol Clin North Am. 1987;25:953-959.
Lynch HT, Watson P, Conway T, et al. Breast cancer family history as a risk factor for early onset breast cancer. Breast Cancer Res Treat. 1988;11:263-267.
Miki Y, Swensen J, Shattuck-Eidens D, et al. A strong candidate for the breast and ovarian cancer susceptibility gene BRCA1. Science. 1994;266:66-71.
Nystrom L, Andersson I, Bjurstam N, et al. Long-term effects of mammography screening: Updated overview of the Swedish randomised trials. Lancet. 2002;359:909-919.
Park JM, Franken EAJr. Triangulation of breast lesions: Review and clinical applications. Curr Probl Diagn Radiol. 2008;37(1):1-14.
Pearson KL, Sickles EA, Frankel SD, Leung JW. Efficacy of step-oblique mammography for confirmation and localization of densities seen on only one standard mammographic view. AJR Am J Roentgenol. 2000;174:745-752.
Ries LAG, Melbert D, Krapcho M, et al, editors. SEER Cancer Statistics Review 1975–2005. Bethesda, MD: National Cancer Institute. 2008. http://seer.cancer.gov/csr/1975_2005/. based on November 2007 SEER data submission, posted to the SEER Web site (accessed April 12, 2010)
Rosen EL, Sickles E, Keating D. Ability of mammography to reveal nonpalpable breast cancer in women with palpable breast masses. AJR Am J Roentgenol. 1999;172:309-312.
Saslow D, Boetes C, Berke W, et al. American Cancer Society guidelines for breast screening with MRI as an adjunct to mammography. CA Cancer J Clin. 2007;57(2):75-89.
Schmidt ME, Steindorf K, Mutschelknauss E, et al. Physical activity and postmenopausal breast cancer: Effect modification by breast cancer subtypes and effective periods in life. Cancer Epidemiol Biomarkers Prev. 2008;17(12):3402-3410.
Schubert EL, Mefford HC, Dann JL, et al. BRCA1 and BRCA2 mutations in Ashkenazi Jewish families with breast and ovarian cancer. Genet Test. 1997;1:41-46.
Shapiro S, Venet W, Strax P, et al. Ten- to fourteen-year effect of screening on breast cancer mortality. J Natl Cancer Inst. 1982;69:349-355.
Sickles EA. Mammographic features of 300 consecutive nonpalpable breast cancers. AJR Am J Roentgenol. 1986;146:661-663.
Sickles EA. Practical solutions to common mammographic problems: Tailoring the examination. AJR Am J Roentgenol. 1988;151:31-39.
Sickles EA. Periodic mammographic follow-up of probably benign lesions: Results in 3,184 consecutive cases. Radiology. 1991;179:463-468.
Silvera SA, Jain M, Howe GR, et al. Energy balance and breast cancer risk: A prospective cohort study. Breast Cancer Res Treat. 2006;97(1):97-106.
Smith RA, Cokkinides V, Eyre HJ. American Cancer Society guidelines for the early detection of cancer, 2003. CA Cancer J Clin. 2003;53:27-43.
Smith RA, Saslow D, Sawyer KA, et al. American Cancer Society guidelines for breast cancer screening: Update 2003. CA Cancer J Clin. 2003;53:141-169.
Tabar L, Vitak B, Chen HH, et al. The Swedish Two-County Trial 20 years later. Updated mortality results and new insights from long-term follow-up. Radiol Clin North Am. 2000;38:625-651.
Tabar L, Yen MF, Vitak B, et al. Mammography service screening and mortality in breast cancer patients: 20-year follow-up before and after introduction of screening. Lancet. 2003;361:1405-1410.
Warren Burhenne LJ, Wood SA, D’Orsi CJ, et al. Potential contribution of computer-aided detection to the sensitivity of screening mammography. Radiology. 2000;215:554-562.
Wolverton DE, Sickles EA. Clinical outcome of doubtful mammographic findings. AJR Am J Roentgenol. 1996;167:1041-1045.
Wooster R, Neuhausen SL, Mangion J, et al. Localization of a breast cancer susceptibility gene, BRCA2, to chromosome 13q12-13. Science. 1994;265:2088-2090.
2-1. List findings for cancer and their differential diagnoses.
| MAMMOGRAPHIC FINDINGS OF CANCER | DIFFERENTIAL DIAGNOSIS |
|---|---|
| 1. _____________________________ | 1. __________________________________________________________ |
| 2. _____________________________ | 2. __________________________________________________________ |
| 3. _____________________________ | 3. __________________________________________________________ |
| 4. _____________________________ | 4. __________________________________________________________ |
| 5. _____________________________ | 5. __________________________________________________________ |
| 6. _____________________________ | 6. __________________________________________________________ |
| 7. _____________________________ | 7. __________________________________________________________ |
| 8. _____________________________ | 8. __________________________________________________________ |
| 9. _____________________________ | 9. __________________________________________________________ |
| 10. _____________________________ | 10. __________________________________________________________ |
| 11. _____________________________ | 11. __________________________________________________________ |