Magnetic Resonance Spectroscopy and Positron Emission Tomography
Most clinical magnetic resonance (MR) scanners now allow the addition of the magnetic resonance spectroscopy (MRS) modality, which can be used to assess cellular metabolism noninvasively and is the most accessible method for studying and monitoring neurometabolic disorders in patients (Table 25-1). The most important MRS method, proton or hydrogen (1H) spectroscopy, is approved by the Food and Drug Administration (FDA) for general use in the United States and can be ordered by clinicians for their patients, if indicated. For the brain in particular, it has been proved that MRS provides additional clinically relevant information for several disease processes such as brain tumors, metabolic disorders, and systemic diseases.
Theoretical Background of Magnetic Resonance Spectroscopy
The signal used by magnetic resonance imaging (MRI) to create anatomic maps is generated primarily by the hydrogen nuclei, also known as protons (1H), of water molecules (H2O). In contrast, 1H MRS analyzes the signal of protons attached to other molecules. Whereas for MRI only a single peak (water) is being mapped, the output of MRS is a collection of peaks at different radiofrequencies representing proton nuclei in different chemical environments, that is, the spectrum (Fig. 25-1 and Table 25-2). MRS can measure a variety of metabolites. Typical MR spectra of normal occipital gray matter is shown in Figure 25-1. The x axis, or chemical shift axis, is a measure of the frequency shift of a proton relative to a universally fixed reference substance (tetramethylsilane at 0 ppm). In spectra in vivo, the protons of water (usually not shown) resonate at 4.7 parts per million (ppm). The ppm scale has been selected instead of Hertz (Hz = sec−1) because it is independent of the magnetic field strength. The y axis is a measure of the signal intensity, which is proportional to the concentration of a chemical.
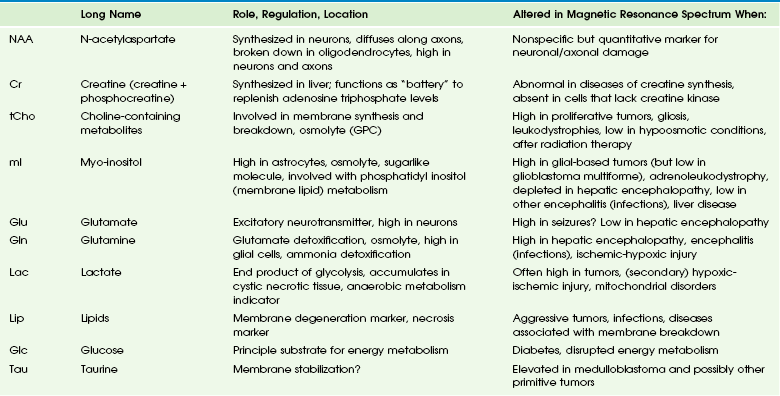
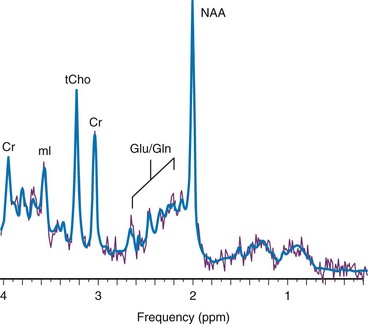
Figure 25-1 1H spectra of occipital gray matter acquired in a control subject.
Magnetic resonance imaging uses the signal provided by the protons of the water to generate an anatomic map of the brain. In contrast, 1H magnetic resonance spectroscopy uses the signal from the protons of chemicals to generate a biochemical fingerprint of a “region of interest.” Spectra were acquired using a point resolved spectroscopy sequence with echo time of 35 ms. NAA, N-acetylaspartate; Cr, creatine; tCho, choline containing metabolites; mI, myo-inositol; Glu, glutamate; Gln, glutamine; ppm, parts per million.
Main Metabolites of the in Vivo Proton Spectrum
The most prominent peak of the 1H spectrum is the resonance at 2.0 ppm from three equivalent protons of the acetyl group of the N-acetylaspartate (NAA) molecule (see Fig. 25-1). The role of NAA and its regulation in vivo are not well understood. In the normal brain, NAA is synthesized in neurons, diffuses along axons, and is broken down in oligodendrocytes. NAA is present in high concentrations only in normal neurons and axons,1,2 and from an MRS perspective, it is a marker for adult type “healthy” neurons and axons. Proton spectra of any disease that is associated with neuronal or axonal loss will exhibit a reduction of NAA. Brain NAA increases rapidly as the brain matures, peaks at ≈10 to 15 years, and then decreases slightly over time as the number of neurons and axons declines even in the normal brain.3
Myo-Inositol
tCho, Cr, and NAA can be detected readily and quantified in long echo time (TE) MRS. Short TE acquisition methods are necessary for reliable quantitation of myo-inositol (mI), which is a little-known sugarlike molecule that resonates at 3.6 ppm in the proton spectrum. It has been identified as a marker for astrocytes and is an osmolyte.4,5 mI also is involved in the metabolism of phosphatidyl inositol, a membrane phospholipid. Similar to choline, mI is altered in response to alteration of membrane metabolism or membrane damage. Both tCho and mI are high in the newborn brain but decrease rapidly to normal levels within the first 12 to 24 months after birth.
Lactate
Lactate is an important metabolite because it indicates anaerobic metabolism. Although lactate can be detected at pathologically elevated concentrations, in healthy tissue the lactate concentration is too low for routine detection with currently available methods. Lactate is the product of anaerobic glycolysis and increases when subsequent oxidation of lactate in the tricarboxylic acid cycle is impaired (for example, by lack of oxygen or mitochondrial disorders). Lactate also can increase in necrotic tissue and cysts. An elevation of lactate in “normal” appearing tissue would indicate global disruption or impairment of perfusion consistent with hypoxia and eventual poor outcome.6–10
Magnetic Resonance Spectroscopy Methods
Localized Single-Voxel Spectroscopy
Single-voxel MRS measures the MR signal of a single selected region of interest, whereas signal outside this area is suppressed. For single-voxel MRS, the magnetic field and other parameters are optimized to get the best possible spectrum from a relatively small region of the brain. Manufacturers generally provide point-resolved spectroscopy,11,12 stimulated echo acquisition mode,13 and image-selected in vivo spectroscopy.14 These sequences differ in how radiofrequency pulses and so-called gradient pulses are arranged to achieve localization. It is beyond the scope of this review to discuss details about localization methods; the interested reader is referred to the aforementioned publications.
2-Dimensional or 3-Dimensional Chemical Shift Imaging
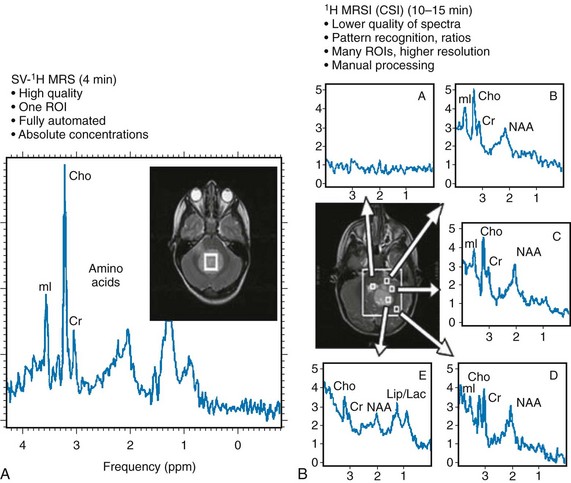
With chemical shift imaging (CSI) approaches, multiple spatially arrayed spectra (typically more than 100 spectra per slice) from slices or volumes are acquired simultaneously. Slice selection can be achieved with a selective radiofrequency pulse, as for MRI (Fig. 25-2). When it is desired that the region of interest be limited to a smaller volume, for example, to avoid bone and fat from the skull, CSI is usually combined with point-resolved spectroscopy, stimulated echo acquisition mode, or image-selected in vivo spectroscopy, but with a significantly larger volume selected than for single-voxel MRS. CSI is a very efficient method for acquiring information from different parts of the brain. An important feature is that within the examined volume of interest, any region of interest can be selected retrospectively by a process termed voxel shifting.
Clinical Applications
Neonatal Hypoxic-Ischemic Encephalopathy
In neonates with hypotensive injury, acute injury can be detected by MRS even when both diffusion imaging and conventional imaging are negative.15–26 Within the first 24 hours of injury, MRS can detect elevated lactate levels in the cerebral cortex or basal ganglia, depending on the pattern of injury. Reduced NAA and elevated glutamate/glutamine levels usually are detected after 24 hours. NAA and lactate can be detected using either short echo (35 ms) or long echo (144 or 288 ms) time. MI, glutamate/glutamine, and lipids can be detected only during use of the short echo technique (Fig. 25-3). The lactate/NAA peak ratio, measured in deep gray matter, is an accurate prognosticator for neonatal hypoxic-ischemic encephalopathy,27–36 whereas diffusion imaging can be limited by pseudonormalization of apparent diffusion coefficient in neonates.37
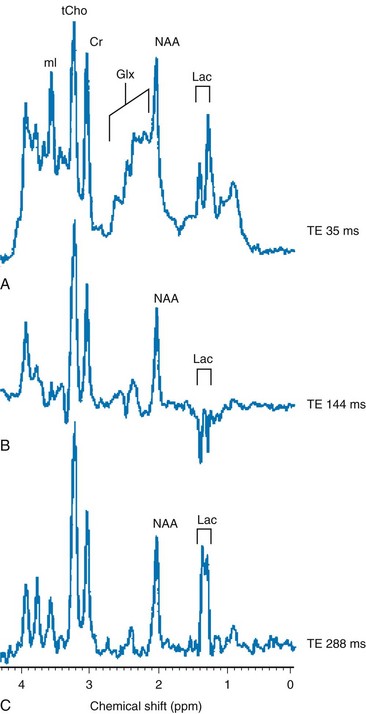
Figure 25-3 Comparison of magnetic resonance spectroscopy (MRS) of neonatal hypoxic-ishemic encephalopathy (acquired at multiple echo times [TEs]) with neonatal metabolic disease.
A-C show single-voxel MRS at three different echo times in the basal ganglia of a hypoxic-ischemic term infant. Note the characteristic modulation of lactate (Lac). A, A spectrum acquired using short TE (35 ms), which shows a myo-inositol (mI) peak (left side of the spectrum), an elevated glutamine/glutamine (Glx) peak next to a reduced N-acetylaspartate (NAA) peak (middle spectrum), and an elevated lactate doublet next to a lipid peak (right side of the spectrum). B, A spectrum acquired using long TE (144 ms) that shows a lactate doublet peak inverted and reduced NAA, but nonvisualization of myo-inositol, glutamate, and lipids. C, A spectrum acquired using longer TE (244 ms) that is similar to 144 ms, except that the lactate doublet reverts to the other side of the spectrum.
Metabolic Diseases and White Matter Disorders
Readers are referred to an extensive review of the role of MRS in metabolic disease and white matter disease by Cecil and Kos.38 Inborn errors of metabolism can present in the neonatal period. Leukoencephalopathies, which include a broad spectrum of inherited and acquired diseases that affect white matter, are associated with genetic enzyme defects that can lead to dysfunction and breakdown of myelin. These disease processes tend to present in infancy or childhood.
Metabolic disease may be classified as acquired metabolic disorders or inborn errors of metabolism. Some examples of acquired metabolic disorders include hyperbilirubinemia and hypoglycemia, both of which may result in brain injury. Inborn errors of metabolism can be classified broadly into organic acidemias, disorders of amino acid oxidation, disorders of fatty acid oxidation, primary lactic acidosis, mitochondria function, lysosomal storage disorders, and peroxisomal disorders.39–42
Some examples of organic acid disorders include methylmalonic acidemia and propionic aciduria. In these disorders, enzymatic defects occur in the conversion of valine, isoleucine, threonine, and methionine to propionic acid, succinic acid, and methylmalonic acid. Conventional MR findings include abnormal signal change corresponding to edema in both myelinated and unmyelinated structures. The edema in the myelinated structures is characterized by a vacuolating (or spongiform) myelinopathy, which can be seen in both amino acid and organic acid disorders. In vacuolating myelinopathy, water is trapped within vacuoles that can be found within the myelin sheath layers, resulting in restricted diffusion of water. MRS of these organic acid disorders detects reduction in mI and NAA levels and elevation of glutamine and lactate levels as a result of hyperammonia, ketoacidosis, and mitochondrial dysfunction.39–43
The classic phenotype of maple syrup urine disease is a disturbance in the metabolism of the essential amino acids leucine, isoleucine, and valine. Symptoms occur by the first week of life and include seizures, vomiting and dystonia, fluctuating ophthalmoplegia, and coma. Conventional MR findings include abnormal edema in the deep cerebellar white matter, brainstem tegmentum, posterior limb of the internal capsule, perirolandic white matter, and pre- and postcentral gyrus. The accumulation of abnormal branched-chain amino acids and branched-chain α-keto acids results in a peak at 0.9 ppm. Both the changes detected by diffusion imaging and MRS may normalize after treatment is started.44,45
Urea cycle defects are characterized by a total of five disorders that involve different defects in the biosynthesis of enzymes of the urea cycle, including ornithine carbamyl transferase deficiency, carbamyl phosphate synthetase deficiency, argininosuccinic aciduria, citrullinemia, and hyperargininemia.46,47 In patients with these disorders, MRS can detect elevated glutamine levels resulting from hyperammonemia, which can be reversed with treatment.
Mitochondrial disorders are caused by defects of intracellular energy metabolism and result in decreased ATP production.48–50 Leigh disease is a multisystem disorder in which the defect may be at different enzymatic mitochondrial levels, including the pyruvate dehydrogenase complex, cytochrome c oxidase, or ATP synthase. Conventional and diffusion imaging show abnormalities in signal intensity and mean diffusivity in the brainstem (pons, periaqueductal gray, substantia nigra, and medulla), the subthalamic nucleus, and the globus pallidus. MRS is used to detect lactate in these disorders. It should be noted, however, that an elevated lactate level is not specific for a mitochondrial disorder. Similarly, failure to detect lactate does not exclude the possibility of a mitochondrial abnormality.
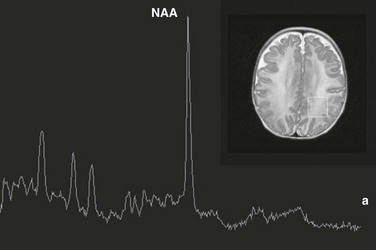
Leukoencephalopathies can be classified in multiple ways, including (1) involvement of the primary cellular organelle; (2) biochemistry; and (3) location of primary involvement (periventricular, subcortical, white matter only, and gray and white matter). The MRS correlate of these white-matter disorders have been reviewed extensively by Cecil and Kos.38 One of the most exclusive pathognomonic MRS diagnoses is that of Canavan disease. Canavan disease is an autosomal-recessive disorder arising from a deficiency of the enzyme aspartoacyclase (a cytosolic enzyme found in oligodendrocytes51) that results in an accumulation of NAA in the brain. MRS shows marked elevation of the NAA peak (Fig. 25-4).
Pediatric Brain Tumors
Approximately 60% of all pediatric tumors arise from the posterior fossa. In most cases these tumors are grade IV medulloblastoma, grade I pilocytic astrocytoma, or (less frequently) grade II or III ependymoma. Occasionally, a cystic/necrotic medulloblastoma may have imaging characteristics that overlap with posterior fossa pilocytic astrocytoma (Fig. 25-5). Proton spectroscopy and diffusion imaging appear to be particularly useful for diagnoses. Taurine (Tau) elevation has been observed consistently by several groups in persons with a medulloblastoma52–55 and is an important differentiator of medulloblastoma from other tumors of the posterior fossa. A possible caveat is that in our institution we have observed that taurine levels are low in some desmoplastic nodular medulloblastoma variants. Medulloblastomas also have higher levels of choline than other posterior fossa tumors.56,57 The hallmark of pilocytic astrocytomas is very low Cr concentrations, low mI, and low tCho concentrations, consistent with their low cellularity. Lipids also are low in pilocytic astrocytomas, but mean lactate levels are higher than in other tumors. Ependymomas have higher mI levels than do medulloblastomas or pilocytic astrocytomas; their choline levels are variable but generally fall between that of medulloblastomas and pilocytic astrocytomas.
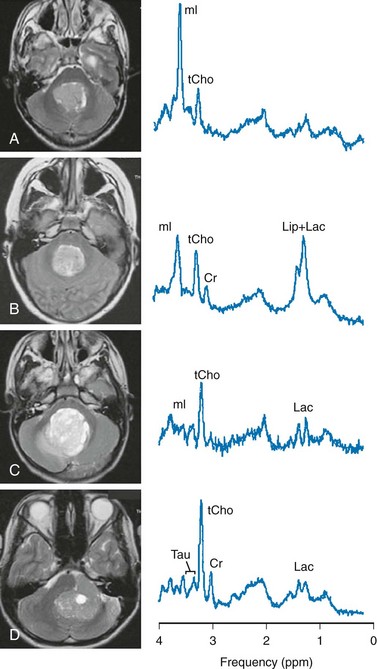
Figure 25-5 T2-weighted magnetic resonance (MR) images and MR spectra of posterior fossa tumors.
A, Choroid plexus papilloma. B, Ependymoma (grade II). C, Pilocytic astrocytoma. D, Classic medulloblastoma. All spectra were acquired from lesions with no partial volume of surrounding tissue using a single-voxel point resolved spectroscopy sequence with a short echo time of 35 ms. Shown are the original unfiltered spectra (thin line) and the LCModel fits to the data (thick line) (Stephen Provencher Inc., version 6.1-G4). In all four cases presented, MR spectroscopy provided clues to the correct diagnosis, which was different from the impression of the routine anatomic MR image. Cr, Creatine; Lac, lactate; Lip, lipid; mI, myo-inositol; tCho, total choline; Tau, taurine.
Treatment Response
Conventional imaging does not reliably distinguish between recurrent/residual disease and postoperative changes or necrosis after radiation. Postradiation changes sometimes occur many months after therapy, and the correct diagnosis is a major challenge for the optimum management of pediatric patients. It is well known that spectroscopy is an important tool to assess response to therapy in pediatric and adult brain tumors.58–64 Effective therapy causing cell death thus will result in generally reduced metabolite concentrations (including tCho) and increased lipids because of the release of fatty acids from cell membranes. On the other hand, increasing levels of tCho (or tCho/NAA) are indicators for failed therapy and high risk for progressing disease.
Neoplasia Versus Encephalitis
Accurate initial diagnoses are needed not only to distinguish different types of tumors, but also to separate neoplastic from nonneoplastic disease. Multiple other focal lesions in the brain may mimic brain tumors on conventional anatomic MRI. Some of these lesions include infectious or inflammatory lesions, infarcts, and demyelinating lesions (tumefactive demyelinating lesions). Because of a disrupted blood-brain barrier, these lesions can demonstrate avid contrast enhancement that can mimic conventional MRI characteristics of a malignant brain tumor. In a recent study,65 it was shown that brain lesions resulting from acute encephalitis have a metabolic fingerprint that is significantly different from that of astrocytoma. We have found that mI levels are reduced in acute encephalitis cases (mostly viral) compared with neoplastic processes. Accurate noninvasive diagnosis of encephalitis is important because biopsies with the possibility of complications can be avoided.
Hepatic Encephalopathy
Hepatic encephalopathy refers to a broad spectrum of neurologic derangements associated with liver disease. MRS of hepatic encephalopathy typically demonstrates decreased levels of mI and choline and increased concentration of glutamate/glutamine (Glx) (Fig. 25-6). More recently, it has been demonstrated that MRS metabolites are correlated with plasma ammonia levels and the ratio of branched-chain to aromatic amino acids and can be useful to help establish a diagnosis of minimal hepatic encephalopathy in pediatric patients.66
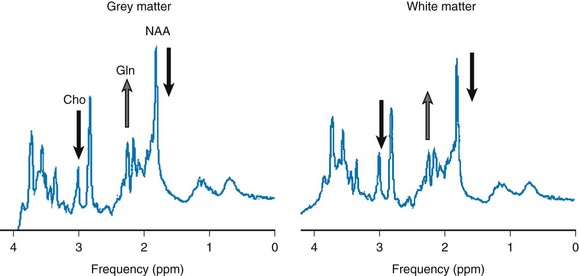
Figure 25-6 Hepatic encephalopathy in a pediatric patient with iron intoxication and acute liver failure.
Magnetic resonance spectroscopy performed at 3T with point resolved spectroscopy and a time echo of 35 ms. Three voxel locations show an elevated glutamine (Gln) level, a reduced choline level, and a reduced myo-inositol level, indicating poor liver function. N-acetylaspartate (NAA) also is reduced, which may indicate neuronal/axonal loss/damage. Conventional magnetic resonance imaging was within normal limits. ppm, Parts per million.
Quantification in Positron Emission Tomography Imaging
Positron emission tomography (PET) is able to quantify radioactivity concentration within a given region of interest. Analysis of tracer activity and its distribution can provide meaningful information on available receptor binding sites or biochemical processes. Three categories of methods in analyzing data are available: (1) qualitative analysis (visual assessment), (2) semiquantitative assessment such as standardized uptake value (SUV) and lesion-to-background ratio, and (3) absolute quantitative analysis using nonlinear regression, Patlak graphical analysis, and simplified quantitative methods.67 Qualitative analysis requires minimal effort but has the least accuracy, whereas an absolute quantification method requires more complex procedures such as compartmental kinetic modeling to measure the individual rate constant based on data from dynamic image acquisition and serial blood sampling. Because of its complexity and time-consuming nature, this method is impractical in most clinical settings.
Compared with kinetic modeling, the SUV calculation is simple (without any need for arterial blood sampling) and faster (without dynamic image acquisition). Tissue SUV is known to have a linear relationship with the rate of glucose metabolism measured by kinetic modeling, with high correlation coefficients of up to 0.91.68,69
Positron Emission Tomography and Brain Development
Chugani et al70 evaluated the functional development of the pediatric brain using FDG-PET. They reported that the metabolic pattern of a developing brain follows the order of anatomic, evolutional, and behavioral development. Increased glucose metabolism demonstrated in the visual cortex, sensorimotor cortex, and cerebellum is correlated with early visuospatial and sensorimotor function and primitive reflexes. It also is known that hypermetabolism in the basal ganglia is associated with developing movement and sensorimotor function.
The degree of glucose metabolism of infants is known to be significantly lower than that of adults based on the quantitative analysis of brain FDG-PET. The current hypothesis is that increased metabolism is associated with increased metabolic demands from neuronal plasticity development.71 The metabolic level of the neonatal brains is about 30% that of adults, and it continues to increase with age. By the age of 3 years, the degree of metabolic activity exceeds that of adults, reaching its plateau between ages 4 and 9 years, with a value 1.3 times higher than that of healthy adults.72 After this period, the metabolic activity continues to decrease to adult levels by the end of the second decade.70 The overall degree of cortical metabolism significantly decreases with age, a consistent finding related to normal aging according to a study of 120 healthy volunteers between the ages of 17 and 79 years.73
The distribution of glucose metabolism of a pediatric brain becomes similar to that of young adults by the age of 1 year. The frontal lobe demonstrates more significant age-related metabolic changes compared with other parts of the brain. For the first 4 months of life, the frontal lobe has relatively low glucose levels, and the metabolic levels in this area gradually increase as frontal lobe–mediated cognitive function and complicated social interaction develops. A 38% decrease in whole-brain metabolism and a 42% decline in frontal lobe metabolism with aging based on linear regression analysis was demonstrated by Chawluk et al.74 No significant differences in regional glucose metabolism were found between men and women.73,75
The remaining cortical areas such as the parietal, occipital, and temporal lobes have significant variations within and across age groups. The metabolic activity in the basal ganglia, thalami, hippocampi, cerebellum, visual cortices, and posterior cingulate gyrus is shown to remain stable at different ages,73 whereas the metabolic activity in the brainstem increases with age.73 Further studies are required to explain whether brain atrophy contributes to hypometabolism with aging.
Positron Emission Tomography in Pediatric Epilepsy
The PET tracer most widely used in clinical practice for evaluation of brain glucose metabolism to localize epileptogenic focus is fluorine-18-deoxyglucose (18F-FDG). FDG-PET is better suited for capturing the interictal state of epilepsy rather than the ictal state because of its long uptake period (40 to 60 minutes). The typical pattern of PET glucose metabolism of an epileptic focus is hypometabolism of the ipsilateral temporal lobe with or without less severe hypometabolism in the extratemporal structures such as the frontal lobe, parietal lobe, and contralateral temporal lobe. When anatomic lesions are associated with epilepsy, the extent of hypometabolism is known to be greater than the size of the structural lesion.76
The pathophysiology of regional hypometabolism in interictal FDG-PET is not clearly known, although several hypotheses have been proposed, including neuronal cell loss, neuronal inhibition, and diaschisis associated with hippocampal neuronal loss77 (Fig. 25-7). However, conflicting evidence also exists, such as temporal hypometabolism without neuronal loss or gliosis78 and a poor correlation between metabolic change in the temporal lobe and hippocampal cell count.79
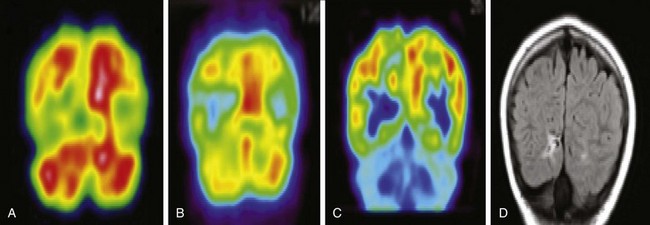
Figure 25-7 A 13-year-old girl with extratemporal lobe (right occipital) epilepsy with localizing epileptogenic focus shown in interictal single photon emission computed tomography (SPECT), positron emission tomography (PET), magnetic resonance imaging (MRI), and nonlocalizing ictal SPECT.
A, An ictal SPECT scan demonstrates an asymmetric perfusion pattern with relative hypoperfusion in the right occipital lobe. No focal hyperperfusion is noted. B, An interictal SPECT scan demonstrates hypoperfusion in the right occipital lobe with an epileptogenic focus. C, A fluorodeoxyglucose-PET scan demonstrates hypometabolism in the right occipital lobe with an epileptogenic focus. D, An MRI fluid attenuated inversion recovery scan demonstrates hyperintensity in the right occipital lobe, suggesting an epileptogenic focus.
Additional proposed hypotheses to explain interictal hypometabolism include an inhibitory process and reduction in synaptic density. Findings of several studies suggested that this secondary inhibition or neuronal loss in the area surrounding the epileptic zone can cause larger and more extensive hypometabolism in FDG-PET77,80,81 and hypoperfusion in single photon emission computed tomography (SPECT)82 than the area of involvement seen on electroencephalography or a pathologic correlate. Further work needs to be performed to validate this mechanism. Interictal FDG-PET is known to be more sensitive than MRI in localizing epileptogenic foci in cases of both temporal and extratemporal epilepsy.83
About 29% of patients with partial or focal epilepsy have normal MRI findings.84 Intracranial electroencephalography has limitations in this situation because of a lack of electrode targeting precision to the areas of suspected seizure origin. Lee et al.85 have described the potential diagnostic role of FDG-PET and SPECT in the absence of anatomic findings, and they showed that the positive predictive value of FDG-PET and ictal SPECT in MRI-negative cryptogenic epilepsy was greater than 70%. The localization rates by FDG-PET in patients with normal MRI findings were 57% and 32%, as reported by Chugani et al.86 and Swartz et al.,87 respectively.
PET/CT Imaging of Pediatric Brain Tumors
Recently, the use of PET and radiopharmaceutical agents for PET for brain tumor imaging has increased. Currently the only radiotracer approved by the FDA is 18F-FDG. In clinical practice, FDG-PET is being used as an adjunct tool in cases in which CT and MRI are unable to address a specific clinical question. The most common clinical indications of PET imaging include: (1) confirmation of the presence or absence of tumor; (2) help in establishing the grade of malignancy; (3) determination of the degree of treatment of the tumor or tumor response; and (4) distinguishing tumor recurrence from radiation necrosis88 (Figs. 25-8 and 25-9). FDG-PET is known to be very sensitive in detecting high-grade gliomas. The high background uptake of FDG normally seen in the cortex results in less accurate detection of low-grade gliomas.89 More recently, PET imaging has been integrated into pediatric multiinstitutional protocols of the Pediatric Brain Tumor Consortium, which will yield useful pediatric data.90
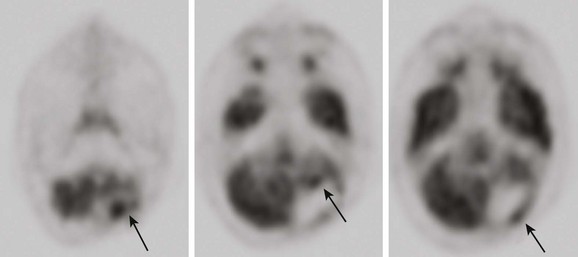
Figure 25-8 An 18-year-old male patient with a history of anaplastic ependymoma in the left cerebellum, after having multiple surgeries.
A brain fluorodeoxyglucose–positron emission tomography scan demonstrates multiple areas of increased activity in the anterior and posterior resection margin consistent with malignant disease (arrows).
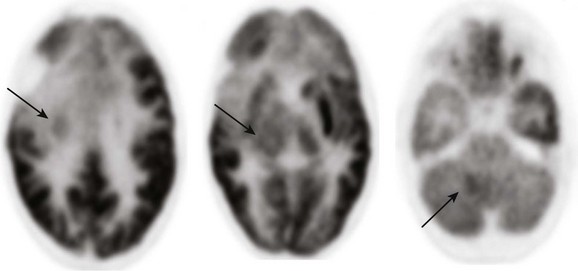
Figure 25-9 A 9-year-old boy with an anaplastic astrocytoma after undergoing resection in the right frontal lobe.
Multiple areas of increased metabolic activity (arrows) are noted involving the right posterior medial frontal lobe, right basal ganglia, right thalamus, and the right cerebellum corresponding to areas of tumor infiltration seen with magnetic resonance imaging.
PET/MRI
The first PET/MRI studies in humans demonstrated an excellent simultaneous performance of both PET and MRI imaging without degrading image quality.91,92 The diagnostic advantages of fused PET and MR images over PET/CT were shown by a 2006 study.93 Moreover, PET/MRI is more beneficial to pediatric patients because it entails much less radiation exposure compared with PET/CT.
Cecil, KM, Kos, RS. Magnetic resonance spectroscopy and metabolic imaging in white matter diseases and pediatric disorders. Top Magn Reson Imaging. 2006;17:275–293.
Panigrahy, A, Nelson, MD, Jr., Bluml, S. Magnetic resonance spectroscopy in pediatric neuroradiology: clinical and research applications. Pediatr Radiol. 2010;40(1):3–30.
References
1. Baslow, MH. Functions of N-acetyl-L-aspartate and N-acetyl-L-aspartylglutamate in the vertebrate brain: role in glial cell-specific signaling. J Neurochem. 2000;75(2):453–459.
2. Tallan, HH. Studies on the distribution of N-acetyl-L-aspartic acid in brain. J Biol Chem. 1957;224:41–45.
3. Kreis, R, Ernst, T, Ross, BD. Development of the human brain: in vivo quantification of metabolite and water content with proton magnetic resonance spectroscopy. Magn Reson Med. 1993;30:424–437.
4. Lien, YH, Shapiro, JI, Chan, L. Effects of hypernatremia on organic brain osmoles. J Clin Invest. 1990;85:1427–1435.
5. Videen, JS. Human cerebral osmolytes during chronic hyponatremia. A proton magnetic resonance spectroscopy study [see comments]. J Clin Invest. 1995;95:788–793.
6. Condon, B, Oluoch-Olunya, D, Hadley, D, et al. Early 1H magnetic resonance spectroscopy of acute head injury: four cases. J Neurotrauma. 1998;115:563–571.
7. Haseler, LJ, Arcinue, E, Danielsen, ER, et al. Evidence from proton magnetic resonance spectroscopy for a metabolic cascade of neuronal damage in shaken baby syndrome. Pediatrics. 1997;99:4–14.
8. Holshouser, BA, Ashwal, S, Luh, GY, et al. Proton MR spectroscopy after acute central nervous system injury: outcome prediction in neonates, infants, and children. Radiology. 1997;202:487–496.
9. Holshouser, BA, Ashwal, S, Shu, S, et al. Proton MR spectroscopy in children with acute brain injury: comparison of short and long echo time acquisitions. J Magn Reson Imaging. 2000;11:9–19.
10. Ross, BD, Ernst, T, Kreis, R, et al. 1H MRS in acute traumatic brain injury. J Magn Reson Imaging. 1998;8:829–840.
11. Bottomley PA: Selective volume method for performing localized NMR spectroscopy, USA patent 4 480 228, 1984.
12. Bottomley, PA. Spatial localization in NMR spectroscopy in vivo. Ann N Y Acad Sci. 1987;508:333–348.
13. Frahm, J, Merboldt, K, Haenicke, W. Localized proton spectroscopy using stimulated echoes. J Magn Reson. 1987;72:502–508.
14. Ordidge, RJ, Connelly, A, Lohman, JA. Image-selected in-vivo spectroscopy (ISIS). A new technique for spatially selective NMR spectroscopy. J Magn Reson. 1986;66:283–294.
15. Penrice, J, Cady, EB, Lorek, A, et al. Proton magnetic resonance spectroscopy of the brain in normal and term infants and early changes after perinatal hypoxia-ischemia. Pediatr Res. 1996;40:6–14.
16. Hanrahan, JD, Sargentoni, J, Azzopardi, D, et al. Cerebral metabolism within 18 hours of birth asphyxia: a proton magnetic resonance spectroscopy study. Pediatr Res. 1996;39:584–590.
17. Leth, H, Toft, PB, Peitersen, B, et al. Use of brain lactate levels to predict outcome after perinatal asphyxia. Acta Paediatr. 1996;85:859–864.
18. Holshouser, BA, Ashwal, S, Luh, GY, et al. Proton MR spectroscopy after acute central nervous system injury: outcome prediction in neonates, infants, and children. Radiology. 1997;202:487–496.
19. Groenendaal, F, Veenhoven, RH, van der Grond, J, et al. Cerebral lactate and N-acetyl-aspartate/choline ratios in asphyxiated full term neonates demonstrated in-vivo using proton magnetic resonance spectroscopy. Pediatr Res. 1994;35:148–151.
20. Huppi, PS, Posse, S, Lazeyras, F, et al. Magnetic resonance in preterm and term newborns: H-1 spectroscopy in developing brain. Pediatr Res. 1991;30:574–578.
21. Cheong, JLY, Cady, EB, Penrice, J, et al. Proton MR spectroscopy in neonates with perinatal cerebral hypoxic-ischemic injury: metabolite peak-area ratios, relaxation times, and absolute concentrations. AJNR Am J Neuroradiol. 2006;27:1546–1554.
22. Moorcraft, J, Bolas, NM, Ives, NK, et al. Spatially localized magnetic resonance spectroscopy of the brains of normal and asphyxiated newborns. Pediatrics. 1991;87:273–282.
23. Peden, CJ, Cowan, FM, Bryant, DJ, et al. Proton MR spectroscopy of the brain in infants. J Comput Assist Tomogr. 1990;14:886–894.
24. Barkovich, AJ, Baranski, K, Vigneron, DB, et al. Proton MR spectroscopy for the evaluation of asphyxiated term neonates. AJNR Am J Neuroradiol. 1999;20:1399–1405.
25. Vigneron, DB, Barkovich, AJ, Noworolski, SM, et al. Three-dimensional proton MR spectroscopic imaging of premature and term neonates. AJNR Am J Neuroradiol. 2001;22:1424–1433.
26. Kreis, R, Hofmann, L, Kuhlmann, B, et al. Brain metabolite composition during early human brain development as measured by quantitative in vivo 1H magnetic resonance spectroscopy. Magn Reson Med. 2002;48:949–958.
27. Shanmugalingam, S, Thorton, JS, Iwata, O, et al. Comparative prognostic utilities of early quantitative magnetic resonance imaging spin-spin relaxometry and proton magnetic resonance spectroscopy in neonatal encephalopathy. Pediatrics. 2006;118:1467–1477.
28. Amess, PN, Penrice, J, Wylezinska, M, et al. Early brain proton magnetic resonance spectroscopy and neonatal neurology related to neurodevelopmental outcome at 1 year in term infants after presumed hypoxic-ischaemic brain injury. Dev Med Child Neurol. 1999;41:436–445.
29. Robertson, NJ, Cox, IJ, Cowan, FM, et al. Cerebral intracellular lactic alkalosis persisting months after neonatal encephalopathy measured by magnetic resonance spectroscopy. Pediatr Res. 1999;46:287–296.
30. Cheong, JL, Cady, EB, Penrice, J, et al. Proton MR spectroscopy in neonates with perinatal cerebral hypoxic-ischemic injury: metabolite peak-area ratios, relaxation times, and absolute concentrations. AJNR Am J Neuroradiol. 2006;27:1546–1554.
31. Roelants-Van Rijn, AM, van der Grond, J, de Vries, LS, et al. Value of (1) H-MRS using different echo times in neonates with cerebral hypoxia-ischemia. Pediatr Res. 2001;49:356–362.
32. L’Abee, C, de Vries, LS, van der Grond, J, et al. Early diffusion-weighted MRI and 1H-magnetic resonance spectroscopy in asphyxiated full-term neonates. Biol Neonate. 2005;88:306–312.
33. Penrice, J, Cady, EB, Lorek, A, et al. Proton magnetic resonance spectroscopy of the brain in normal preterm and term infants, and early changes after perinatal hypoxia-ischemia. Pediatr Res. 1996;40:6–14.
34. Robertson, NJ, Lewis, RH, Cowan, FM, et al. Early increases in brain myo-inositol measured by proton magnetic resonance spectroscopy in term infants with neonatal encephalopathy. Pediatr Res. 2001;50:692–700.
35. Brissaud, O, Chateil, JF, Bordessoules, M, et al. Chemical shift imaging and localized magnetic resonance spectroscopy in full term asphyxiated neonates. Pediatr Radiol. 2005;35:998–1005.
36. Meyer-Witte, S, Brissaud, O, Brun, M, et al. Prognostic value of MR in term neonates with neonatal hypoxic-ischemic encephalopathy: MRI score and spectroscopy. About 26 cases. Arch Pediatr. 2008;15:9–23.
37. Barkovich, AJ, Miller, SP, Bartha, A, et al. MR imaging, MR spectroscopy, and diffusion tensor imaging of sequential studies in neonates with encephalopathy. AJNR Am J Neuroradiol. 2006;27:533–547.
38. Cecil, KM, Kos, RS. Magnetic resonance spectroscopy and metabolic imaging in white matter diseases and pediatric disorders. Top Magn Reson Imaging. 2006;17:275–293.
39. Kinnala, A, Rikalainen, H, Lapinleimu, H, et al. Cerebral magnetic resonance imaging and ultrasonography findings after neonatal hypoglycemia. Pediatrics. 1999;103:724–729.
40. Barkovich, AJ. Toxic and metabolic brain disorders. In: Barkovich AJ, ed. Pediatric neuroimaging. 4th ed. Philadelphia: Lippincott Williams & Wilkins; 2005:76–189.
41. Cecil, K, MR spectroscopy of metabolic disorders. Neuroimaging clinics of North America. Castillo, M, Mukherji, SK, eds. Neuroimaging clinics of North America, Philadelphia, WB Saunders, 2006;Vol 16:87–116. [number 1].
42. van der Knaap, MS, Valk, J. Magnetic resonance of myelin, myelination, and myelin disorders, 2nd ed. Berlin: Springer; 1995.
43. Enns, GM, Barkovich, AJ, Rosenblatt, DS, et al. Progressive neurological deterioration and MRI changes in cblC methylmalonic academia treated with hydroxocoblamin. J Inherit Metab Dis. 1999;22:599–607.
44. Jan, W, Zimmerman, RA, Wang, ZJ, et al. MR diffusion imaging and MR spectroscopy of maple syrup urine disease during acute metabolic decompensation. Neuroradiol. 2003;45:393–399.
45. Cavalleri, F, Bernardi, A, Burlina, A, et al. Diffusion-weighted MRI of maple syrup urine disease encephalopathy. Neuroradiol. 2002;44:499–502.
46. Takanashi, J, Barkovich, A, Cheng, S, et al. Brain MR imaging in acute hyperammonemic encephalopathy arising from late-onset ornithine transcarbamylase deficiency. AJNR Am J Neuroradiol. 2003;24:390–393.
47. Choi, C-G, Yoo, HW. Localized proton MR spectroscopy in infants with urea cycle defect. AJNR Am J Neuroradiol. 2001;22:834–837.
48. Bianchi, MC, Tosetti, M, Battini, R, et al. Proton MR spectroscopy of mitochondrial diseases: analysis of brain metabolic abnormalities and their possible diagnostic relevance. AJNR Am J Neuroradiol. 2003;24:1958–1966.
49. Cross, JH, Connelly, A, Gadian, DG, et al. Clinical diversity of pyruvate dehydrogenase deficiency. Pediatr Neurol. 1994;10:276–283.
50. Zand, DJ, Simon, EM, Pulitzer, SB, et al. In vivo pyruvate detected by MR spectroscopy in neonatal pyruvate dehydrogenase deficiency. AJNR Am J Neuroradiol. 2003;24:1471–1474.
51. Madhavarao, CN, Moffett, JR, Moore, RA, et al. Immunohistochemical localization of aspartoacylase in the rat central nervous system. J Comp Neurol. 2004;472:318–329.
52. Moreno-Torres, A, Martinez-Perez, I, Baquero, M, et al. Taurine detection by proton magnetic resonance spectroscopy in medulloblastoma: contribution to noninvasive differential diagnosis with cerebellar astrocytomas. Neurosurgery. 2004;55:824–829.
53. Wilke, M, Eidenschink, A, Muller-Weihrich, S, et al. MR diffusion imaging and 1H spectroscopy in a child with medulloblastoma. A case report. Acta Radiol. 2001;42:39–42.
54. Tong, Z, Yamaki, T, Harada, K, et al. In vivo quantification of the metabolites in normal brain and brain tumors by proton MR spectroscopy using water as an internal standard. Magn Reson Imaging. 2004;22:1017–1024.
55. Kovanlikaya, A, Panigrahy, A, Krieger, MD, et al. Untreated pediatric primitive neuroectodermal tumor in vivo: quantitation of taurine with MR spectroscopy. Radiology. 2005;236:1020–1025.
56. Wang, Z, Sutton, LN, Cnaan, A, et al. Proton MR spectroscopy of pediatric cerebellar tumors. AJNR Am J Neuroradiol. 1995;16:1821–1833.
57. Panigrahy, A, Krieger, MD, Gonzalez-Gomez, I, et al. Quantitative short echo time 1H-MR spectroscopy of untreated pediatric brain tumors: preoperative diagnosis and characterization. AJNR Am J Neuroradiol. 2006;27:560–572.
58. Lazareff, JA, Gupta, RK, Alger, J. Variation of post-treatment H-MRSI choline intensity in pediatric gliomas. J Neurooncol. 1999;41:291–298.
59. Warren, KE, Frank, JA, Black, JL, et al. Proton magnetic resonance spectroscopic imaging in children with recurrent primary brain tumors. J Clin Oncol. 2000;18:1020–1026.
60. Tzika, AA, Astrakas, LG, Zarifi, MK, et al. Spectroscopic and perfusion magnetic resonance imaging predictors of progression in pediatric brain tumors. Cancer. 2004;100:1246–1256.
61. Wald, LL, Nelson, SJ, Day, MR, et al. Serial proton magnetic resonance spectroscopy imaging of glioblastoma multiforme after brachytherapy. J Neurosurg. 1997;87:525–534.
62. Preul, MC, Leblanc, R, Caramanos, Z, et al. Magnetic resonance spectroscopy guided brain tumor resection: differentiation between recurrent glioma and radiation change in two diagnostically difficult cases. Can J Neurol Sci. 1998;25:13–22.
63. Isobe, T, Matsumura, A, Anno, I, et al. Changes in 1H-MRS in glioma patients before and after irradiation: the significance of quantitative analysis of choline-containing compounds. No Shinkei Geka. 2003;31:167–172.
64. Schlemmer, HP, Bachert, P, Herfarth, KK, et al. Proton MR spectroscopic evaluation of suspicious brain lesions after stereotactic radiotherapy. AJNR Am J Neuroradiol. 2001;22:1316–1324.
65. Panigrahy, A, Krieger, M, Gonzalez-Gomez, I, et al. Differentiation of encephalitis from astrocytomas in pediatric patients by quantitative in vivo MR spectroscopy. Chicago: American Society of Neuroradiology; 2007.
66. Foerster, BR, Coklin, LS, Petrou, M, et al. Minimal hepatic encephalopathy in children: evaluation with proton MR spectroscopy. AJNR Am J Neuroradiol. 2009;30(8):1610–1613.
67. Basu, S, Zaidi, H, Houseni, M, et al. Novel quantitative techniques for assessing regional and global function and structure based on modern imaging modalities: implications for normal variation, aging and diseased states. Semin Nucl Med. 2007;37:223–239.
68. Minn, H, Leskinen-Kallio, S, Lindholm, P, et al. [18F]fluorodeoxyglucose uptake in tumors: kinetic vs. steady-state methods with reference to plasma insulin. J Comput Assist Tomogr. 1993;17:115–123.
69. Kole, A, Nieweg, O, Pruim, J, et al. Standardized uptake value and quantification of metabolism for breast cancer imaging with FDG and L-[1-11C]tyrosine PET. J Nucl Med. 1997;38:692–696.
70. Chugani, HT, Phelps, ME, Mazziotta, JC. Positron emission tomography study of human brain functional development. Ann Neurol. 1987;22:487–497.
71. Kennedy, C, Sokoloff, L. An adaptation of the nitrous oxide method to the study of the cerebral circulation in children; normal values for cerebral blood flow and cerebral metabolic rate in childhood. J Clin Invest. 1957;36:1130–1137.
72. Chugani, HT. Functional brain imaging in pediatrics. Pediatr Clin North Am. 1992;39:777–799.
73. Loessner, A, Alavi, A, Lewandrowski, KU, et al. Regional cerebral function determined by FDG-PET in healthy volunteers: normal patterns and changes with age. J Nucl Med. 1995;36:1141–1149.
74. Chawluk, JB, Alavi, A, Dann, R, et al. Positron emission tomography in aging and dementia: effect of cerebral atrophy. J Nucl Med. 1987;28:431–437.
75. Miura, SA, Shapiro, MB, Grady, CL. Effects of gender on glucose utilization rates in healthy humans: a positron emission tomography study. J Neurosci Res. 1990;27:500–504.
76. Koepp, MJ, Woermann, FG. Imaging structure and function in refractory focal epilepsy. Lancet Neurol. 2005;4:42–53.
77. Engel, J, Brown, WJ, Kuhl, DE, et al. Pathological findings underlying focal temporal lobe hypometabolism in partial epilepsy. Ann Neurol. 1982;12:518–528.
78. Henry, TR, Mazziotta, JC, Engel, J. Interictal metabolic anatomy of mesial temporal lobe epilepsy. Arch Neurol. 1993;50:582–589.
79. Henry, TR, Babb, TL, Engel, J, et al. Hippocampal neuronal loss and regional hypometabolism in temporal lobe epilepsy. Ann Neurol. 1994;36:925–927.
80. Duncan, JD, Moss, SD, Bandy, DJ, et al. Use of positron emission tomography for presurgical localization of eloquent brain areas in children with seizures. Pediatr Neurosurg. 1997;26:144–156.
81. Theodore, WH. MRI, PET, SPECT: interrelations, technical limits, and unanswered questions. Epilepsy Res Suppl. 1992;5:127–134.
82. Markand, ON, Spencer, SS, Anderson, AR. SPECT in epilepsy. J Neuroimaging. 1995;5(suppl 1):S23–S33.
83. Spencer, S. The relative contributions of MRI, SPECT, and PET imaging in epilepsy. Epilepsia. 1994;35(suppl 6):S72–S89.
84. Semah, F, Picot, MC, Adam, C, et al. Is the underlying cause of epilepsy a major prognostic factor for recurrence? Neurology. 1998;51:1256–1262.
85. Lee, DS, Lee, SK, Chung, J-K, et al. Predictive values of F-18-FDG PET and ictal SPECT to find epileptogenic zones in cryptogenic neocortical epilepsies (abstract). J Nucl Med. 1997;38:272.
86. Chugani, HT, Shields, WD, Shewmon, DA, et al. Infantile spasms: I. PET identifies focal cortical dysgenesis in cryptogenic cases for surgical treatment. Ann Neurol. 1990;27:406–413.
87. Swartz, BE, Brown, C, Mandelkern, MA, et al. The use of 2-deoxy-2[18F] fluoro-D-glucose (FDG-PET) positron emission tomography in the routine diagnosis of epilepsy. Mol Imaging Biol. 2002;4:245–252.
88. Van Heertum, RL, Greenstein, EA, Tikofsky, RS. 2-deoxyfluorglucose-PET imaging of the brain: current clinical applications with emphasis on dementia. Semin Nucl Med. 2004;34:300–312.
89. Di Chiro, G, DeLaPaz, RL, Brooks, RA, et al. Glucose utilization of cerebral gliomas measured by [18F] fluorodeoxyglucose and positron emission tomography. Neurology. 1982;32:1323–1329.
90. Williams, G, Fahey, FH, Treves, ST, et al. Exploratory evaluation of two-dimensional and three-dimensional methods of FDG PET quantification in pediatric anaplastic astrocytoma: a report from the Pediatric Brain Tumor Consortium (PBTC). Eur J Nucl Med Mol Imaging. 2008;35:1651–1658.
91. Schmand, M, Burbar, Z, Corbeil, JL, et al. Brain PET: first human tomography for simultaneous (functional) PET and MR imaging. J Nucl Med Suppl. 2007;48(suppl 2):45P. [abstract 151].
92. Schlemmer, H-P, Pichler, BJ, Wienhard, K, et al. Simultaneous MR/PET for brain imaging: First patient scans. J Nucl Med Suppl. 2007;48(suppl 2):45P. [abstract 152].
93. Muller-Horvat, C, Radny, P, Eigentler, TK, et al. Prospective comparison of the impact on treatment decisions of whole-body magnetic resonance imaging and computed tomography in patients with metastatic malignant melanoma. Eur J Cancer. 2006;42:342–350.