[level-membership-for-rheumatology-category]
1 Magnetic resonance
Principles and application to diagnostic imaging
Introduction
Nuclear magnetic resonance (NMR), the principle on which magnetic resonance (MR) imaging is based, was discovered independently in 1946 by Felix Bloch and Edward Purcell; they were jointly awarded the Nobel Prize for physics in 1952.1 The first actual image was produced by Paul Lauterbur; although it was grainy and fuzzy, it nevertheless showed the difference between ordinary and ‘heavy’ water (D2O). The importance of MR imaging has been such that he too went on to win a Nobel Prize of his own in 2003.2 The first human image was captured in 1977.3
The name ‘nuclear magnetic resonance’ was altered to ‘magnetic resonance imaging’ in the 1980s. The official reason given was the public’s negative connotation with the word ‘nuclear’, particularly after the accident at the Three Mile Island power station in 1979. The unofficial explanation was that hospital workers feared that NMR might stand for ‘No More Radiographers’, whereas MRI could only mean ‘More Radiographers Immediately’.4
Magnetic resonance imaging uses powerful computer algorithms to generate multiplanar imaging slices through the body.5 Because it does not utilize ionizing radiation and provides a greater degree of contrast between the different soft tissues of the body than does computed tomography (CT), it is particularly useful in cardiovascular, musculoskeletal, neurological and oncological imaging.6 The relative lack of attendant safety issues also means that it is a modality that can be used to monitor the course of a condition or the response to treatment by repeat imaging.6 Although MR imaging is generally safe and non-invasive, there are circumstances in which it is contraindicated; these are detailed in Box 1.01.7
Box 1.01 MRI contraindications or relative contraindications
In place of x-rays, MR imaging uses a powerful magnetic field to align the magnetic moments of certain atoms within the body. Radiofrequency fields are then used to alter the alignment of this magnetization, which causes the atomic nuclei to produce a rotating magnetic field, specific to each tissue type, which is detectable by a receptor inside the scanner. This signal can then be manipulated to build sufficient information to construct an image of the body.4,8
Magnetic resonance
Subatomic particles, such as protons, neutrons, positrons and electrons, have the property of spin, causing the particle to act as a magnetic dipole; that is, having north and south poles.4,9 If two such particles pair up, the laws of magnetic attraction and repulsion mean that they will point in opposite directions and cancel each other out, so that the resultant particle has no overall magnetism. Certain nuclei, such as 1H, which consists of a single proton, 3He, 13C, 23Na and 31P, have an uneven number of protons and neutrons, and therefore have an unpaired particle, giving the nucleus an overall magnetism, known as the magnetic moment.3,4
This effect is particularly strong in hydrogen, which does not have other particles to ‘dilute’ the relative strength of its magnetic moment; it is this nucleus, therefore, that is of primary importance in MR imaging.4,10 Hydrogen has two spin states, sometimes referred to as ‘up’ and ‘down’.9 When these spins are placed in a strong external magnetic field, such as that found in an MRI scanner, they precess around an axis along the direction of the field (Figure 1.01).11 Most protons have low energies and will align with the magnetic field; however, a small number have sufficient energy to have an anti-parallel alignment.11
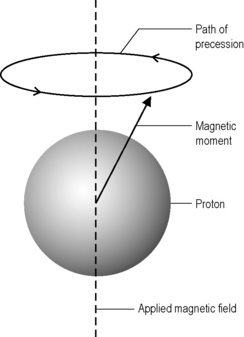
Figure 1.01 • The magnetic moment of the proton precesses about the flux lines of the applied magnetic field.
The frequency with which the protons precess (ω0) is directly proportional to the strength of the magnetic field (B). In a magnetic field of 1 tesla, of the order found in MR scanners, hydrogen atoms will precess at precisely 42.6 MHz, which is in the radio wave band of the electromagnetic spectrum. This value, which varies from nucleus to nucleus as well as with magnetic field strength, is known as the Larmor frequency.4,11
Energy absorption
Applying a radiofrequency pulse of this value at 90° to the magnetic field causes the hydrogen nuclei, and only the hydrogen nuclei, to resonate; other nuclei – even if they have dipoles – will have their own unique resonance frequency for a given magnetic field. The hydrogen nuclei absorb energy from the pulse, which increases their net energy and, therefore, the number of high-energy anti-parallel protons. If exactly the right amount of energy is applied, this will result in the magnetic fields of the combined hydrogen magnetic moments cancelling each other out; effectively, the net magnetization vector of the hydrogen nuclei lies at 90° to the applied field.4,12
Phase coherence
The applied radiofrequency pulse also causes the rotating magnetic moments of the hydrogen nuclei to move into phase with each other; this is known as phase coherence. It affects all of the nuclei, so the low-energy ‘spin up’ protons are in phase both with each other and with the high-energy ‘spin down’ protons. This means that the net magnetization vector now precesses in exactly the same way as the individual protons at the Lamor frequency.4,12
The MR signal
The image detector in MR imaging is an electromagnetic coil, which acts as a receiver. It is placed at 90° to the applied magnetic field in what is known as the transverse plane; the direction of the magnetic field is the longitudinal plane. Whilst the net magnetization vector lies in the transverse plane, its precession means that it passes across the receiver, inducing a voltage in the coil. This is the MR signal. Because the motion of precession is circular, it induces an alternating current in exactly the same way that a spinning magnet induces an alternating current in a power-generating coil.3,12,13
When the radiofrequency pulse is removed, the protons begin to lose energy, and the difference between the numbers of spin up and spin down protons increases again until the net magnetization vector lies in the longitudinal plane. As this happens, the MR signal decays: electromotive force is only induced by the component of the magnetic field lying perpendicular to it – the longitudinal component of the vector induces no current in the receptor coil. This decrease in the magnitude of the MR signal is called free induction decay (free because it happens when the hydrogen nuclei are ‘free’ of the radiofrequency pulse).12
The removal of the radiofrequency pulse also causes the net magnetization vector to stop precessing. This loss of phase coherence is called transverse (or T2) relaxation whereas the recovery of longitudinal magnetization is called longitudinal (or T1) relaxation.4
Contrast
Molecules, unless at the hypothetical limit of absolute zero, are constantly in motion. The greater the motion, the greater the inertia and the more difficult it is for the molecule to release its energy to its surroundings.4
Most molecules in the body contain hydrogen; amongst the commonest are fat and water. Water molecules are small and therefore have low inertia; however, they have a high inherent energy, which makes it more difficult for them to absorb more energy efficiently. By contrast, fat molecules consist of long chains of hydrocarbons – a central chain of interlinked carbon atoms with hydrogen attached to the sides. They therefore have high inertia and also possess a low inherent energy, meaning that they readily absorb additional energy.12
These characteristics mean that the different tissues in the body have different relaxation times and this is used to produce contrast: areas of high signal (which appears white), medium signal (grey) and low signal (black) which reflect the strength – or, more properly, prolongation – of the MR signal recovered from different locations within the sample.6
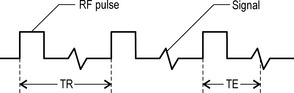
In addition to relaxation times, contrast is also affected by a number of other factors, including the relative density of the excited hydrogen and the extrinsic factors controlled by the radiographer. The two most important of these are the repetition time (TR) and the echo time (TE).14
Repetition time (TR)
This is the time between the applications of the radiofrequency pulses and is measured in milliseconds (ms). The TR affects the length of the relaxation period.8
Echo time (TE)
This is the length of time between the start of a radiofrequency pulse and the collection of the MR signal; it is also measured in milliseconds. The TE affects the relaxation times after the removal of the radiofrequency pulses and also the peak of the signal induced in the receiver coil.8 The differentiation of these factors is shown in Figure 1.02.
The precise design of the imaging pulse sequences allows one contrast mechanism to be emphasized while the others are minimized. This ability to choose different contrast mechanisms is what gives MR imaging its tremendous flexibility.4 In the spine (Figure 1.03), the spinal canal structures have very different appearance on T1-weighting compared to T2-weighting, whilst the vertebral bodies and discs remain almost unchanged. The differences in signal intensities between the two types of images are summarized in Table 1.01.
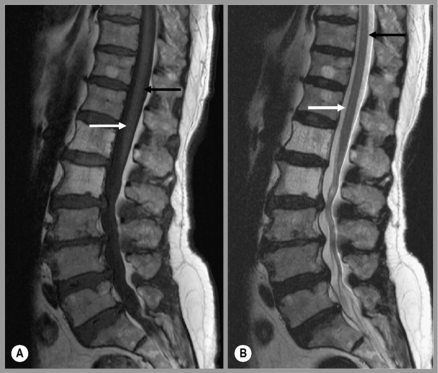
Table 1.01 Signal intensities seen in T1-weighted and T2-weighted images
| Structure | T1-weighting | T2-weighting |
|---|---|---|
| Air | No signal | No signal |
| Avascular necrosis | Low signal | High signal |
| Calcification | No/low signal | No/low signal |
| Cortical bone | No/low signal | No/low signal |
| Degenerative fatty deposition | High signal | Low signal |
| Fast-flowing blood | No signal | No signal |
| Fat | High signal | Low signal |
| Fluid cysts | Low signal | High signal |
| Haemangioma | High signal | High signal |
| Infarction | Low signal | High signal |
| Infection | Low signal | High signal |
| Lipoma | High signal | Low signal |
| Scar tissue | No signal | No signal |
| Sclerosis | Low signal | High signal |
| Slow-flowing blood | High signal | High signal |
| Tendons | No/low signal | No/low signal |
| Tumours | Low signal | High signal |
There are conditions in which it is not possible to generate enough image contrast to adequately show the anatomy or pathology of clinical interest by adjusting the imaging parameters alone. In such cases, a contrast agent may be administered. This may be as simple as getting the patient to drink a glass of water to assist in imaging the stomach and small bowel; however, most of the contrast agents used in MR imaging are selected for their specific paramagnetic properties.4
The most common paramagnetic contrast agent used in musculoskeletal imaging is gadolinium. Gadolinium-enhanced tissues and fluids appear extremely bright on T1-weighted images and this provides high sensitivity for detection of neovascular tissue associated with fibrous tissue, such as that found in tumours, and permits assessment of brain perfusion in cases of cerebrovascular incidents. It also allows assessment of scar tissue following discal surgery. The addition of gadolinium adds a considerable degree of invasiveness and potential toxicity to the imaging procedure and is contraindicated in patients with impaired kidney function (nephrogenic fibrosis).7
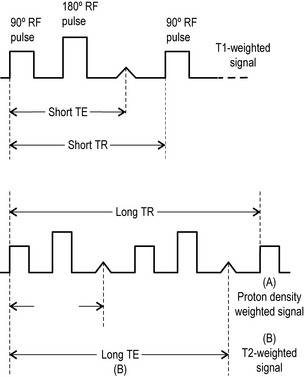
Proton density weighting
By reducing T1-weighting and T2-weighting effects using a long TR and a short TE respectively, it is possible to create an image that reflects the relative proton density of different tissues. A high signal is produced in areas that have a high proton density and vice versa; this can be used to identify certain pathologies.3,12
Pulse sequences
There are a number of ways in which the operator can further manipulate the image. A pulse sequence is defined as a series of radiofrequency pulses, which may be further modified by the application of gradients, a change in magnetic flux density along the length of the scanner, and by changing the intervening time periods.15
The main purpose of these pulse sequences is to manipulate the TE and TR to produce different types of contrast and to rephase the spin of the hydrogen nuclei, which tend to gradually un-phase owing to inhomogeneities in the applied magnetic field causing signal decay.4,14
Spin echo (SE)
Spin echo (SE) uses a radiofrequency pulse to rephase in the manner already described; however, in addition to the initial 90° pulse, a second pulse is added at 180° to rephase any nuclei that have decreased their precessional frequency and reform the net magnetization vector. This regenerates the induced MR signal, which had been decaying, and this regeneration can be measured. The regenerated signal is called an ‘echo’ and, because a radiofrequency pulse has been used to generate it, it is specifically termed spin echo. Spin echo is used to produce T1-weighted (short TR, short TE) and T2-weighted (long TR, long TE) images. By adding an additional 180° pulse (these pulses do not affect TR, which is still defined as the gap between the application of 90° pulses), it is possible to produce two images per pulse. Both will have a long TR; however, the first will have a short TE and produces a proton density weighted image. The second has a long TR and TE and is used to produce a standard T2-weighted image (Figure 1.04). This is known as a dual echo sequence.15
The main problem with methods of image acquisition is the length of time taken; this can be reduced by fast or turbo spin echo (FSE/TSE) whereby a chain of 180° rephasing pulses are applied in between the 90° pulses. This can reduce the imaging time by factors of as much as 16; however, there is an inevitable trade-off with image quality and artifacts from blood flow, which usually is not imaged but can be ‘frozen’ if the image acquisition is fast enough. This technique depends on altering the gradient between each pulse so that the phase is slightly shifted and can be differentiated by the computer algorithm.16
Inversion recovery (IR)
If instead of beginning with a 90° radiofrequency pulse a spin echo sequence begins with a 180° pulse, then the net magnetization vector will be inverted (the TR now becomes the time interval between successive inverting 180° pulses). This pulse is then followed by a second pulse at 90°, which creates a magnetic resonance signal in the induction coils. The time between the two pulses is called the time from inversion (TI) and this process is called inversion recovery. If this signal is then rephased as before with a rephasing 180° pulse (as distinct from the inverting 180° pulse; this pulse does not influence TR), then an echo pulse can be produced.15,16
There are three inversion sequences that are in common diagnostic use.
Fast inversion recovery
This is a mixture between inversion recovery and fast spin echo, which has the advantage of reducing image acquisition time, which can otherwise be lengthy. The gap between the turbo pulses can be made shorter (for T1-weighting) or longer (for T2-weighting).15
Short TI inversion recovery (STIR)
By using a short TI (usually abbreviated to tau, hence STIR becomes Short Tau Inversion Recovery), it is possible to suppress the net magnetization vector of fat, timing the 90° pulse for the moment that the net magnetization vector for fat is passing through the transverse plane, its null point. The pulse will then have no induction effect and no signal for fat will be produced. The technique is often used in conjunction with FSE in order to evaluate oedema, particularly in cerebral structures. It is also commonly used in musculoskeletal imaging for the detection of subtle inflammatory changes, such as those seen in fractures, if a T2 FSE is not available.4
Clinical aspects of MRI
Patients will also have questions for you from the moment you decide that imaging is required – why MR imaging and not x-ray? If you cannot readily answer this question, you should revisit your clinical and diagnostic thinking. They will also, as a rule, want to know how much it is going to cost, particularly where the cost of the procedure is not covered by insurance schemes or public health. As a clinician, it is your job to screen the patient for contraindications (Box 1.01); there is nothing guaranteed to infuriate both the imaging centre and patient more than for them to have their time and effort wasted by an inappropriate referral. On occasion, it may be necessary to prescribe tranquillizers (and arrange a chauffeur) for a nervous, claustrophobic patient who cannot gain access to imaging by an open scanner; it may also be necessary to organize a skull x-ray to screen for metal fragments in and around the orbit in those patients who have worked with lathes or sheet metal or who have seen active service in the armed forces.7
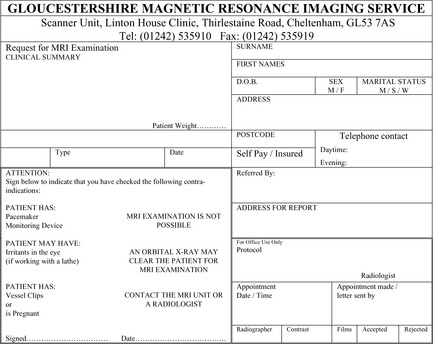
Most imaging centres will have their own bespoke forms; a typical such form (for the author’s own ‘local’ MR scanner) is shown in Figure 1.05. It is important to give the radiologist as much information as possible so that the appropriate protocols can be used to answer the clinical question that you want answered: the radiologist can’t refine your differential diagnosis if you don’t have one! Regional protocols are discussed on a chapter by chapter basis; however, as a rule, you can expect to receive back a CD or hard copy films containing T1- and T2-weighted images in at least two planes. These should be correlated with the radiologist’s report (a good way to practise) and with your own clinical findings and thought processes – remember, the radiologist has not seen the patient, you have.
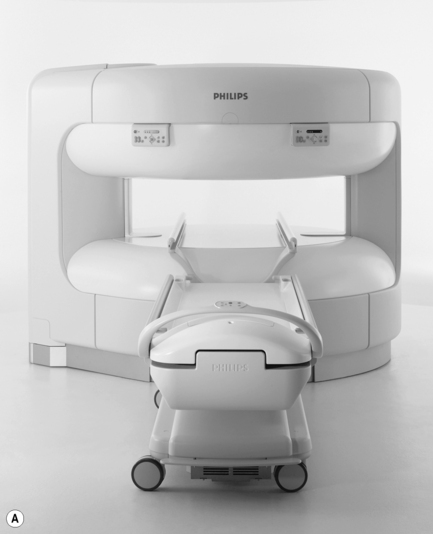
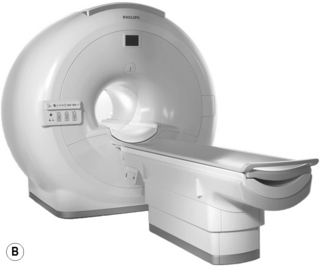
A traditional MR imaging scanner has, from the patient’s perspective, the appearance of a long tunnel, around 1.60 m in length. The opening is fairly small; indeed, most centres have an upper limit of 225–280 lb beyond which it is physically impossible to fit the patient in the scanner. In this instance, the open scanner again provides an alternative (Figure 1.06).
1 Nobel Lectures. Amsterdam: Elsevier Publishing, 1964.
2 Lauterbur P.C. Image formation by induced local interactions: examples of employing nuclear magnetic resonance. Nature. 1973;242:190-191.
3 Allison W. Imaging with magnetic resonance. In: Fundamental Physics for Probing and Imaging. Oxford: Oxford University Press; 2006:207-226.
4 Young M.F. Diagnostic imaging. In: Essential Physics for Musculoskeletal Medicine. Edinburgh: Elsevier; 2010.
5 Rowe L., Yochum T. Principles of radiological interpretation. In: Yochum T., Rowe L., editors. Essentials of Skeletal Radiology. 2nd ed. Baltimore: Williams and Wilkins; 1996:547-585.
6 DeVries R.M., Manne A. Cervical MRI. Part I: a basic overview. Clinical Chiropractic. 2003;6(4):137-143.
7 Shellock F.G. [cited 2009 14th June]. Safety Information. 2008. Available from: www.mrisafety.com
8 Halliday D., Resnick D., Walker J. Magnetic resonance. In: Fundamentals of Physics. Hoboken, NJ: John Wiley and Sons; 2005:1015-1016.
9 Garood J.R. Nuclear and quantum physics. In: Physics. Maidenhead: Intercontinental Book Productions; 1979:276-314.
10 Crooks L., Herfkens R., Kaufman L., et al. Nuclear magnetic resonance imaging. Prog Nucl Med. 1981;7:149-163.
11 Westbrook C. Alignment and precession. In: MRI at a Glance. Oxford: Blackwell Science; 2002:16-17.
12 Westbrook C. Resonance and signal generation. In: MRI at a Glance. Oxford: Blackwell Science; 2002:18-19.
13 Garood J.R. Electromagnetism. In: Physics. Maidenhead: Intercontinental Book Productions; 1979:232-275.
14 Westbrook C. Image contrast. In: MRI at a Glance. Oxford: Blackwell Science; 2002:20-27.
15 Westbrook C. Pulse sequences. In: MRI at a Glance. Oxford: Blackwell Science; 2002:28-47.
16 Helms C., Major N., Anderson M.W., et al. Musculoskeletal MRI, 2nd ed., Philadelphia: Elsevier Saunders; 2009:1-19.
[/level-membership-for-rheumatology-category][not-level-membership-for-rheumatology-category]
1 Magnetic resonance
Principles and application to diagnostic imaging
Introduction
Nuclear magnetic resonance (NMR), the principle on which magnetic resonance (MR) imaging is based, was discovered independently in 1946 by Felix Bloch and Edward Purcell; they were jointly awarded the Nobel Prize for physics in 1952.1 The first actual image was produced by Paul Lauterbur; although it was grainy and fuzzy, it nevertheless showed the difference between ordinary and ‘heavy’ water (D2O). The importance of MR imaging has been such that he too went on to win a Nobel Prize of his own in 2003.2 The first human image was captured in 1977.3
The name ‘nuclear magnetic resonance’ was altered to ‘magnetic resonance imaging’ in the 1980s. The official reason given was the public’s negative connotation with the word ‘nuclear’, particularly after the accident at the Three Mile Island power station in 1979. The unofficial explanation was that hospital workers feared that NMR might stand for ‘No More Radiographers’, whereas MRI could only mean ‘More Radiographers Immediately’.4
Magnetic resonance imaging uses powerful computer algorithms to generate multiplanar imaging slices through the body.5 Because it does not utilize ionizing radiation and provides a greater degree of contrast between the different soft tissues of the body than does computed tomography (CT), it is particularly useful in cardiovascular, musculoskeletal, neurological and oncological imaging.6 The relative lack of attendant safety issues also means that it is a modality that can be used to monitor the course of a condition or the response to treatment by repeat imaging.6 Although MR imaging is generally safe and non-invasive, there are circumstances in which it is contraindicated; these are detailed in Box 1.01.7
Box 1.01 MRI contraindications or relative contraindications
In place of x-rays, MR imaging uses a powerful magnetic field to align the magnetic moments of certain atoms within the body. Radiofrequency fields are then used to alter the alignment of this magnetization, which causes the atomic nuclei to produce a rotating magnetic field, specific to each tissue type, which is detectable by a receptor inside the scanner. This signal can then be manipulated to build sufficient information to construct an image of the body.4,8
Magnetic resonance
Subatomic particles, such as protons, neutrons, positrons and electrons, have the property of spin, causing the particle to act as a magnetic dipole; that is, having north and south poles.4,9 If two such particles pair up, the laws of magnetic attraction and repulsion mean that they will point in opposite directions and cancel each other out, so that the resultant particle has no overall magnetism. Certain nuclei, such as 1H, which consists of a single proton, 3He, 13C, 23Na and 31P, have an uneven number of protons and neutrons, and therefore have an unpaired particle, giving the nucleus an overall magnetism, known as the magnetic moment.3,4
This effect is particularly strong in hydrogen, which does not have other particles to ‘dilute’ the relative strength of its magnetic moment; it is this nucleus, therefore, that is of primary importance in MR imaging.4,10 Hydrogen has two spin states, sometimes referred to as ‘up’ and ‘down’.9 When these spins are placed in a strong external magnetic field, such as that found in an MRI scanner, they precess around an axis along the direction of the field (Figure 1.01).11 Most protons have low energies and will align with the magnetic field; however, a small number have sufficient energy to have an anti-parallel alignment.11
Figure 1.01 • The magnetic moment of the proton precesses about the flux lines of the applied magnetic field.
The frequency with which the protons precess (ω0) is directly proportional to the strength of the magnetic field (B). In a magnetic field of 1 tesla, of the order found in MR scanners, hydrogen atoms will precess at precisely 42.6 MHz, which is in the radio wave band of the electromagnetic spectrum. This value, which varies from nucleus to nucleus as well as with magnetic field strength, is known as the Larmor frequency.4,11
Energy absorption
Applying a radiofrequency pulse of this value at 90° to the magnetic field causes the hydrogen nuclei, and only the hydrogen nuclei, to resonate; other nuclei – even if they have dipoles – will have their own unique resonance frequency for a given magnetic field. The hydrogen nuclei absorb energy from the pulse, which increases their net energy and, therefore, the number of high-energy anti-parallel protons. If exactly the right amount of energy is applied, this will result in the magnetic fields of the combined hydrogen magnetic moments cancelling each other out; effectively, the net magnetization vector of the hydrogen nuclei lies at 90° to the applied field.4,12
Phase coherence
The applied radiofrequency pulse also causes the rotating magnetic moments of the hydrogen nuclei to move into phase with each other; this is known as phase coherence. It affects all of the nuclei, so the low-energy ‘spin up’ protons are in phase both with each other and with the high-energy ‘spin down’ protons. This means that the net magnetization vector now precesses in exactly the same way as the individual protons at the Lamor frequency.4,12
The MR signal
The image detector in MR imaging is an electromagnetic coil, which acts as a receiver. It is placed at 90° to the applied magnetic field in what is known as the transverse plane; the direction of the magnetic field is the longitudinal plane. Whilst the net magnetization vector lies in the transverse plane, its precession means that it passes across the receiver, inducing a voltage in the coil. This is the MR signal. Because the motion of precession is circular, it induces an alternating current in exactly the same way that a spinning magnet induces an alternating current in a power-generating coil.3,12,13
When the radiofrequency pulse is removed, the protons begin to lose energy, and the difference between the numbers of spin up and spin down protons increases again until the net magnetization vector lies in the longitudinal plane. As this happens, the MR signal decays: electromotive force is only induced by the component of the magnetic field lying perpendicular to it – the longitudinal component of the vector induces no current in the receptor coil. This decrease in the magnitude of the MR signal is called free induction decay (free because it happens when the hydrogen nuclei are ‘free’ of the radiofrequency pulse).12
The removal of the radiofrequency pulse also causes the net magnetization vector to stop precessing. This loss of phase coherence is called transverse (or T2) relaxation whereas the recovery of longitudinal magnetization is called longitudinal (or T1) relaxation.4
