[level-membership-for-radiology-category]
Chapter 7 Magnetic Resonance Imaging of Breast Cancer and MRI-Guided Breast Biopsy
Basic Principles
Breast Cancer
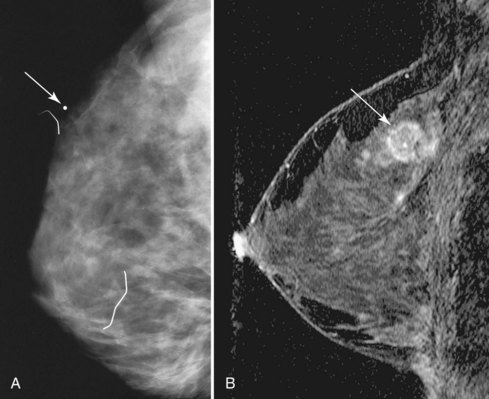
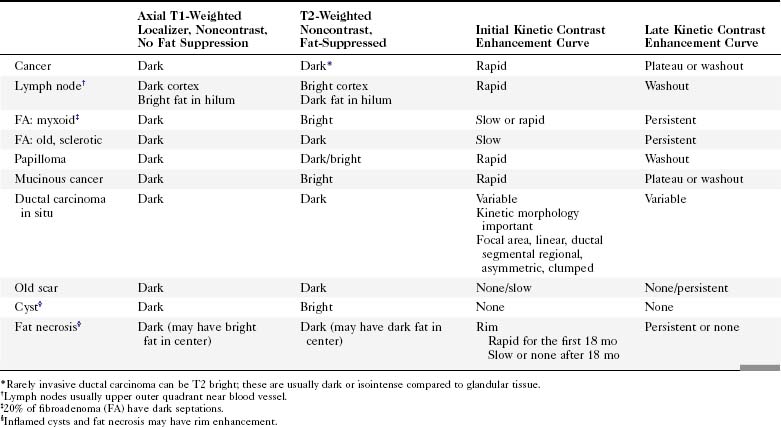
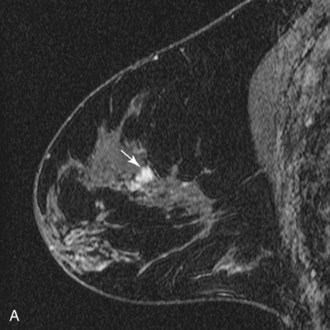
Invasive breast tumors are characterized by an ingrowth of neovascularity at their periphery. Tumor angiogenesis is associated with increased perfusion and abnormal leaky endothelium, leading to preferential enhancement of tumors versus normal breast tissue (Box 7-1). With bolus administration of an intravenous (IV) contrast agent, increased vascular flow and the rapid exchange rate of contrast between blood and the extracellular compartment cause invasive breast tumors to enhance more rapidly and more avidly than normal fibroglandular tissue, even in patients with dense breasts. Thus, invasive breast cancers have high signal intensity and are brighter than the surrounding normal tissue on the first postcontrast scan, which ideally should be obtained about 90 seconds after injection. As a result, MRI exquisitely reveals invasive tumors that are occult on mammography (Fig. 7-1). The sensitivity of MRI for invasive breast cancer is extremely high—over 90%. However, as discussed in detail in this chapter, contrast enhancement on MRI is seen in many benign conditions as well; the specificity of MRI varies between 39% and 95%. As detailed in this chapter, morphology, T1 and T2 characteristics, and the time course of contrast enhancement help differentiate benign from malignant lesions (Table 7-1).
Box 7-1 Principles of Breast Cancer MRI
Contrast-enhanced MRI is extremely sensitive for tumor angiogenesis, regardless of radiographic breast density.
Tumor angiogenesis leads to preferential enhancement of cancers with intravenous contrast.
Lesion morphology helps distinguish cancer from benign conditions.
The time-course of contrast enhancement helps distinguish invasive cancer from other conditions:
Technique
Patient Preparation
Benign hormone-related enhancement of normal breast tissue, called background enhancement, occurs before the onset of menses and can lead to false-positive studies. When possible, patients should be imaged 7 to 10 days after the onset of their menstrual cycle, when spurious contrast enhancement of normal breast tissue is at its nadir (Box 7-2).
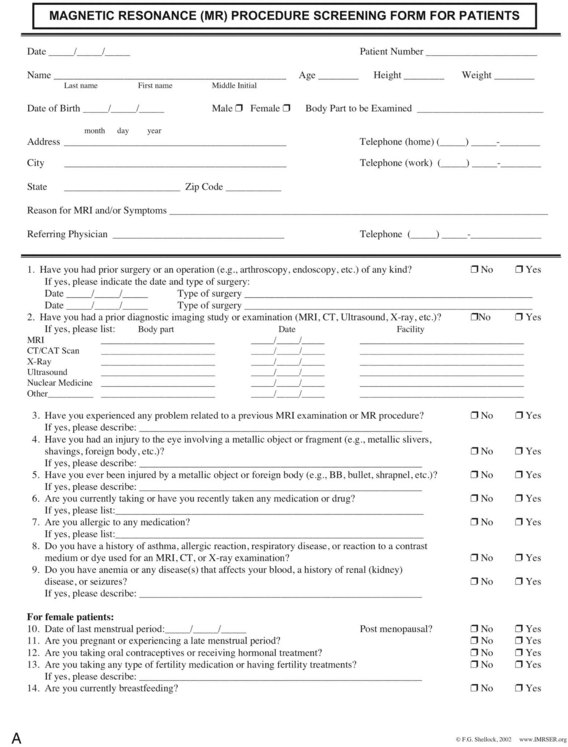
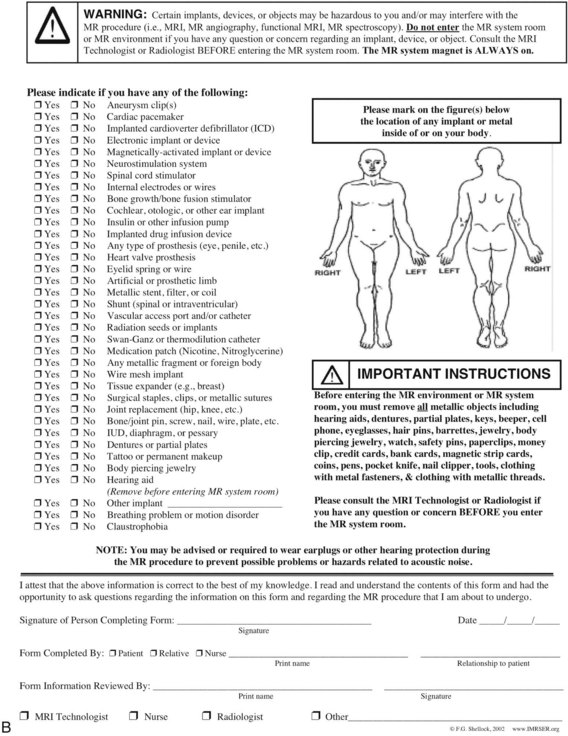
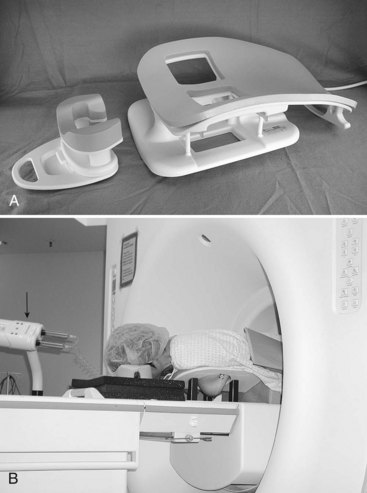
Before MRI scanning, the patient fills out an MRI safety form to exclude contraindications of entering the strong magnetic field, such as ferromagnetic vascular clips, metallic ocular fragments, pacemakers, and implanted electromechanical devices. A qualified person reviews the standardized MRI safety form before scanning (Fig. 7-2).
Equipment
An IV catheter is placed before scanning and is continuously flushed by using the keep vein open (KVO) setting of an MRI-compatible remote power injector. Placement of the catheter in the antecubital fossa contralateral to any known, previous, or suspected malignancy is preferred. The patient is placed prone on a dedicated breast coil (Fig. 7-3A). Prone positioning minimizes respiratory motion in the breast. Phased-array breast coils maximize the signal-to-noise ratio of the image. Patient discomfort is the primary cause of motion; the majority of patients remain most comfortable for the duration of the entire scan with both arms at their sides and wearing hearing protection (see Fig. 7-3B). The technologist spends considerable time discussing the importance of “holding still” with the patient to obtain the best scan. The patient then works with the technologist to obtain a comfortable position within the breast coil. Optional mild breast stabilization, or “compression,” may be used to reduce breast motion and decrease the volume of tissue to be scanned so that the whole breast is included. However, firm compression (as used routinely for mammography) should be avoided because it may negatively affect contrast enhancement. Scanners with a magnetic field strength of 1.5 Tesla (T) or 3.0 T provide the best signal-to-noise ratio. Magnets with high-performance gradients enable the fastest, highest-resolution scans (Box 7-3).
MRI Protocols
Conventional breast MRI begins with T1-weighted images to define the position and anatomy of the breast. T1-weighted images using the signal from the “body coil” rather than the breast coil enable basic evaluation of the axillae, anterior mediastinum, chest wall, and supraclavicular fossa for enlarged regional lymph nodes. Thereafter, a dedicated breast coil signal should be used to perform all subsequent sequences. T2-weighted fast spin-echo (FSE) images are then obtained to characterize the breast and any lesions. T2-weighted scans using an FSE, turbo spin-echo (TSE), or rapid acquisition with relaxation inhibition (RARE) technique, produce high-quality images within reasonable scan times of 5 to 6 minutes. High fat signal on T2-weighted FSE images can be prevented with fat suppression and is most successful if unilateral scanning is performed (Table 7-2).
| Series | Description | Purpose |
|---|---|---|
| 1 | Axial T1 or STIR | Show lymph nodes and overall anatomy; localization |
| 2 | Fast T2* | Map cysts, ducts; assess lesion T2 |
| [3] | Diffusion-weighted EPI† | Assess lesion ADC |
| 4 | 3-D T1 fat-saturated spoiled gradient echo; 90 seconds or less‡ | Baseline prior to contrast injection |
| 5 | Repeat series 4 over 7–12 min with contrast§ | Assess contrast enhancement morphology and kinetics |
| [6] | 1H spectroscopy¶ | Measure choline |
| N/A | Postprocessing | Enhancement curves, subtraction, 3-D, measurements, parametric maps |
Sagittal imaging for all scans except series 1 allows smallest field of view (∼20 cm for most patients) and thus highest resolution.
Frequency encoding in the anteroposterior direction minimizes artifacts from cardiac and respiratory motion in the breast.
Series in brackets are optional, and not yet standard of care.
1H, proton (hydrogen nucleus); ADC, apparent diffusion coefficient; EPI, echo-planar imaging; FOV, field of view; FSE, fast spin echo; Gd-DTPA, gadolinium diethylenetriamine pentaacetic acid; IPAT, integrated parallel acquisition techniques; NEX, number of excitations or signal averages; RARE, rapid acquisition with refocused echoes; SENSE, sensitivity encoding; STIR, short tau inversion recovery; TE, echo time; TR, repetition time; TSE, turbo spin echo.
* T2: Fast spin-echo (FSE, RARE, TSE, etc.) with effective TE 80–100 ms and TR at least 3000 ms provides good T2 weighting. Use 3- to 4-mm-thick slices and 256×192 matrix or higher for small FOV sagittal images. Fat saturation improves conspicuity of bright lesions on T2, although nonfat-suppressed T2 imaging allows fat signal intensity to be used as a reference signal intensity. Volume shimming improves fat suppression.
† B-values have not been standardized yet, but most investigators use 500–1000 with good results. Parallel imaging may reduce distortions in echo planar imaging.
‡ Both fat suppression and high spatial resolution (<2 mm in all directions) are essential to assess lesion morphology. Rapid imaging (60–90 sec per scan or less) is necessary to assess contrast uptake kinetics. Use “fast” spoiled 3-D gradient echo (TR ≤ 6 ms; FA ∼ 15° for T1 weighting). Intermittent “special” fat saturation pulses speed imaging substantially over conventional fat saturation. Fractional k-space (“1/2 NEX,” etc.), and parallel imaging (SENSE/IPAT, etc.) maximize resolution obtained during the limited scan time.
§ Repeat rapidly for dynamic scans totaling approximately 7 minutes or more. Inject 0.1 mmol/kg standard low molecular weight gadolinium contrast agent (e.g., Gd-DTPA, gadoteridol, etc.) at 2 mL/sec followed by 20 mL flush (normal saline) at the start of the acquisition. Avoid negatively charged gadolinium agents if protocol includes spectroscopy, because they may reduce choline signal. (Lenkinski B, Wang X, Elian M, Goldberg SN: Interaction of gadolinium-based MR contrast agents with choline: implications for MR spectroscopy (MRS) of the breast, Magn Reson Med 61(6):1286–1292, 2009.
¶ Single-voxel choline spectroscopy. A minimum voxel size of 1 cm × 1 cm × 1 cm is recommended for adequate signal-to-noise. Localized shimming and high-quality spatial saturation pulses, fat suppression, and partial water suppression improve quality of spectra.
The Normal Breast MRI
Normal Breast MRI Findings
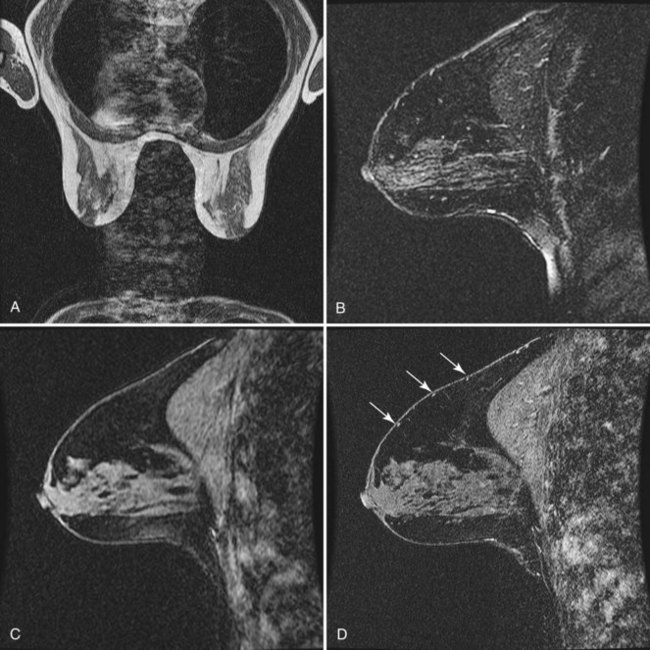
Typical images from a normal patient who underwent both bilateral dynamic and high-spatial resolution imaging are provided in Figure 7-4. On T1-weighted noncontrast-enhanced images, aqueous tissues (including skin, fibroglandular tissue, muscle, and lymph nodes) have moderately low signal intensity when compared with the higher signal intensity of fat, which has a short T1 relaxation time. In the absence of previous surgery or pathology, a layer of subcutaneous and retromammary fat completely surrounds the mammary gland tissue except where it enters the nipple–areola complex. The mammary gland itself is composed of a mix of low-signal fibroglandular tissue and high-signal fat lobules. The mix and distribution of fat and fibroglandular tissue vary greatly between patients—from dense, uniformly glandular tissue with almost no visible fat, to heterogeneous, to predominantly fatty tissue separated by thin strands or septa of fibroglandular tissue. In the ACR Breast Imaging Reporting and Data System (BI-RADS®) MRI lexicon the amount of dense glandular tissue by volume is described in the same terms as used in the mammography lexicon. These include almost all fat (0% to 25% dense), scattered fibroglandular tissue (25% to 50% dense), heterogeneously dense (50% to 75% dense), or dense (>75% dense) (Box 7-4 and Fig. 7-5).

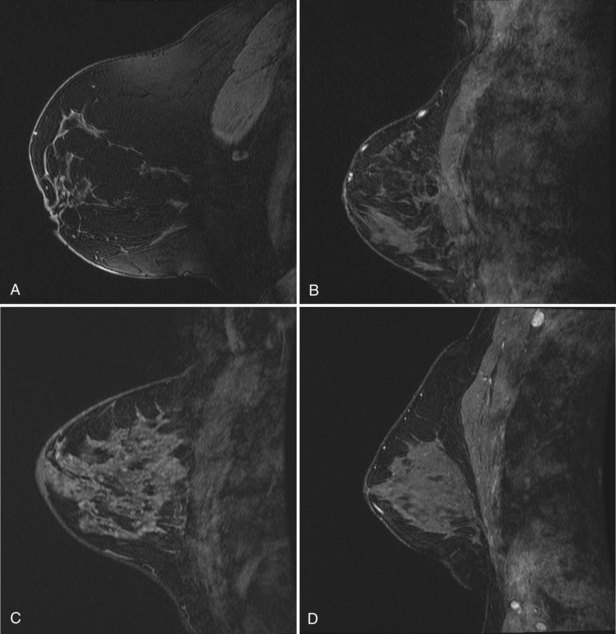
After contrast injection, normal glandular tissue enhances to variable degrees. Normal fibroglandular breast tissue enhancement is called background enhancement in the BI-RADS® lexicon. An understanding of normal background enhancement is important because normal background enhancement can obscure cancers and make the MRI harder to read. Background enhancement describes slowly enhancing breast tissue within the breast. Specifically, normal fibroglandular tissue enhances with nonmasslike patterns, including stippled enhancement (tiny <5 mm foci of enhancement separated by normal tissue); scattered, regional, or multiple regions; or diffused stippled enhancement throughout both breasts. The areas of enhancement are usually separated by nonenhancing normal breast tissue between the normal background enhancing foci. In the BI-RADS® lexicon, the amount of background enhancement is described as a percentage of enhancing breast tissue with respect to the volume of the entire breast. Background enhancement is categorized in quartiles. The descriptors include none (0%), minimal (1% to 25%), mild (25% to 50%), moderate (50% to 75%), and marked (>75%) (Box 7-5 and Fig. 7-6).
Common Breast MRI Artifacts
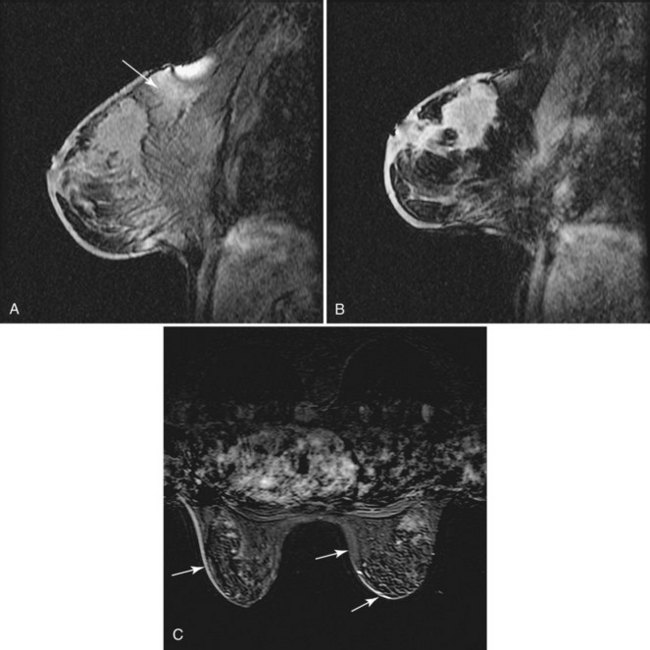
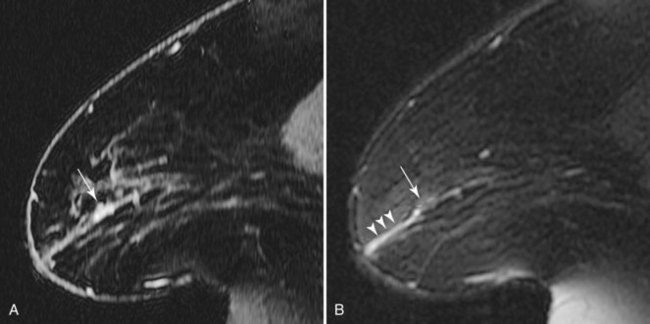
Ghosting from cardiac or respiratory motion occurs in the phase-encoding direction (Table 7-3). It can be prevented from obscuring breast tissue by careful selection of phase- and frequency-encoding directions. Poor fat suppression is usually due to poor shimming or incorrect choice of the excitation center frequency, especially in patients with silicone implants (Fig. 7-7) or non–MRI-compatible objects, such as BB markers, magnetic tissue expanders, scar markers, and metal infusion ports, in or near the breast. Patient motion may cause blurring of the image, so it is especially important that the patient hold still and breathe quietly during scanning. On subtraction imaging, patient motion causes alternating bright and dark bands at fat–glandular tissue interfaces (see Fig. 7-7).
| Artifact | Cause |
|---|---|
| Line(s) of noise | Electronic noise/poor room shielding/scan room door open |
| Ghosting from heart across the breast | Wrong frequency-encoding direction |
| Blurring | Patient motion |
| Bright and dark edges on subtraction | Patient motion |
| Poor enhancement | Slow or failed contrast injection |
| Poor fat suppression | Poor shimming or center frequency, non-MRI compatible skin marker left on breast |
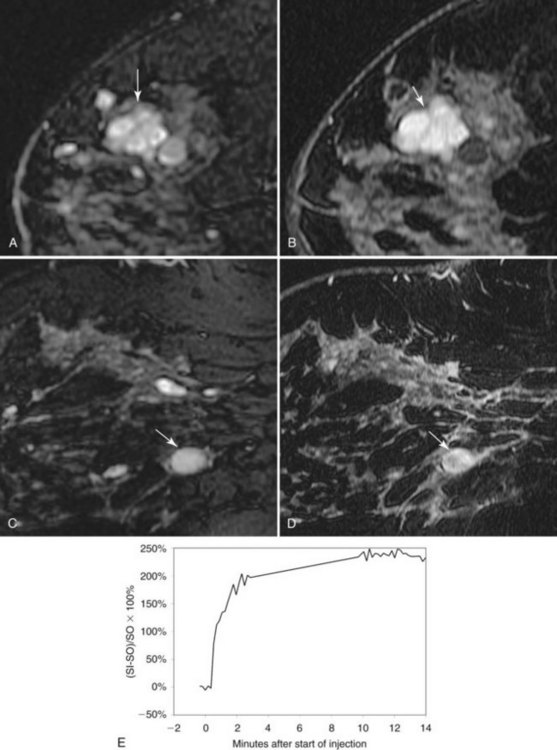
Poor breast tissue enhancement may be due to failed contrast injection, which can be confirmed by abnormal dynamic enhancement curves from the heart. The heart usually shows normal rapid, avid initial enhancement and rapid washout. In fact, one of the most common errors in contrast-enhanced breast MRI is the result of a poor bolus of IV contrast. Sometimes, the IV line is injected slowly or may even become detached from the vein; as a result, the contrast never enters the patient. To ensure rapid uptake of contrast and washout of signal intensity within the heart, one checks a region of interest over the heart or a large artery for a rapid intake bolus and late washout on the kinetic curve. This is important because only a good bolus of contrast will translate into breast cancer enhancing rapidly on the MRI scans. An abnormal or poor cardiac kinetic curve tells the radiologist that something is wrong with the contrast injection; further investigation is needed to determine why contrast in the heart did not rise in signal intensity rapidly and washout as expected. Scans that show poor contrast enhancement in the heart indicate a problem with the contrast injection and cannot be trusted to show cancer in the breast (Fig. 7-8).
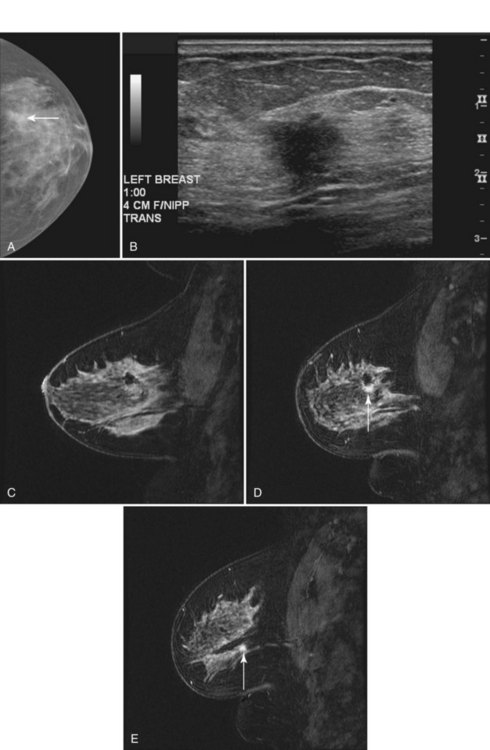
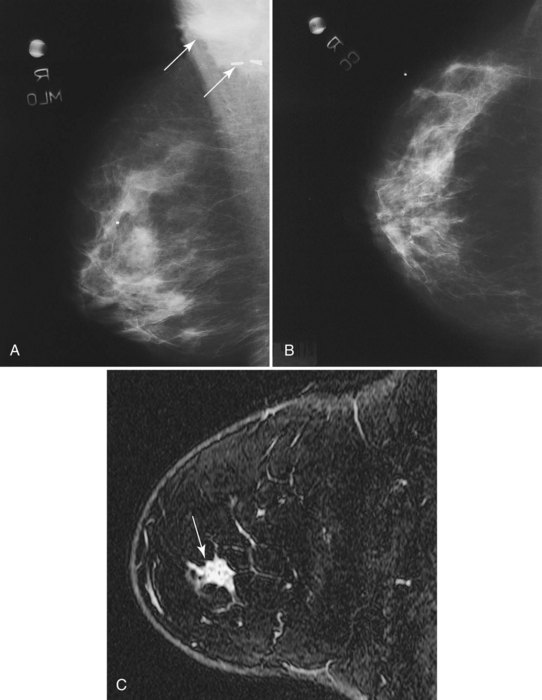
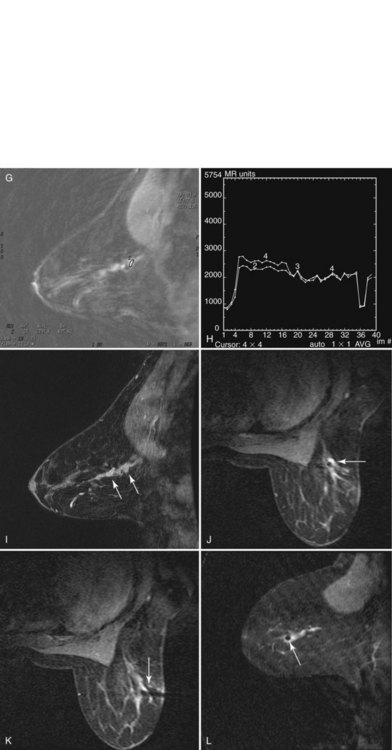
 minutes, it shows an enhancing tumor at the signal void (arrow). E, In addition, a 6-mm mass is noted inferior to the main cancer; this was not seen previously and was undetectable in the background enhancement (arrow).
Breast Lesions: Approach and Lexicon
To interpret studies of lesions on MRI, radiologists use a combination of high-spatial resolution scanning (which produces sharp images for analysis of abnormally enhancing findings or produces analysis by lesion morphology) and dynamic imaging (which produces the kinetic curves of an abnormally enhancing finding). In addition, T2-weighted imaging plays a secondary role in distinguishing some benign and malignant lesions (Table 7-4).
| T2 > Glandular Tissue or Muscle | T2 ≤ Glandular Tissue | |
|---|---|---|
| Enhances with contrast |
* The exceptions are rare mucinous carcinomas and some invasive ductal cancers, which may enhance and have high T2 signal; irregular, rim-enhancing morphology and dynamic enhancement curves may help with diagnosis.
Morphology
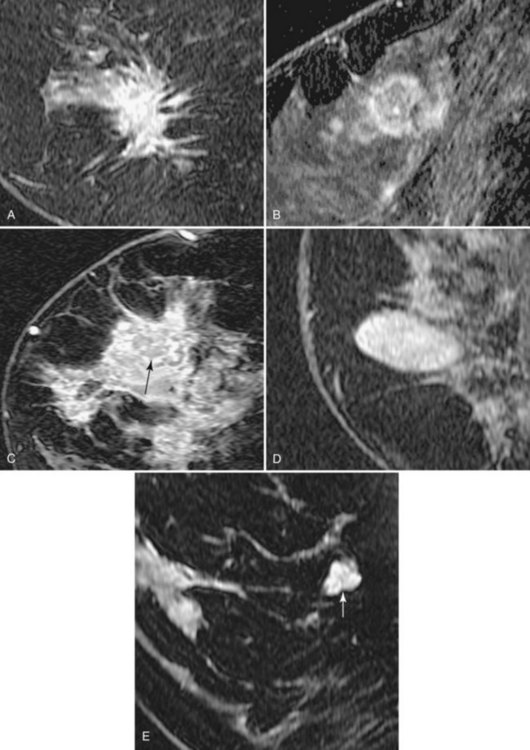
In the high-spatial resolution approach, lesion morphology is evaluated on fat-nulled, 3-D images to look for characteristic shapes, borders, or internal enhancement patterns characteristic of cancer. With this approach, Nunes and colleagues reported a sensitivity of 96% and a specificity of 80% for cancer. Leong and colleagues reported similar results. The morphologic characteristics of benign and malignant lesions are summarized in Table 7-1 and Box 7-6, and are shown in Figure 7-9. As discussed elsewhere in this chapter, the radiologist first decides if the finding is a mass or a nonmasslike enhancement. Consistent with mammography, masses with spiculated or very irregular borders are suspicious. Bright enhancement, particularly rim enhancement and enhancing septations, is usually suspicious for tumor angiogenesis. A ductal, linear, or segmental pattern of clumped enhancement is suspicious for ductal carcinoma in situ (DCIS), but it can also be seen in benign duct ectasia or fibrocystic change. As with mammography, entirely smooth, oval, or lobulated masses oriented parallel to Cooper ligaments suggest benign lesions, whereas lesions traversing Cooper ligaments are abnormal and suggest invasive ductal cancer. Nonenhancing internal septations in smooth, oval, or lobulated masses are highly specific for a benign fibroadenoma. Nonenhancing lesions are also benign. However, it is important to evaluate the dynamic curves of benign-appearing enhancing masses because round or oval homogeneous cancers mimic benign fibroadenomas. Sometimes the suspicious kinetic curves may be the only clue that the morphologically benign mass is a cancer.
Dynamic Contrast Enhancement
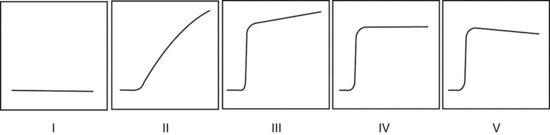
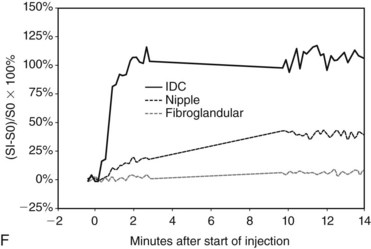
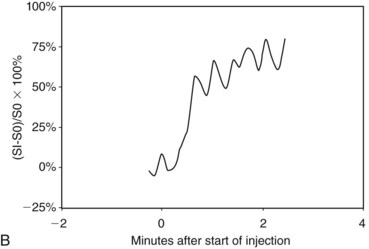
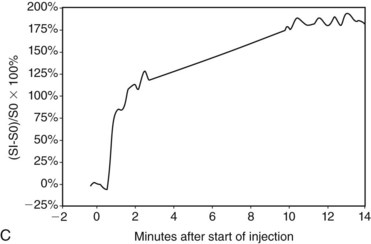
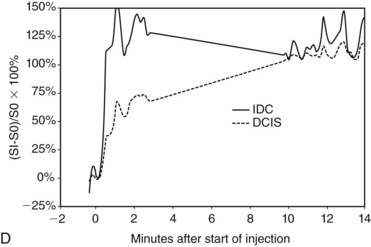
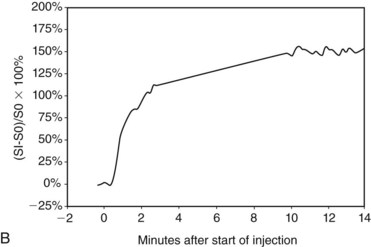
In the dynamic MRI approach, one evaluates a lesion’s signal intensity as a function of time during the bolus IV administration of contrast material (Box 7-7). The dynamic curves are evaluated according to initial and late enhancement. Initial enhancement describes the curve in the first 2 minutes during the bolus or when the curve begins to change. The late phase of enhancement occurs after the first 2 minutes or after the curve starts to change. The late-phase curve is described as persistent, plateau, or washout, in keeping with the ACR BI-RADS® MRI lexicon. The entire spectrum of the time course of enhancement may be categorized from most benign to most suspicious, according to the following scheme of Daniel and colleagues (Fig. 7-10): nonenhancing (type I), gradually enhancing (type II), or rapidly enhancing with a sustained gradual enhancement, plateau, or early washout (types III, IV, and V, respectively). In reference to the curve shapes depicted in Figure 7-7, types I and II typically indicate benignancy and types IV and V indicate a high likelihood of malignancy. Type III curves are indeterminate. Using a similar approach, Kuhl and colleagues reported a sensitivity of 91% and a specificity of 83%. Kuhl type I curves are gradually enhancing with a late persistent plateau. Kuhl type II curves are rapidly enhancing with a late plateau. Kuhl type III curves are rapidly enhancing with a late rapid washout. There are a few exceptions to these general principles. DCIS may exhibit any of the curve types, including nonenhancing or gradually enhancing curves, shown as types I and II in Figure 7-7. Benign papillomas may exhibit type I, II, III, or even type IV curves shown in Figure 7-7. The geographic distribution of dynamic enhancement also appears to be predictive, with tumors usually enhancing most rapidly at their periphery and benign lesions enhancing most rapidly at the center.
T2-Weighted Imaging
T2-weighted imaging also plays an important role in discriminating which enhancing lesions are likely to be benign or malignant (Fig. 7-11; see also Tables 7-1 and 7-4). Lesions with very high signal, in which the lesion is much brighter than glandular tissue and even higher than fat on nonfat-suppressed T2-weighted FSE images, suggest benign lesions such as cysts, fluid-filled ducts, lymph nodes, or fibroadenomas. Invasive tumor, on the other hand, usually has a T2 signal similar to that of glandular tissue, that is, higher than muscle but not as high as fluid. Low-signal septations within very high-signal smooth oval or lobulated lesions on T2-weighted imaging also suggest benign fibroadenomas. Exceptions to this “rule” include mucinous cancer, which can be very bright on a T2-weighted image. Some invasive ductal cancers also may be bright on T2-weighted images. These T2-bright cancers may show irregular margins and inhomogeneity; however, it is important to check kinetic curves on all masses because occasionally cancer may be round or oval and have smooth borders.
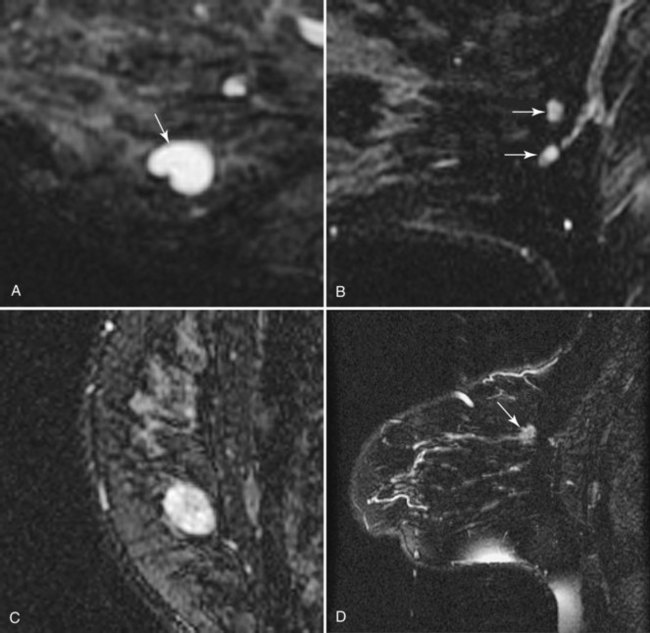
Figure 7-11 T2-weighted imaging features of benign and malignant disease. Very high signal on T2-weighted fast spin-echo images that is brighter than fat (on nonfat-suppressed sequences) and substantially brighter than glandular tissue suggests a benign lesion such as a cyst (A, arrow), intramammary lymph node (B, arrows), or fibroadenoma (C). Low-signal septa are particularly specific for fibroadenoma (see Fig. 7-18A). D, Most malignancies, unless frankly necrotic, have a signal intensity that is similar to that of fibroglandular tissue (arrow).
Approach to Interpretation and Reporting of Breast MRI
The ACR BI-RADS® provides a valuable standard for the terminology used to analyze breast lesions on MRI (Table 7-5) and is recommended for all breast MRI reporting. First, reporting should include a brief summary of the scan technique, including the scanner, field strength, and pulse sequences used; the specifics of contrast injection; and imaging findings and management recommendations.
Table 7-5 American College of Radiology BI-RADS®–MRI Lexicon Terms and Classification Scheme
Note: Stippled = nonconfluent < 2 mm dots of enhancement, sand-like. Heterogeneous = confluent and non-confluent, mixed enhancement. Clumped = confluent regions of enhancement, like cobblestones. Homogeneous = confluent, diffuse enhancement.
Reporting of kinetic data should also include the size of the region of interest used to generate the kinetic data and the location (i.e., edge, center, entire lesion), as well as the overall degree of enhancement (i.e., mild, moderate, strong).
Adapted from American College of Radiology: ACR BI-RADS®—MRI, In ACR Breast Imaging and Reporting and Data System, breast imaging atlas, Reston, VA, 2003, American College of Radiology.
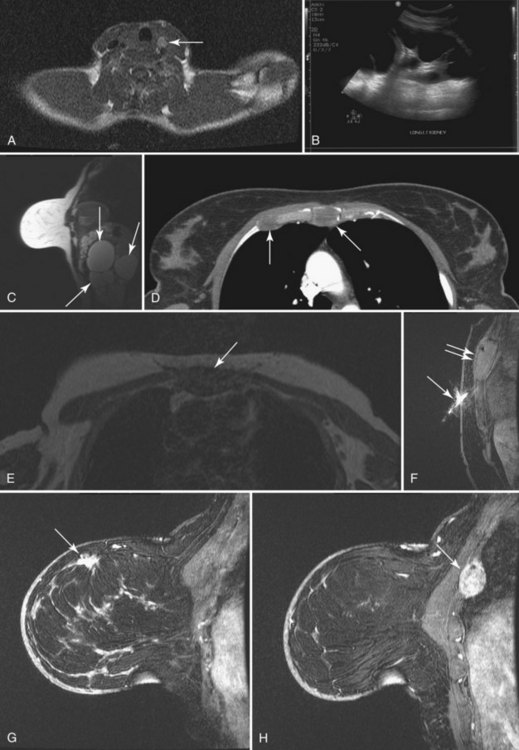
To read the MRI, the radiologist reviews the breast history, clinical symptoms, and results of other imaging tests, such as mammogram, ultrasound, and positron emission tomography/computed tomography (Box 7-8). The radiologist then reviews the T1-weighted axial localizer to evaluate any findings outside the breast. These findings can be seen on either coronal or axial scout images, including fat-suppressed T1-weighted noncontrast axial images. Prior studies looking at findings in the thorax or abdomen outside the breast show lymph nodes within the mediastinum, supraclavicular regions, and other areas that the radiologist may not commonly search. Abnormal findings found elsewhere in the body on the breast MRI include lung cancer, bone metastases, liver lesions (most commonly liver cysts or hemangiomas), thyroid masses, and adrenal or renal masses (Fig. 7-12). A systematic search of the T1-weighted axial images and of the thorax (similar to evaluation of computed tomography scans) helps detect unexpected lesions in the thyroid, mediastinum, lungs, liver, spleen, adrenals, kidneys, and the bony thorax.
Box 7-8 Organized Approach to Breast MRI Interpretation
Breast history and old imaging reports
Review breast and nonbreast anatomy (thyroid, lungs, mediastinum, chest wall, liver, spleen, adrenals, kidneys, bones)
Review axillary lymph nodes (supraclavicular, level I–III, Rotter nodes)
T2-weighted scout noncontrast fat-nulled source
First postcontrast scan with fat nulled, suppressed, subtracted
Estimate background enhancement
High signal findings (higher than background)
Region of interest in heart: Check for good IV contrast bolus
If good bolus: check kinetics on important findings
Next, the radiologist looks at imaging findings on the first postcontrast scan. Specifically, the first postcontrast scan should have marked enhancement in the heart, blood vessels, and any rapidly enhancing finding, such as cancer or lymph nodes. The scans are usually obtained with the middle of k-space at approximately 90 seconds after the injection of contrast. The radiologist looks for the whitest part of the image and the background enhancement, which represents enhancement greater than normal background enhancement. Multiple foci in background enhancement represent normal findings; the radiologist judges whether it is normal or abnormal based on morphology, symmetry, kinetics, and change over time (Fig. 7-13). Abnormal enhancement findings would then be classified into either normal findings, for which nothing needs to be done, or abnormal findings, which need to be investigated further.
If the finding is a nonmass, it should be further classified using the terms focus, focal area, linear, ductal, segmental, regional, multiple regions, or diffuse enhancement, as described by the ACR BI-RADS® lexicon (see Table 7-5). The radiologist further evaluates whether the finding is bilaterally symmetric or if it is asymmetric. Asymmetric findings are more likely to be cancer than symmetric findings are. The radiologist then evaluates the pattern of more masslike enhancements because clumped or cobblestonelike enhancement is worrisome for DCIS. In general, DCIS can grow within the ducts and expand them but may not show abnormal kinetic enhancement characteristics. Thus, the radiologist evaluates the nonmasslike enhancement for its kinetic curves. But if the morphology is suspicious, biopsy should be done because DCIS may not show abnormal enhancement kinetics.
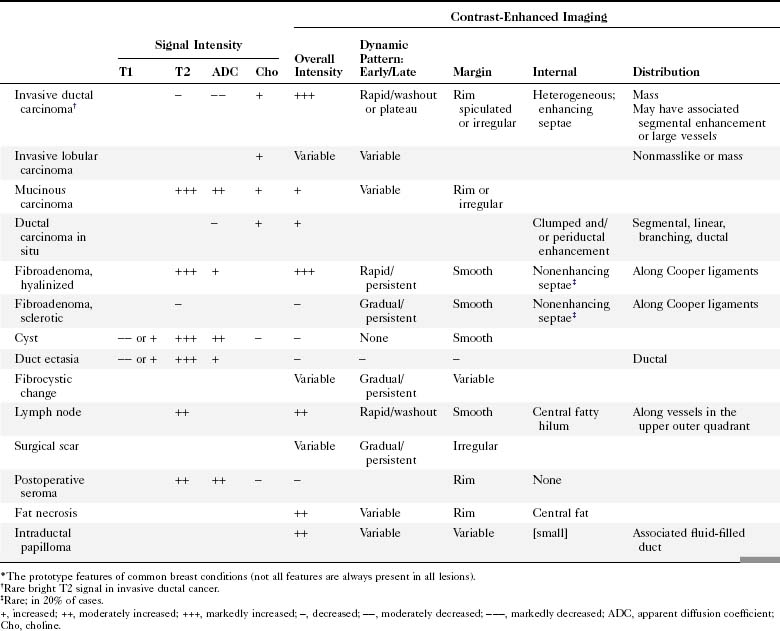
Table 7-1 shows noncontrast T1 and T2 characteristics of benign and malignant conditions. It also details the kinetic enhancement features of these conditions. These morphologic, characteristic, and kinetic conditions help distinguish cancer from benign lesions. Cancers are usually dark on both T1 and T2 with an early, rapid enhancement rise and a late plateau or washout. Lymph nodes are typically dark on T1, bright on T2, and also have a rapid initial enhancement and late washout. However, the lymph nodes are usually found in the upper outer quadrant of the breast and have a fatty hilum seen on the T1- and T2-weighted images. A papilloma is indistinguishable from breast cancer and is a common cause for false-positive biopsies. Mucinous cancer is dark on T1 and bright on T2 but can be distinguished from a cellular fibroadenoma by kinetic curves. The mucinous cancer has a rapid initial enhancement and washout in a late phase, whereas the fibroadenoma has a late-phase persistent enhancement curve. Notice that cellular fibroadenomas, mucinous cancer, and cysts are bright on noncontrast T2-weighted scans. However, it is also known that some invasive ductal cancer may be bright on T2-weighted scans, so it is especially important to look at the kinetic curves of any mass. DCIS is mostly detected and diagnosed by its morphology because the kinetic curves in DCIS can be variable.
Unfortunately, not all benign findings or cancer follow “the rules.” Exceptions to the usual enhancement paths are shown in Boxes 7-9 and 7-10.
Box 7-9 Common False-Positives: Conditions That Simulate Malignancy
Fibrocystic change, hormone-related enhancement, or focal fibrosis, especially if unilateral and regional or if in a ductal/segmental distribution mimicking ductal carcinoma in situ
Radial scar, especially if spiculated and rapidly enhancing
Surgical scar, especially if speculated
Fat necrosis, especially if rim enhancing or lacking macroscopic central fat
Intraductal papilloma, especially if irregular, rapidly enhancing, and not associated with symptoms or a dilated duct
Fibroadenoma, especially if rapidly enhancing (hyalinized) and lacking a high T2 signal
Intramammary lymph node, especially if in an unusual location, lacking a visible fatty hilum, and not associated with a feeding vessel
Box 7-10 Common False-Negative Tumors on Breast MRI
Nonenhancing ductal carcinoma in situ (DCIS)
Nonenhancing invasive lobular carcinoma
Smoothly marginated mucinous tumor with bright T2 signal mimicking a fibroadenoma
Residual poorly enhancing tumor, especially DCIS during or after chemotherapy
Gradually enhancing tumor surrounded by simultaneous vigorous background enhancement (e.g., from scanning at the wrong time in the menstrual cycle)
Breast MRI Atlas
Table 7-6 shows a simplified guide to breast MRI interpretation.
Benign Breast Conditions
Fluid-filled cysts and milk ducts are normal and occur frequently (Fig. 7-14). Simple cysts are round or oval with sharp margins. Adjacent cysts may be separated by thin, low-signal septations. Simple cysts have very high T2 signal and display no internal enhancement with contrast, although a faint thin rim of gradual enhancement may be seen on high-resolution images. Occasionally, benign cysts may demonstrate high signal on unenhanced T1-weighted images, with corresponding lower signal on T2-weighted images, presumably because of their protein content. Dilated fluid-filled ducts are linear, radiate from the nipple, and may branch. Their signal and enhancement characteristics are the same as for cysts.
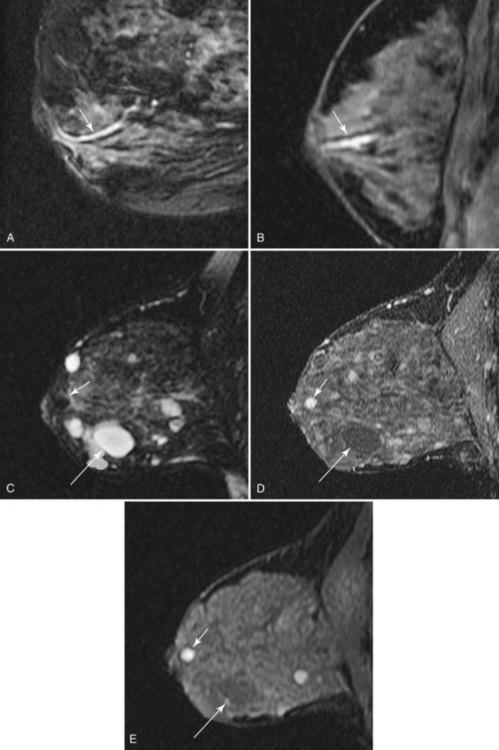
Figure 7-14 Normal variants. A, Dilated milk ducts cause linear high signal extending from the nipple (arrow) on fat-suppressed T2-weighted fast spin-echo images. B, Ducts may also demonstrate high signal (arrow) on unenhanced T1-weighted images and variable signal on T2-weighted images, presumably because of the high protein content. Unlike ductal carcinoma in situ (see Fig. 7-25), they do not enhance with contrast. C, Benign cysts cause focal, well-circumscribed high signal (large arrow) on T2-weighted images. D, Normal benign cysts do not enhance, but they may be surrounded by a faint rim of gradual enhancement (large arrow). E, Like ducts, some benign cysts may appear bright (small arrow) on unenhanced T1-weighted images.
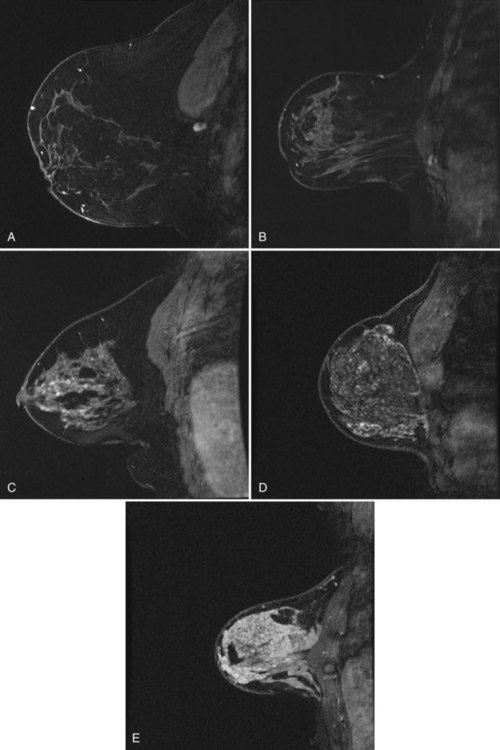
Hormone-related enhancement occurs in premenopausal women and women taking oral contraceptives (Fig. 7-15), and is a cause for normal background enhancement, which on occasion may be moderate or marked. Usually, diffuse gradual glandular enhancement is seen, and it is commonly bilateral and symmetric. Dynamic enhancement is generally gradual and progressive (Daniel type II, III; Kuhl type I); thus, the appearance is rarely confused with invasive carcinoma on dynamic imaging. Less commonly, hormone-related enhancement may be focal (see Fig. 7-15) and may resemble lobular carcinoma or DCIS. Hormone-related enhancement is minimized by scanning during the second week of a woman’s menstrual cycle.
Fibrocystic change is commonly associated with focal (geographic) or regional nonspecific enhancement, especially in premenopausal women (Fig. 7-16), with gradual early enhancement, and with sustained gradual late enhancement. Occasionally, a specific diagnosis can be made by the presence of tiny associated microcysts (see Fig. 7-16). Adjacent cysts do not necessarily exclude carcinoma, however, so careful scrutiny of all enhancing foci remains essential to exclude concurrent malignancy.
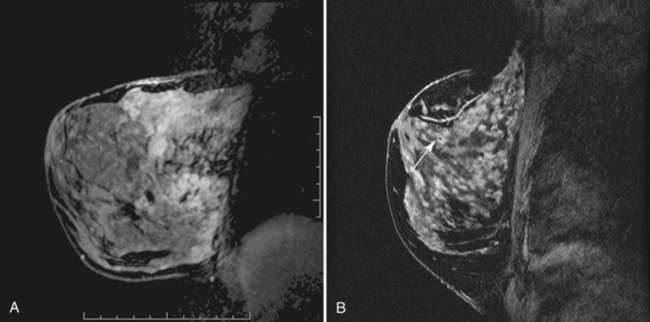
Intramammary lymph nodes are common, especially in the upper outer quadrant and along blood vessels (Fig. 7-17). Typically, intramammary nodes are small (≤5 mm) and have uniform high T2 signal. They are sharply circumscribed oval or kidney bean-shaped masses that have a central fatty hilum. On dynamic imaging, they enhance avidly and rapidly, with a rapid initial enhancement and a late-phase plateau or early washout, and hence cannot be distinguished from malignancy based on dynamic criteria alone. However, a definitive diagnosis is usually possible when lesion morphology shows their fatty hilum and close proximity to blood vessels with a “grapes on a vine” appearance. Correlation with sonography may avoid biopsy in cases in which location or morphologic criteria remain inconclusive. MRI is not as reliable as sentinel node sampling in determining the presence or absence of intranodal metastases. Abnormal lymph nodes become rounder, enlarge from prior studies, and lose their fatty hilum. Lymphadenopathy can also be diagnosed when the node becomes completely replaced by metastases and becomes dark (instead of light) on T2.
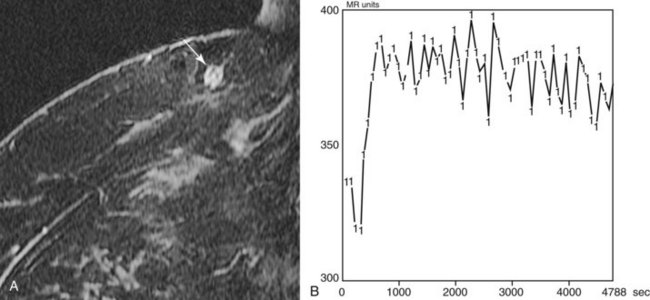
Figure 7-17 Intramammary lymph node. Usually small and located in close proximity to superficial vessels in the upper outer quadrant and axillary tail of the breast, lymph nodes demonstrate high signal on T2-weighted images (see Fig. 7-11B). A, All lymph nodes enhance rapidly and brightly with contrast (arrow), usually with a Daniel type IV or type V time course of enhancement (B). A normal fatty hilum can cause central low signal on fat-suppressed or subtracted images that mimics rim enhancement.
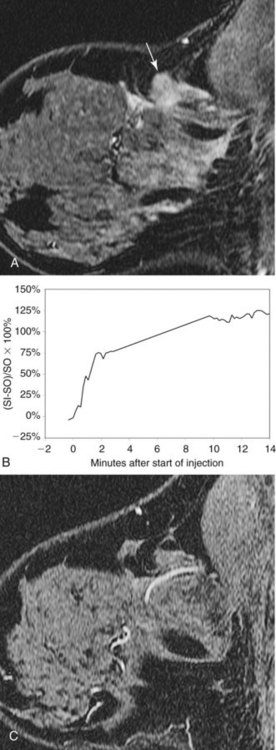
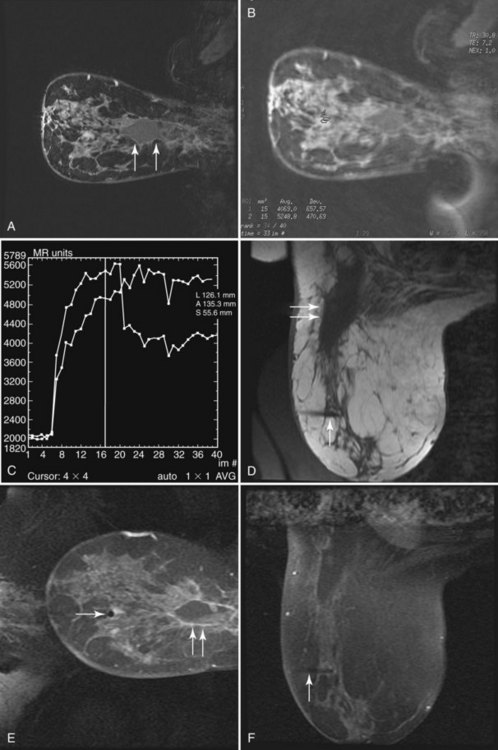
Fibroadenoma is usually an oval or macrolobulated, sharply marginated, avidly and uniformly enhancing mass (Figs. 7-18 and 7-19). Young cellular fibroadenomas are very bright on noncontrast fat-suppressed T2-weighted scans. Later sclerotic fibroadenomas may be dark on T2-weighted scans. Nonenhancing internal septations are seen occasionally in about 20% of benign cellular fibroadenomas. Of note, nonenhancing internal septations may very rarely be seen in mucinous cancer, so kinetic curves on benign-appearing masses should be evaluated to distinguish fibroadenomas from T2-bright mucinous or ductal cancer. On dynamic imaging, most fibroadenomas show early gradual enhancement with sustained late gradual enhancement. Young fibroadenomas may have a more rapidly enhancing curve with sustained late-phase gradual enhancement, and they may occasionally demonstrate a late plateau of signal intensity that overlaps with the appearance of some invasive carcinomas. However, unlike many invasive carcinomas, the earliest, most avid enhancement is frequently central rather than peripheral. Among rapidly enhancing well-circumscribed masses, very high T2 signal is suggestive of benign fibroadenoma; the lack of very high T2 signal implies that malignancy cannot be excluded. The rare, well-differentiated phyllodes tumor has an appearance similar to that of fibroadenomas. Degenerating fibroadenomas, seen in older patients, do not enhance significantly and may have irregular internal signal voids that correspond to the large, coarse “popcorn” calcifications seen mammographically.
Intraductal papilloma has a wide variety of appearances. On MRI, a papilloma may have a round masslike structure that has a rapid enhancement initial rise and washout in a late phase that is indistinguishable from breast cancer. Before MRI, most papillomas were identified by the presence of abnormal nipple discharge, an intraductal filling defect on galactography, or an intraductal mass on ultrasound. The analogous “classic” findings on MRI are an avidly enhancing mass at the posterior end of a fluid-filled duct (Fig. 7-20). However, a fluid-filled duct is not necessarily present in all cases, and dynamic enhancement spans the entire range from nonenhancing to washout curves that mimic invasive carcinoma.
Breast Cancers
Invasive ductal carcinoma (IDC) is virtually always manifested as a focal, avidly enhancing mass, which is often irregular but may have any shape. Margins are usually irregular or spiculated (Fig. 7-21), but IDC may be more sharply defined or smooth in some cases. Rim enhancement and enhancing internal septations are particularly suspicious. Dynamic imaging reveals rapid initial enhancement followed by a plateau or early washout of signal intensity and is frequently most worrisome at the periphery of the lesion. T2 signal is similar to that of breast tissue; the lack of high signal distinguishes IDC from benign intramammary lymph nodes and fibroadenomas. However, there are some T2-bright cancers (mucinous cancers and some invasive ductal cancers), so kinetic evaluation is important. True central nonenhancing necrosis is rare. Direct skin or muscle invasion, growth of the tumor through Cooper ligaments, and architectural distortion are secondary signs of carcinoma; axillary lymph nodes that have become rounder and lost their fatty hila are worrisome for lymphadenopathy (Fig. 7-22).
Infiltrating lobular carcinoma (ILC) has a much more variable appearance than IDC does. A particularly unique appearance is enhancement that follows the course of normal fibroglandular elements without a substantial mass effect (Fig. 7-23), which may lead to a missed diagnosis. ILC can also appear as a solitary mass or a combination of multiple masses with or without enhancing intervening fibroglandular tissue. Rarely, ILC may not enhance enough to be distinguished from surrounding breast tissue. On dynamic imaging, lobular carcinoma may have any pattern; benign patterns of dynamic curves, such as either slow or rapid initial enhancement with sustained late-phase gradual enhancement, do not exclude lobular carcinoma.
Mucinous carcinoma, a rare breast cancer, is a round mass that may have a unique appearance on MRI (Fig. 7-24). The large central pool of mucin does not enhance and has very high T2 signal. Thus, mucinous carcinoma resembles a cyst, but with an irregular, thickened, avidly enhancing rim. Breast abscess may have a similar appearance. Alternatively, it may have irregular internal enhancement.
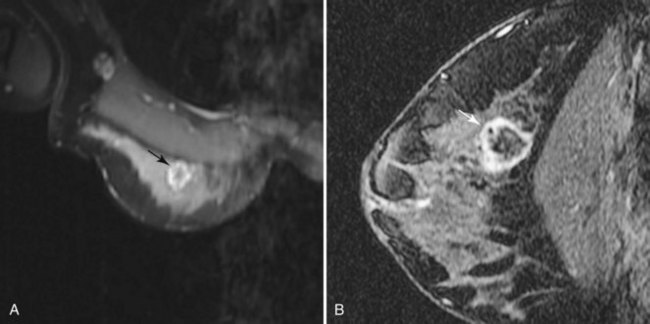
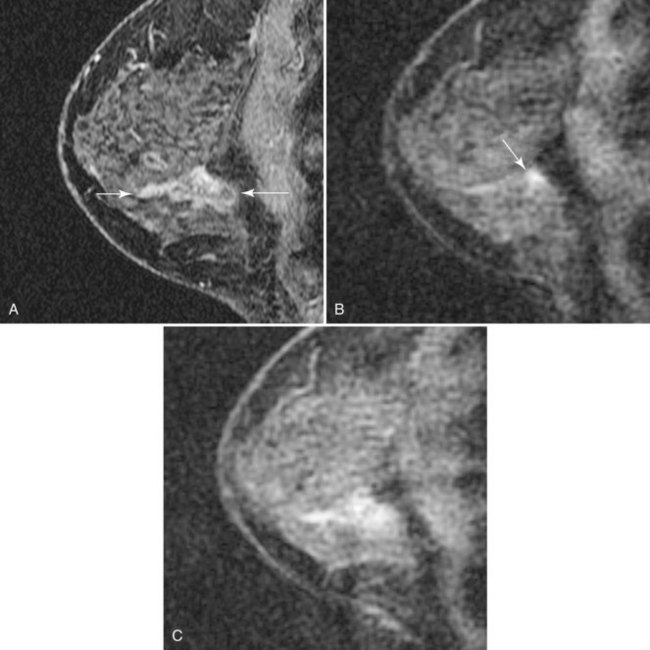
DCIS has a very wide range of appearances on MRI. The “classic” description is clumped enhancement in a ductal system distribution, including segmental enhancement, or linear/branching enhancement emanating from the nipple (Fig. 7-25). Ductal enhancement per se is present in only a minority of cases. An especially worrisome sign for DCIS includes clumped enhancement, which represents enhancement tumor following the duct, simulating a string of pearls or cobblestone appearance. This is due to the cancer growing and expanding the ductal system, without penetrating the duct basement membrane.
Diagnostic Limitations
Although the sensitivity of MRI is very high for invasive carcinoma, significantly higher than mammography or sonography in some settings, substantial diagnostic challenges remain (see Boxes 7-9 and 7-10). Common false positives mimicking DCIS include focal fibrocystic change, hormone-related enhancement, focal fibrosis, and fibroadenomatous change. False positives occasionally mimicking invasive carcinomas include rapidly enhancing intraductal papillomas, avidly enhancing fibroadenomas lacking high T2 signal, intramammary lymph nodes without a fatty hilum, rim-enhancing fat necrosis, radial scar, and enhancing spiculated surgical scars. False negatives remain rare; they are usually due to nonenhancing DCIS or ILC. Recent or ongoing chemotherapy may also reduce the sensitivity of contrast-enhanced MRI.
Indications
Large-scale randomized, controlled trials, similar to the early mammography studies, have not been reported to support the widespread general use of contrast-enhanced breast MRI at this time. However, utility has been demonstrated by smaller studies in many specific situations (Box 7-11).
Box 7-11 Accepted Indications for Contrast-Enhanced Breast MRI
Screening
ACS recommendations*BRCA mutation (BRCA1 or BRCA2)
First-degree relative of BRCA carrier, but untested
Lifetime risk of approximately 20% to 25% or greater, as defined by BRCAPRO or other models that are largely dependent on family history
Obscured breast tissue (e.g., previous free silicone injection)
Radiation to chest between age 10 and 30 (e.g., for Hodgkin disease)
Li-Fraumeni syndrome (p53 mutation) and first-degree relatives
Cowden and Bannayan-Riley-Ruvalcaba syndromes and first-degree relatives
Staging
Locate the breast primary in patients with axillary metastases
Evaluate opposite breast in patients with new, unilateral breast cancer
Evaluate the extent of cancer in patients with poorly evaluated breast tissue on mammography:
Evaluate the extent of cancer in tumors poorly seen on mammography:†
Ductal carcinoma in situ without corresponding microcalcifications
Goals of breast cancer staging MRI:
Plan lumpectomy to reduce the rate of transected tumor at specimen margins
Screening
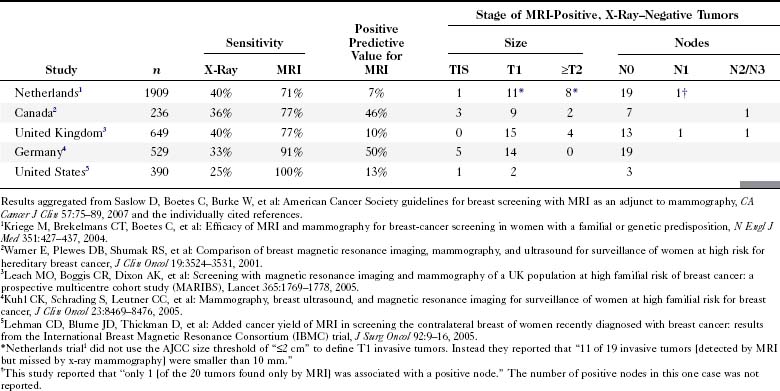
Improvements in genetic testing and counseling are identifying an increasing population of women who are at increased risk for the development of breast cancer. Current options include routine clinical and imaging screening with mammography or ultrasound and prophylactic mastectomy. MRI has recently been investigated as an adjunct to conventional imaging for screening. In one of the largest U.S. studies, Morris and colleagues detected 14 tumors in 367 BRCA1 and BRCA2 mutation carriers, individuals with a similar risk profile and negative initial mammograms (Fig. 7-26). This led to the 2007 recommendation by the American Cancer Society for cancer screening with MRI in the United States in women with a greater than 20% lifetime risk of breast cancer and in patients who have a history of treated Hodgkin disease (Table 7-7). Optimal MRI screening intervals and the age at which MRI screening should be initiated have yet to be determined.
Diagnosis
MRI is infrequently used to diagnose equivocal findings on mammography, sonography, or physical examination because the cost of MRI, including follow-up MRI, approaches the cost of the more traditional minimally invasive core biopsy. However, in rare instances, lesions are found that are not amenable to conventional biopsy, such as suspicious findings seen on only one mammographic view (Fig. 7-27). MRI is also used to evaluate patients with persistent bloody or cytologically abnormal nipple discharge in whom conventional galactography and ductoscopy were either unrevealing or unsuccessful. In addition, MRI is used to evaluate patients with equivocal findings on physical examination that are mammographically and sonographically occult. However, the potential for false-positive and equivocal findings that generate biopsy or follow-up MRI must be balanced against the accuracy of simple palpation-based biopsy in this setting.
Staging
• Patients with biopsy-proven axillary lymph node metastases of breast cancer origin and normal mammograms and ultrasound (Fig. 7-28). Although the primary treatment of these patients remains systemic therapy, MRI may identify an occult primary breast tumor that can be treated with breast-conserving therapy.
• Patients with equivocal chest wall invasion on imaging or physical examination (Fig. 7-29).
• Patients with breast tissue that is suboptimally imaged by mammography, especially those with dense breast tissue, silicone implants, or silicone injections obscuring the breast.
• Patients with tumors that are poorly seen on conventional mammography, including ILC or DCIS without corresponding microcalcifications.
• Patients who are going to undergo accelerated partial breast irradiation, in which only the breast cancer biopsy cavity and the margins around the cavity are treated with radiation therapy rather than whole-breast radiation.
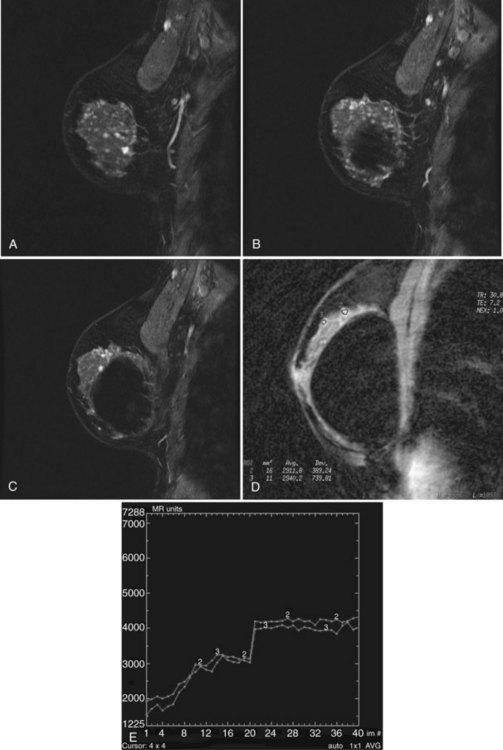
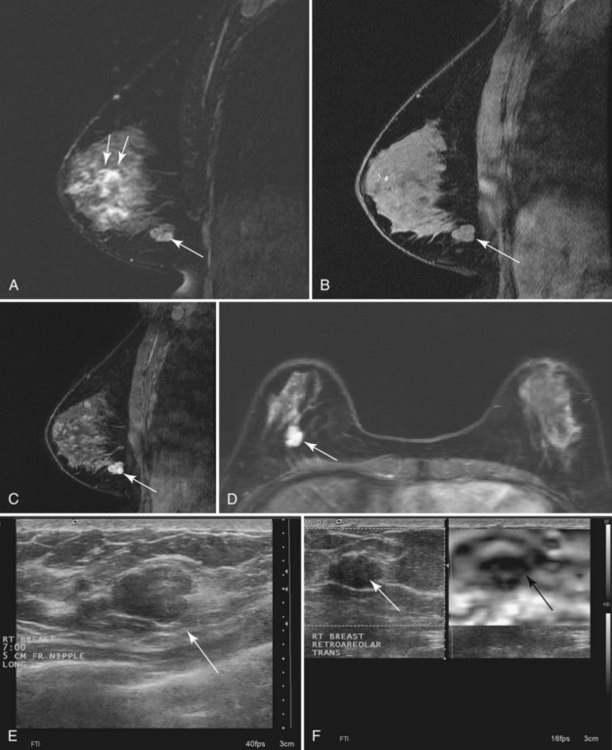
In these patients, MRI may be used to plan the shape of the lumpectomy in an attempt to minimize the chance of transecting tumor margins. MRI may also reveal mammographically occult multifocal carcinoma (Fig. 7-30) and thereby prompt wider local excision. In addition, MRI may reveal occult multicentric or bilateral carcinoma (Fig. 7-31). Recent papers indicate that mammographically occult contralateral carcinoma is detected in 3.8% to 5.4% of patients with unilateral carcinoma. In these circumstances, preoperative biopsy is critical to pathologically confirm multicentric carcinoma or bilateral carcinoma because MRI findings can be nonspecific and may even lead to more extensive surgery than necessary in occasional patients.
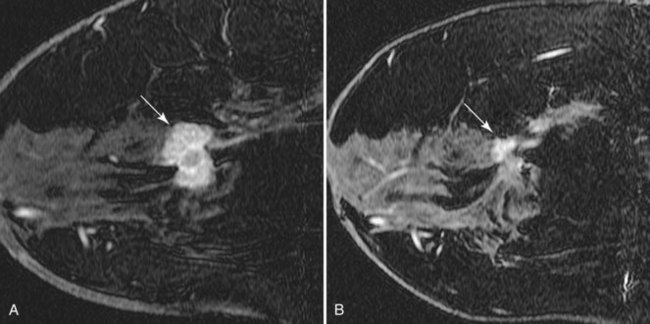
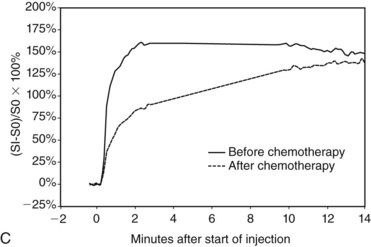
Management
Patients undergoing neoadjuvant chemotherapy are frequently imaged with breast MRI. Pretreatment scans provide the most accurate nonsurgical 3-D measurements of the extent of tumor. Scans performed after the first one or two cycles can detect a treatment response that may predict whether completion of chemotherapy will be successful. In patients who do respond, MRI after completion of chemotherapy can be used to identify and localize residual tumor, even in patients who have had a complete clinical response (Fig. 7-32). It is important to note that in these circumstances, the dynamic enhancement of tumors may be less specific and may even resemble benign disease. Indeed, any residual enhancement at the site of a previously known tumor is suspicious. Because of the poor specificity of MRI findings after chemotherapy, pretreatment MRI is essential as a baseline for comparison.
MRI-Guided Biopsy
Second-Look Ultrasound
Lesions that are detected by MRI must frequently be biopsied (Box 7-12). The easiest method of biopsy is to perform a “second-look” ultrasound examination directed toward the specific area of abnormality noted on MRI. If a corresponding lesion is seen, ultrasound-guided core needle biopsy is easily performed. Careful attention to technique is essential to ensure that the MRI abnormality corresponds to the sonographic lesion, given the difference in patient position and breast configuration between the two methods.
Studies evaluating MRI-detected findings with sonography show that ultrasound demonstrates a finding in between 23% and 90%. A 2010 study by Abe and colleagues showed that 57% (115/202) of MRI-detected findings were seen by ultrasound. Of the remaining 87 lesions undetected by ultrasound, II were cancer. Other studies by Ko and colleagues (2007), Linda and colleagues (2008), and Destounis and colleagues (2009) showed that 90%, 82%, and 70% of 10, 173, and 182 MRI-detected findings, respectively, were seen on second-look ultrasound.
Preoperative Needle Localization
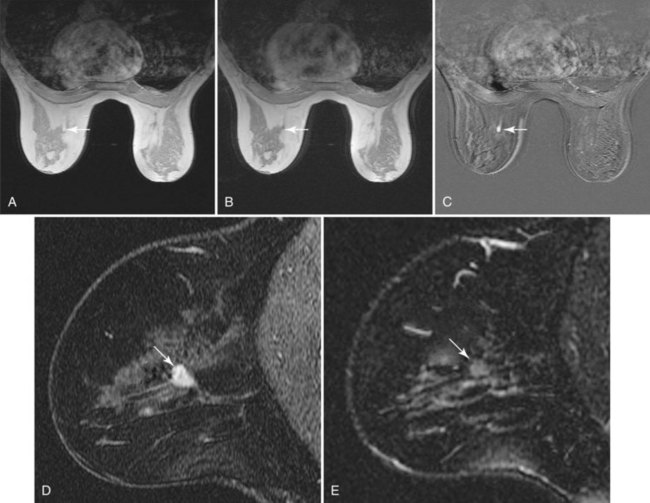
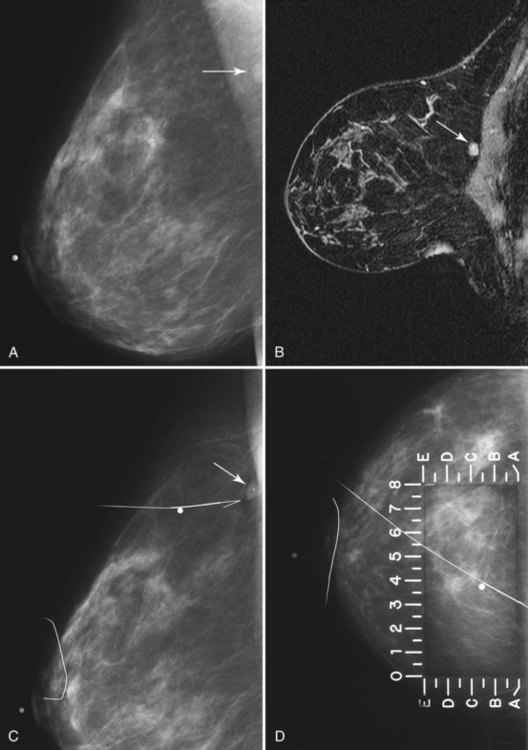
The simplest method of MRI-guided biopsy is preoperative MRI-guided needle localization and hookwire marking (Fig. 7-33). With the use of an open breast coil and sterile technique, an 18- or 20-gauge MRI-compatible needle is inserted in the breast and directed toward the abnormality. A variety of methods have been proposed to determine the correct needle trajectory, including grid-coordinate positioning devices and freehand methods. Contrast-enhanced scans are critical to confirm correct needle placement and target localization. Procedure speed is important because lesions commonly do not enhance preferentially over breast tissue more than 5 to 10 minutes after injection.
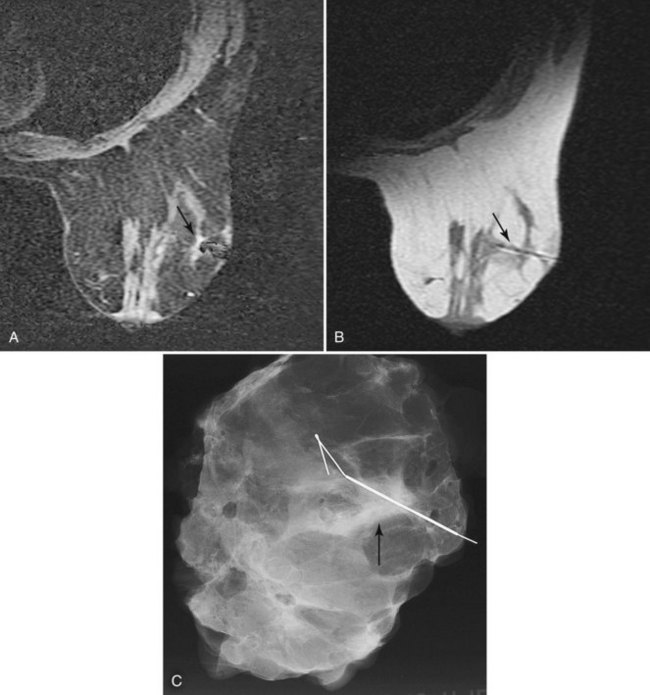
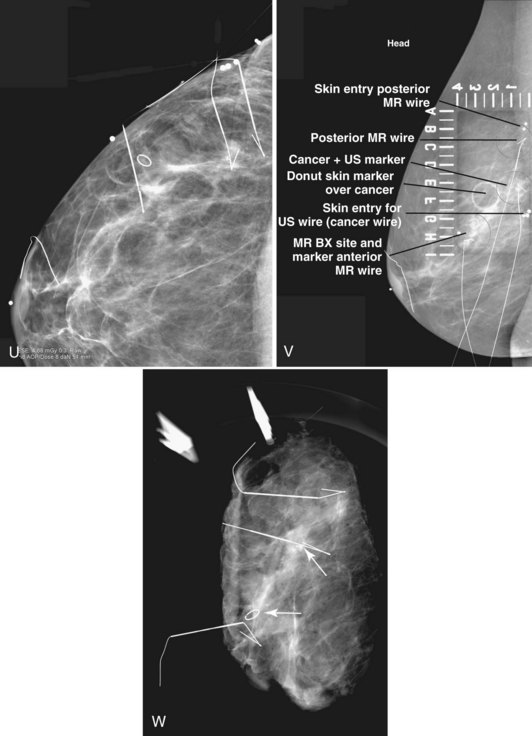
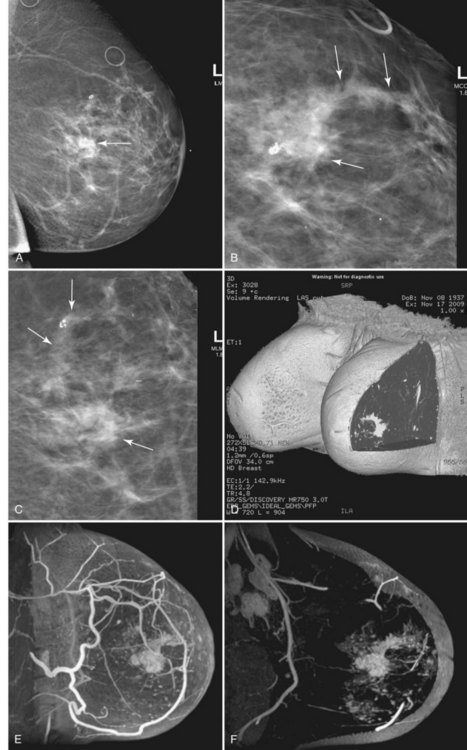
Figure 7-33 Magnetic resonance imaging (MRI)-guided needle localization. A, Axial, contrast-enhanced, water-selective two-dimensional gradient echo MRI reveals an MRI-compatible localizing needle abutting the suspicious focus of contrast enhancement (arrow) described in Figure 7-28. B, An axial T1-weighted fast spin-echo image after hookwire deployment reveals the mass centered on the stiffener of the hookwire (arrow). C, Radiography of the excised specimen demonstrated nonspecific glandular tissue adjacent to the hookwire (arrow). Pathologic examination revealed invasive ductal carcinoma.
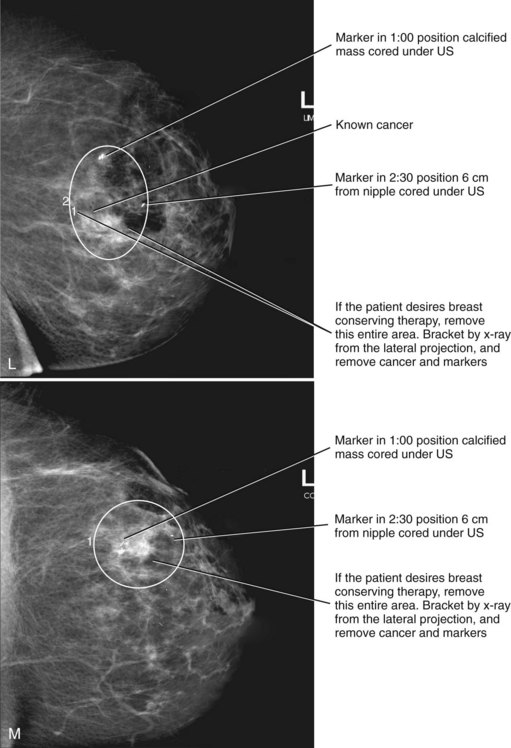
Correlating the MRI, mammographic, and ultrasound finding can be challenging. Use of markers or clips after core biopsy can be extremely helpful to identify findings cored under ultrasound, MRI, or stereotactic core biopsy, especially if the patient is to undergo excision of cancer seen on more than one modality (Fig. 7-34).
Percutaneous Core Biopsy
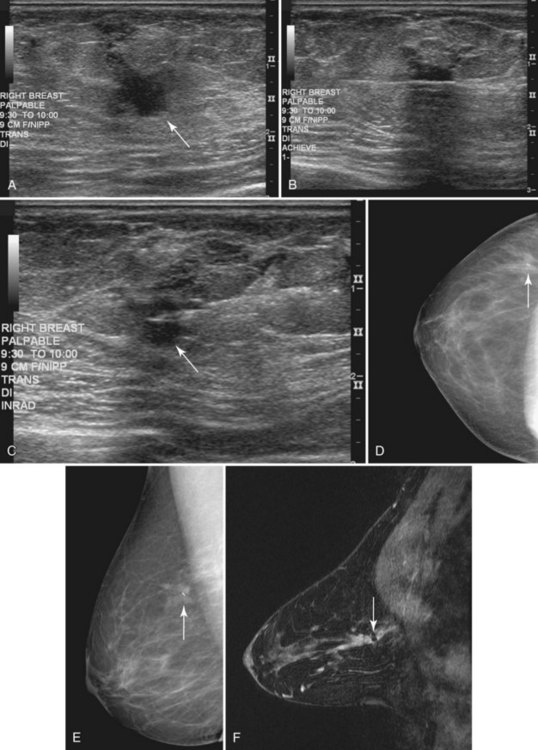
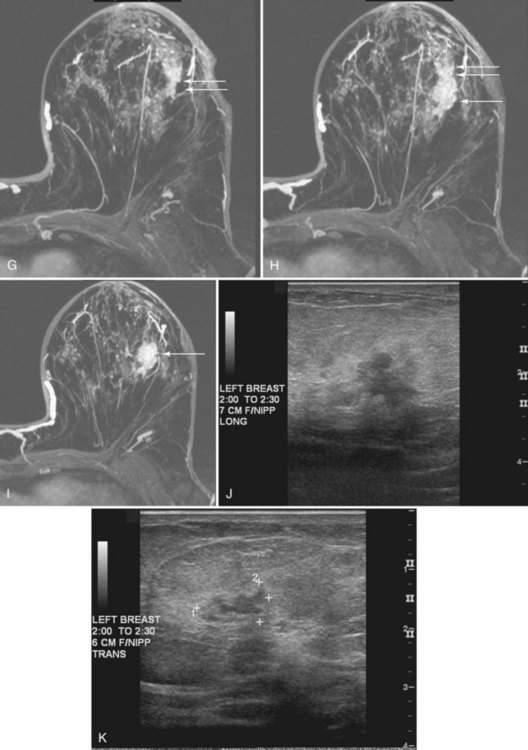
Percutaneous core needle biopsy (Fig. 7-35) can be performed under direct MRI guidance by both grid-coordinate and freehand methods. Devices include MRI-compatible 14-gauge titanium needles and vacuum-assisted biopsy devices. The imaging artifacts associated with core biopsy needles and the potential for breast motion remain limitations to reliable biopsy of sub-centimeter lesions given the current technology.
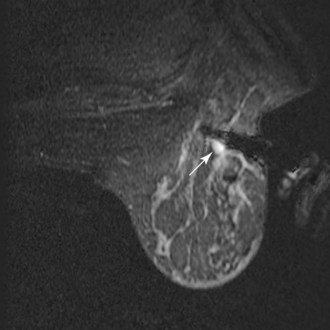
Figure 7-35 Magnetic resonance imaging (MRI)-guided vacuum-assisted core needle biopsy. Axial, water-selective, two-dimensional gradient echo MRI revealed the inner trocar of a 14-gauge titanium biopsy needle extended through the focally enhancing mass (arrow) noted in Figure 7-19C to E. Pathologic evaluation revealed benign fibroadenoma.
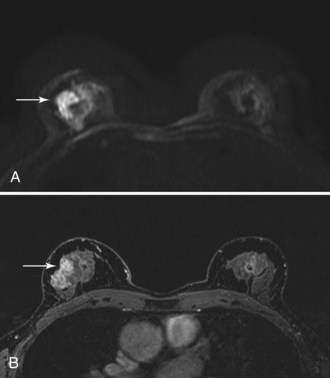
MRI-guided core biopsy can be especially helpful after a breast cancer diagnosis if MRI detects a possible second cancer not seen on any other modality. This is particularly true in the postbiopsy surgical patient who has already undergone one operation and now seeks definitive surgical therapy (Fig. 7-36).
MRI-compatible clips may be deployed after MRI-guided core needle biopsy to mark the site of biopsy. When benign results are obtained that do not specifically correspond to the expected appearance of the MRI lesion, repeat MRI-guided needle-localized surgical biopsy or follow-up MRI must be performed. The use of the MRI-guided markers or markers placed under ultrasound that are later imaged by MRI or mammography can help guide the surgeon to excise the entire tumor and any associated DCIS (Fig. 7-37).
Diffusion-Weighted MRI
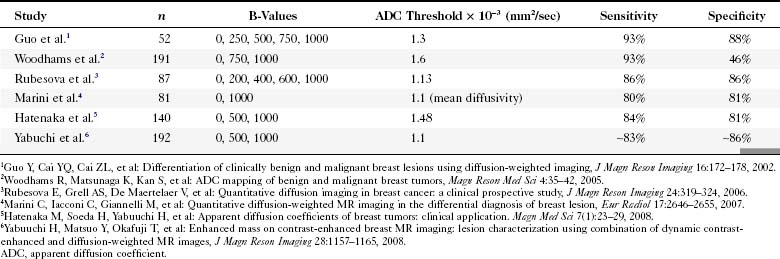
Diffusion-weighted imaging (DWI) measures water molecule mobility in vivo on unenhanced breast MRI sequences (Fig. 7-38). DWI evaluates tissue biophysical characteristics, such as the microstructure of breast tissue, cell density, membrane integrity, and extracellular matrix composition. Preliminary studies show a lower apparent diffusion coefficient (ADC) on DWI studies of breast cancers (Table 7-8). A higher ADC was observed in benign breast lesions and normal tissue. It was thought that a higher cell density in breast cancer causes an increased restriction of the extracellular matrix, with the resultant increased signal fraction coming from intracellular water. A preliminary study by Partridge and colleagues showed that increased positive predictive value might be achieved by combining ADC and conventional contrast-enhanced MRI criteria. The studies will need to be validated with larger populations.
Key Elements
Contrast enhancement in breast cancers is due to angiogenesis.
Indications for breast MRI are breast cancer screening in high-risk patients (BRCA1, BRCA2, or equivalent); breast cancer staging to detect mammographically occult bilateral, multicentric, multifocal, or locally extensive disease; poorly visualized tumors on mammography; diagnosis of suspicious findings that cannot be fully evaluated with conventional imaging; and before and after neoadjuvant chemotherapy.
Chemotherapy produces a potential pitfall in interpretation because it can decrease tumor conspicuity and change suspicious enhancement curves to benign persistent curves despite the persistence of viable, residual cancer.
Proper technique includes a dedicated breast coil, a contrast bolus followed by a saline flush, fat suppression, or subtraction.
Both morphology and enhancement curves are important in interpretation of MRI.
Abnormal enhancement is defined as enhancement brighter than normal surrounding glandular tissue on the first postcontrast scan or early in the initial enhancement phase.
ACR BI-RADS® terms for morphologic features of abnormal enhancement include focus, focal area, mass, linear, ductal, segmental, regional, multiple regions, and diffuse enhancement.
Suspicious morphologic findings on MRI include an irregular shape, irregular or spiculated margins, rim enhancement, and enhancing internal septations.
Associated findings of focal skin thickening, satellite lesions, lymphadenopathy, and skin or chest wall invasion are suspicious for cancer in the appropriate clinical setting.
Suspicious enhancement curves include a rapid initial rise and abrupt transition to a late-phase plateau or washout; the curve shape is also called a “square root sign” or a “cancer corner.”
Benign enhancement curves include a slow initial rise and a late persistent enhancement phase.
Fibroadenomas are usually bright on T2-weighted images if myxoid and dark on T2-weighted images if sclerotic and may have dark internal septations and a persistent late enhancement phase.
DCIS may be difficult to distinguish from fibrocystic changes.
Classic patterns for DCIS include clumped enhancement in a ductal, linear, or segmental distribution, particularly if it is asymmetric.
DCIS does not always display rapid initial enhancement with a plateau or washout.
Pitfalls in interpreting rim enhancement include fat necrosis and inflamed cysts; precontrast T2-weighted images can reduce false positives.
Pitfalls in interpreting benign-appearing masses include cancers with a benign morphology and a suspicious enhancement curve.
Mastitis and inflammatory cancer both produce breast edema and abnormal enhancement.
Papillomas and lymph nodes may have rapid initial rise and plateau or washout patterns and can thus be a cause of false-positive findings that generate biopsy.
MRI-guided preoperative needle localization and MRI-guided core biopsy must be performed rapidly because the signal intensity of the tumor may be indistinguishable from surrounding enhancing breast tissue within 10 minutes.
Abe H, Schmidt RA, Shah RN, et al. MRI-directed (“second-look”) ultrasound examination for breast lesions detected initially on MRI: MR and sonographic findings. AJR Am J Roentgenol. 2010;194(2):370-377.
Agoston AT, Daniel BL, Herfkens RJ, et al. Intensity-modulated parametric mapping for simultaneous display of rapid dynamic and high-spatial resolution breast MR imaging data. Radiographics. 2001;21:217-226.
American College of Radiology. ACR Breast Imaging Reporting and Data System, Breast Imaging Atlas. Reston, VA: American College of Radiology. 2003.
Balu-Maestro C, Chapellier C, Bleuse A, et al. Imaging in evaluation of response to neoadjuvant breast cancer treatment benefits of MRI. Breast Cancer Res Treat. 2002;72:145-152.
Bedrosian I, Mick R, Orel SG, et al. Changes in the surgical management of patients with breast carcinoma based on preoperative magnetic resonance imaging. Cancer. 2003;98:468-473.
Bedrosian I, Schlencker J, Spitz FR, et al. Magnetic resonance imaging-guided biopsy of mammographically and clinically occult breast lesions. Ann Surg Oncol. 2002;9:457-461.
Beran L, Liang W, Nims T, et al. Correlation of targeted ultrasound with magnetic resonance imaging abnormalities of the breast. Am J Surg. 2005;190:592-594.
Berg WA, Blume JD, Cormack JB, Mendelson EB. Operator dependence of physician-performed whole-breast US: lesion detection and characterization. Radiology. 2006;241:355-365.
Boetes C, Mus RD, Holland R, et al. Breast tumors: comparative accuracy of MR imaging relative to mammography and US for demonstrating extent. Radiology. 1995;197:743-747.
Brenner RJ. Needle localization of breast lesions: localizing data. AJR Am J Roentgenol. 2002;179:1643-1644.
Brinck U, Fischer U, Korabiowska M, et al. The variability of fibroadenoma in contrast-enhanced dynamic MR mammography. AJR Am J Roentgenol. 1997;168:1331-1334.
Brown J, Buckley D, Coulthard A, et al. Magnetic resonance imaging screening in women at genetic risk of breast cancer: imaging and analysis protocol for the UK Multicentre Study. UK MRI Breast Screening Study Advisory Group. Magn Reson Imaging. 2000;18:765-776.
Brown J, Smith RC, Lee CH. Incidental enhancing lesions found on MR imaging of the breast. AJR Am J Roentgenol. 2001;176:1249-1254.
Buadu LD, Murakami J, Murayama S, et al. Breast lesions: correlation of contrast medium enhancement patterns on MR images with histopathologic findings and tumor angiogenesis. Radiology. 1996;200:639-649.
Chenevert TL, Helvie MA, Aisen AM, et al. Dynamic three-dimensional imaging with partial k-space sampling: initial application for gadolinium-enhanced rate characterization of breast lesions. Radiology. 1995;196:135-142.
Cohen EK, Leonhardt CM, Shumak RS, et al. Magnetic resonance imaging in potential postsurgical recurrence of breast cancer: pitfalls and limitations. Can Assoc Radiol J. 1996;47:171-176.
Daniel BL, Birdwell RL, Black JW, et al. Interactive MR-guided, 14-gauge core-needle biopsy of enhancing lesions in a breast phantom mode. Acad Radiol. 1997;4:508-512.
Daniel BL, Birdwell RL, Butts K, et al. Freehand iMRI-guided large-gauge core needle biopsy: a new minimally invasive technique for diagnosis of enhancing breast lesions. J Magn Reson Imaging. 2001;13:896-902.
Daniel BL, Birdwell RL, Ikeda DM, et al. Breast lesion localization: a freehand, interactive MR imaging-guided technique. Radiology. 1998;207:455-463.
Daniel B, Herfkens R. Intraoperative MR imaging: can image guidance improve therapy? Acad Radiol. 2002;9:875-877.
Daniel BL, Yen YF, Glover GH, et al. Breast disease: dynamic spiral MR imaging. Radiology. 1998;209:499-509.
Degani H, Chetrit-Dadiani M, Bogin L, Furman-Haran E. Magnetic resonance imaging of tumor vasculature. Thromb Haemost. 2003;89:25-33.
Degani H, Gusis V, Weinstein D, et al. Mapping pathophysiological features of breast tumors by MRI at high spatial resolution. Nat Med. 1997;3:780-782.
Demartini WB, Eby PR, Peacock S, Lehman CD. Utility of targeted sonography for breast lesions that were suspicious on MRI. AJR Am J Roentgenol. 2009;192:1128-1134.
Destounis S, Arieno A, Somerville PA, et al. Community-based practice experience of unsuspected breast magnetic resonance imaging abnormalities evaluated with second-look sonography. J Ultrasound Med. 2009;28:1337-1346.
El Khouli RH, Macura KJ, Jacobs MA, et al. Dynamic contrast-enhanced MRI of the breast: quantitative method for kinetic curve type assessment. AJR Am J Roentgenol. 2009;193:W295-W300.
Elmore JG, Armstrong K, Lehman CD, Fletcher SW. Screening for breast cancer. JAMA. 2005;293:1245-1256.
Esserman L, Hylton N, Yassa L, et al. Utility of magnetic resonance imaging in the management of breast cancer: evidence for improved preoperative staging. J Clin Oncol. 1999;17:110-119.
Guo Y, Cai YQ, Cai ZL, et al. Differentiation of clinically benign and malignant breast lesions using diffusion-weighted imaging. J Magn Reson Imaging. 2002;16:172-178.
Gutierrez RL, DeMartini WB, Eby PR, et al. BI-RADS lesion characteristics predict likelihood of malignancy in breast MRI for masses but not for nonmasslike enhancement. AJR Am J Roentgenol. 2009;193:994-1000.
Harms SE, Flamig DP, Hesley KL, et al. MR imaging of the breast with rotating delivery of excitation off resonance: clinical experience with pathologic correlation. Radiology. 1993;187:493-501.
Hashimoto BE. Sonographic assessment of breast calcifications. Curr Probl Diagn Radiol. 2006;35:213-218.
Hashimoto BE, Morgan GN, Kramer DJ, Lee M. Systematic approach to difficult problems in breast sonography. Ultrasound Q. 2008;24:31-38.
Heywang SH, Wolf A, Pruss E, et al. MR imaging of the breast with Gd-DTPA: use and limitations. Radiology. 1989;171:95-103.
Hochman MG, Orel SG, Powell CM, et al. Fibroadenomas: MR imaging appearances with radiologic–histopathologic correlation. Radiology. 1997;204:123-129.
Houssami N, Ciatto S, Macaskill P, et al. Accuracy and surgical impact of magnetic resonance imaging in breast cancer staging: systematic review and meta-analysis in detection of multifocal and multicentric cancer. J Clin Oncol. 2008;26:3248-3258.
Hrung JM, Langlotz CP, Orel SG, et al. Cost-effectiveness of MR imaging and core-needle biopsy in the preoperative work-up of suspicious breast lesions. Radiology. 1999;213:39-49.
Hrung JM, Sonnad SS, Schwartz JS, Langlotz CP. Accuracy of MR imaging in the work-up of suspicious breast lesions: a diagnostic meta-analysis. Acad Radiol. 1999;6:387-397.
Hwang ES, Kinkel K, Esserman LJ, et al. Magnetic resonance imaging in patients diagnosed with ductal carcinoma in situ: value in the diagnosis of residual disease, occult invasion, and multicentricity. Ann Surg Oncol. 2003;10:381-388.
Ikeda DM, Baker DR, Daniel BL. Magnetic resonance imaging of breast cancer: clinical indications and breast MRI reporting system. J Magn Reson Imaging. 2000;12:975-983.
Ikeda DM, Hylton NM, Kinkel K, et al. Development, standardization, and testing of a lexicon for reporting contrast-enhanced breast magnetic resonance imaging studies. J Magn Reson Imaging. 2001;13:889-895.
Kelcz F, Santyr GE, Cron GO, Mongin SJ. Application of a quantitative model to differentiate benign from malignant breast lesions detected by dynamic, gadolinium-enhanced MRI. J Magn Reson Imaging. 1996;6:743-752.
Kinkel K, Helbich TH, Esserman LJ, et al. Dynamic high-spatial resolution MR imaging of suspicious breast lesions: diagnostic criteria and interobserver variability. AJR Am J Roentgenol. 2000;175:35-43.
Kinoshita T, Odagiri K, Andoh K, et al. Evaluation of small internal mammary lymph node metastases in breast cancer by MRI. Radiat Med. 1999;17:189-193.
Kinoshita T, Yashiro N, Yoshigi J, et al. Inflammatory intramammary lymph node mimicking the malignant lesion in dynamic MRI: a case report. Clin Imaging. 2002;26:258-262.
Kinoshita T, Yashiro N, Ihara N, et al. Diffusion-weighted half-Fourier single-shot turbo spin echo imaging in breast tumors: differentiation of invasive ductal carcinoma from fibroadenoma. J Comput Assist Tomogr. 2002;26:1042-1046.
Ko EY, Han BK, Shin JH, Kang SS. Breast MRI for evaluating patients with metastatic axillary lymph node and initially negative mammography and sonography. Korean J Radiol. 2007;8:382-389.
Kriege M, Brekelmans CT, Boetes C, et al. Efficacy of MRI and mammography for breast-cancer screening in women with a familial or genetic predisposition. N Engl J Med. 2004;351:427-437.
Kuhl CK. High-risk screening: multi-modality surveillance of women at high risk for breast cancer (proven or suspected carriers of a breast cancer susceptibility gene). J Exp Clin Cancer Res. 2002;21(3 Suppl):103-106.
Kuhl CK. Interventional breast MRI: needle localisation and core biopsies. J Exp Clin Cancer Res. 2002;21(3 Suppl):65-68.
Kuhl CK, Bieling HB, Gieseke J, et al. Healthy premenopausal breast parenchyma in dynamic contrast-enhanced MR imaging of the breast: normal contrast medium enhancement and cyclical-phase dependency. Radiology. 1997;203:137-144.
Kuhl CK, Elevelt A, Leutner CC, et al. Interventional breast MR imaging: clinical use of a stereotactic localization and biopsy device. Radiology. 1997;204:667-675.
Kuhl CK, Klaschik S, Mielcarek P, et al. Do T2-weighted pulse sequences help with the differential diagnosis of enhancing lesions in dynamic breast MRI? J Magn Reson Imaging. 1999;9:187-196.
Kuhl CK, Mielcareck P, Klaschik S, et al. Dynamic breast MR imaging: are signal intensity time course data useful for differential diagnosis of enhancing lesions? Radiology. 1999;211:101-110.
Kuhl CK, Schild HH. Dynamic image interpretation of MRI of the breast. J Magn Reson Imaging. 2000;12:965-974.
Kuhl CK, Schmutzler RK, Leutner CC, et al. Breast MR imaging screening in 192 women proved or suspected to be carriers of a breast cancer susceptibility gene: preliminary results. Radiology. 2000;215:267-279.
Kuhl CK, Schrading S, Leutner CC, et al. Mammography, breast ultrasound, and magnetic resonance imaging for surveillance of women at high familial risk for breast cancer. J Clin Oncol. 2005;23:8469-8476.
Leach MO, Boggis CR, Dixon AK, et al. Screening with magnetic resonance imaging and mammography of a UK population at high familial risk of breast cancer: a prospective multicentre cohort study (MARIBS). Lancet. 2005;365:1769-1778.
Le Bihan D, Turner R, Douek P, Patronas N. Diffusion MR imaging: clinical applications. AJR Am J Roentgenol. 1992;159:591-599.
Lehman CD, Blume JD, Thickman D, et al. Added cancer yield of MRI in screening the contralateral breast of women recently diagnosed with breast cancer: results from the International Breast Magnetic Resonance Consortium (IBMC) trial. J Surg Oncol. 2005;92:9-16.
Lehman CD, Blume JD, Weatherall P, et al. Screening women at high risk for breast cancer with mammography and magnetic resonance imaging. Cancer. 2005;103:1898-1905.
Lehman CD, DeMartini W, Anderson BO, Edge SB. Indications for breast MRI in the patient with newly diagnosed breast cancer. J Natl Compr Canc Netw. 2009;7:193-201.
Leong CS, Daniel BL, Herfkens RJ, et al. Characterization of breast lesion morphology with delayed 3DSSMT: An adjunct to dynamic breast MRI. J Magn Reson Imaging. 2000;11:87-96.
Li J, Dershaw DD, Lee CH, et al. MRI follow-up after concordant, histologically benign diagnosis of breast lesions sampled by MRI-guided biopsy. AJR Am J Roentgenol. 2009;193:850-855.
Liberman L, Morris EA, Benton CL, et al. Probably benign lesions at breast magnetic resonance imaging: preliminary experience in high-risk women. Cancer. 2003;98:377-388.
Liberman L, Morris EA, Dershaw DD, et al. MR imaging of the ipsilateral breast in women with percutaneously proven breast cancer. AJR Am J Roentgenol. 2003;180:901-910.
Liberman L, Morris EA, Dershaw DD, et al. Ductal enhancement on MR imaging of the breast. AJR Am J Roentgenol. 2003;181:519-525.
Liberman L, Morris EA, Dershaw DD, et al. Fast MRI-guided vacuum-assisted breast biopsy: initial experience. AJR Am J Roentgenol. 2003;181:1283-1293.
Liberman L, Morris EA, Kim CM, et al. MR imaging findings in the contralateral breast of women with recently diagnosed breast cancer. AJR Am J Roentgenol. 2003;180:333-341.
Liberman L, Morris EA, Lee MJ, et al. Breast lesions detected on MR imaging: Features and positive predictive value. AJR Am J Roentgenol. 2002;179:171-178.
Linda A, Zuiani C, Londero V, Bazzocchi M. Outcome of initially only magnetic resonance mammography-detected findings with and without correlate at second-look sonography: distribution according to patient history of breast cancer and lesion size. Breast. 2008;17:51-57.
Lyng H, Haraldseth O, Rofstad EK. Measurement of cell density and necrotic fraction in human melanoma xenografts by diffusion weighted magnetic resonance imaging. Magn Reson Med. 2000;43:828-836.
Marini C, Iacconi C, Giannelli M, et al. Quantitative diffusion-weighted MR imaging in the differential diagnosis of breast lesion. Eur Radiol. 2007;17:2646-2655.
Meissnitzer M, Dershaw DD, Lee CH, Morris EA. Targeted ultrasound of the breast in women with abnormal MRI findings for whom biopsy has been recommended. AJR Am J Roentgenol. 2009;193:1025-1029.
Monzawa S, Yokokawa M, Sakuma T, et al. Mucinous carcinoma of the breast: MRI features of pure and mixed forms with histopathologic correlation. AJR Am J Roentgenol. 2009;192:W125-W131.
Morris EA. Illustrated breast MR lexicon. Semin Roentgenol. 2001;36:238-249.
Morris EA, Liberman L, Ballon DJ, et al. MRI of occult breast carcinoma in a high-risk population. AJR Am J Roentgenol. 2003;181:619-626.
Morris EA, Liberman L, Dershaw DD, et al. Preoperative MR imaging-guided needle localization of breast lesions. AJR Am J Roentgenol. 2002;178:1211-1220.
Morris EA, Schwartz LH, Drotman MB, et al. Evaluation of pectoralis major muscle in patients with posterior breast tumors on breast MR images: early experience. Radiology. 2000;214:67-72.
Moy L, Elias K, Patel V, et al. Is breast MRI helpful in the evaluation of inconclusive mammographic findings? AJR Am J Roentgenol. 2009;193:986-993.
Muller-Schimpfle M, Ohmenhauser K, Sand J, et al. Dynamic 3D-MR mammography: is there a benefit of sophisticated evaluation of enhancement curves for clinical routine? J Magn Reson Imaging. 1997;7:236-240.
Nicholson BT, Harvey JA, Cohen MA. Nipple–areolar complex: normal anatomy and benign and malignant processes. Radiographics. 2009;29:509-523.
Nunes LW, Englander SA, Charafeddine R, Schnall MD. Optimal post-contrast timing of breast MR image acquisition for architectural feature analysis. J Magn Reson Imaging. 2002;16:42-50.
Nunes LW, Schnall MD, Orel SG. Update of breast MR imaging architectural interpretation model. Radiology. 2001;219:484-494.
Obdeijn IM, Brouwers-Kuyper EM, Tilanus-Linthorst MM, et al. MR imaging-guided sonography followed by Breast J fine-needle aspiration cytology in occult carcinoma of the breast. AJR Am J Roentgenol. 2000;174:1079-1084.
Offodile RS, Daniel BL, Jeffrey SS, et al. Magnetic resonance imaging of suspicious breast masses seen on one mammographic view. Breast J. 2004;10(5):416-422.
Orel SG, Dougherty CS, Reynolds C, et al. MR imaging in patients with nipple discharge: initial experience. Radiology. 2000;216:248-254.
Partridge SC, DeMartini WB, Kurland BF, et al. Quantitative diffusion-weighted imaging as an adjunct to conventional breast MRI for improved positive predictive value. AJR Am J Roentgenol. 2009;193:1716-1722.
Partridge SC, Gibbs JE, Lu Y, et al. Accuracy of MR imaging for revealing residual breast cancer in patients who have undergone neoadjuvant chemotherapy. AJR Am J Roentgenol. 2002;179:1193-1199.
Partridge SC, McKinnon GC, Henry RG, Hylton NM. Menstrual cycle variation of apparent diffusion coefficients measured in the normal breast using MRI. J Magn Reson Imaging. 2001;14:433-438.
Pereira FP, Martins G, Figueiredo E, et al. Assessment of breast lesions with diffusion-weighted MRI: comparing the use of different b values. AJR Am J Roentgenol. 2009;193:1030-1035.
Perlet C, Schneider P, Amaya B, et al. MR-guided vacuum biopsy of 206 contrast-enhancing breast lesions. Rofo Fortschr Geb Rontgenstr Neuen Bildgeb Verfahr. 2002;174:88-95.
Qayyum A, Birdwell RL, Daniel BL, et al. MR imaging features of infiltrating lobular carcinoma of the breast: histopathologic correlation. AJR Am J Roentgenol. 2002;178:1227-1232.
Ralleigh G, Walker AE, Hall-Craggs MA, et al. MR imaging of the skin and nipple of the breast: differentiation between tumour recurrence and post-treatment change. Eur Radiol. 2001;11:1651-1658.
Rieber A, Zeitler H, Rosenthal H, et al. MRI of breast cancer: influence of chemotherapy on sensitivity. Br J Radiol. 1997;70:452-458.
Rodenko GN, Harms SE, Pruneda JM, et al. MR imaging in the management before surgery of lobular carcinoma of the breast: correlation with pathology. AJR Am J Roentgenol. 1996;167:1415-1419.
Rubesova E, Grell AS, De Maertelaer V, et al. Quantitative diffusion imaging in breast cancer: a clinical prospective study. J Magn Reson Imaging. 2006;24:319-324.
Saslow D, Boetes C, Burke W, et al. American Cancer Society guidelines for breast screening with MRI as an adjunct to mammography. CA Cancer J Clin. 2007;57:75-89.
Schnall MD, Blume J, Bluemke DA, et al. MRI detection of distinct incidental cancer in women with primary breast cancer studied in IBMC 6883. J Surg Oncol. 2005;92:32-38.
Schnall MD, Rosten S, Englander S, et al. A combined architectural and kinetic interpretation model for breast MR images. Acad Radiol. 2001;8:591-597.
Sinha S, Lucas-Quesada FA, Sinha U, et al. In vivo diffusion-weighted MRI of the breast: potential for lesion characterization. J Magn Reson Imaging. 2002;15:693-704.
Slanetz PJ, Edmister WB, Yeh ED, et al. Occult contralateral breast carcinoma incidentally detected by breast magnetic resonance imaging. Breast J. 2002;8:145-148.
Soderstrom CE, Harms SE, Farrell RSJr, et al. Detection with MR imaging of residual tumor in the breast soon after surgery. AJR Am J Roentgenol. 1997;168:485-488.
Stoutjesdijk MJ, Boetes C, Jager GJ, et al. Magnetic resonance imaging and mammography in women with a hereditary risk of breast cancer. J Natl Cancer Inst. 2001;93:1095-1102.
Sugahara T, Korogi Y, Kochi M, et al. Usefulness of diffusion-weighted MRI with echo-planar technique in the evaluation of cellularity in gliomas. J Magn Reson Imaging. 1999;9:53-60.
Talele AC, Slanetz PJ, Edmister WB, et al. The lactating breast: MRI findings and literature review. Breast J. 2003;9:237-240.
Tan JE, Orel SG, Schnall MD, et al. Role of magnetic resonance imaging and magnetic resonance imaging-guided surgery in the evaluation of patients with early-stage breast cancer for breast conservation treatment. Am J Clin Oncol. 1999;22:414-418.
Teifke A, Lehr HA, Vomweg TW, et al. Outcome analysis and rational management of enhancing lesions incidentally detected on contrast-enhanced MRI of the breast. AJR Am J Roentgenol. 2003;181:655-662.
Tendulkar RD, Chellman-Jeffers M, Rybicki LA, et al. Preoperative breast magnetic resonance imaging in early breast cancer: implications for partial breast irradiation. Cancer. 2009;115:1621-1630.
Tilanus-Linthorst MM, Bartels CC, Obdeijn AI, Oudkerk M. Earlier detection of breast cancer by surveillance of women at familial risk. Eur J Cancer. 2000;36:514-519.
Tilanus-Linthorst MM, Obdeijn AI, Bontenbal M, Oudkerk M. MRI in patients with axillary metastases of occult breast carcinoma. Breast Cancer Res Treat. 1997;44:179-182.
Trecate G, Tess JD, Vergnaghi D, et al. Lobular breast cancer: how useful is breast magnetic resonance imaging? Tumori. 2001;87:232-238.
Tsuboi N, Ogawa Y, Inomata T, et al. Changes in the findings of dynamic MRI by preoperative CAF chemotherapy for patients with breast cancer of stage II and III: pathologic correlation. Oncol Rep. 1999;6:727-732.
Viehweg P, Heinig A, Lampe D, et al. Retrospective analysis for evaluation of the value of contrast-enhanced MRI in patients treated with breast conservative therapy. MAGMA. 1998;7:141-152.
Viehweg P, Lampe D, Buchmann J, Heywang-Kobrunner SH. In situ and minimally invasive breast cancer: morphologic and kinetic features on contrast-enhanced MR imaging. MAGMA. 2000;11:129-137.
Viehweg P, Paprosch I, Strassinopoulou M, Heywang-Kobrunner SH. Contrast-enhanced magnetic resonance imaging of the breast: interpretation guidelines. Top Magn Reson Imaging. 1998;9:17-43.
Warner E, Plewes DB, Shumak RS, et al. Comparison of breast magnetic resonance imaging, mammography, and ultrasound for surveillance of women at high risk for hereditary breast cancer. J Clin Oncol. 2001;19:3524-3531.
Wenkel E, Geppert C, Schulz-Wendtland R, et al. Diffusion weighted imaging in breast MRI: comparison of two different pulse sequences. Acad Radiol. 2007;14:1077-1083.
Wiratkapun C, Duke D, Nordmann AS, et al. Indeterminate or suspicious breast lesions detected initially with MR imaging: value of MRI-directed breast ultrasound. Acad Radiol. 2008;15:618-625.
Woodhams R, Matsunaga K, Kan S, et al. ADC mapping of benign and malignant breast tumors. Magn Reson Med Sci. 2005;4:35-42.
Yabuuchi H, Matsuo Y, Okafuji T, et al. Enhanced mass on contrast-enhanced breast MR imaging: lesion characterization using combination of dynamic contrast-enhanced and diffusion-weighted MR images. J Magn Reson Imaging. 2008;28:1157-1165.
7-1. Fill in the principles of breast cancer MRI.
_____________________________________________________________________________________
_____________________________________________________________________________________
_____________________________________________________________________________________
_____________________________________________________________________________________
7-2. Fill in the requirements for patient selection and preparation.
_____________________________________________________________________________________
_____________________________________________________________________________________
_____________________________________________________________________________________
7-3. Fill in the equipment for breast MRI.
_____________________________________________________________________________________
_____________________________________________________________________________________
_____________________________________________________________________________________
7-4. Fill in the breast density by volume.
_________________________________ _______
_________________________________ _______
7-5. Fill in the background enhancement.
_________________________________ _______
_________________________________ _______
_________________________________ _______
7-6. Fill in the morphologic features of enhancing breast lesions.
Features Suggesting Malignancy
_________________________________________
_________________________________________
_________________________________________
_________________________________________
_________________________________________
_________________________________________
7-7. Fill in the dynamic contrast enhancement of breast lesions.
Patterns Suggesting Malignancy
_________________________________________
_________________________________________
7-8. Fill in the organized approach to breast MRI interpretation.
_____________________________________________________________________________________
_____________________________________________________________________________________
_____________________________________________________________________________________
_____________________________________________________________________________________
_____________________________________________________________________________________
_____________________________________________________________________________________
_____________________________________________________________________________________
_____________________________________________________________________________________
_____________________________________________________________________________________
_____________________________________________________________________________________
_____________________________________________________________________________________
_____________________________________________________________________________________
_____________________________________________________________________________________
_____________________________________________________________________________________
7-9. Fill in the common false-positive conditions that simulate malignancy.
_____________________________________________________________________________________
_____________________________________________________________________________________
_____________________________________________________________________________________
_____________________________________________________________________________________
_____________________________________________________________________________________
_____________________________________________________________________________________
_____________________________________________________________________________________
7-10. Fill in the common false-negative tumors on breast MRI.
_____________________________________________________________________________________
_____________________________________________________________________________________
_____________________________________________________________________________________
_____________________________________________________________________________________
_____________________________________________________________________________________
_____________________________________________________________________________________
7-11. Fill in the accepted indications for contrast-enhanced breast MRI.
_____________________________________________________________________________________
_____________________________________________________________________________________
_____________________________________________________________________________________
_____________________________________________________________________________________
_____________________________________________________________________________________
_____________________________________________________________________________________
_____________________________________________________________________________________
_____________________________________________________________________________________
_____________________________________________________________________________________
_____________________________________________________________________________________
_____________________________________________________________________________________
_____________________________________________________________________________________
_________________________________________________________________________________
_____________________________________________________________________________________
_____________________________________________________________________________________
_____________________________________________________________________________________
7-12. Fill in the options for biopsy of MRI abnormalities.
7-13. Fill in the T1, T2, and kinetic curves for cancer and benign masses on breast MRI.
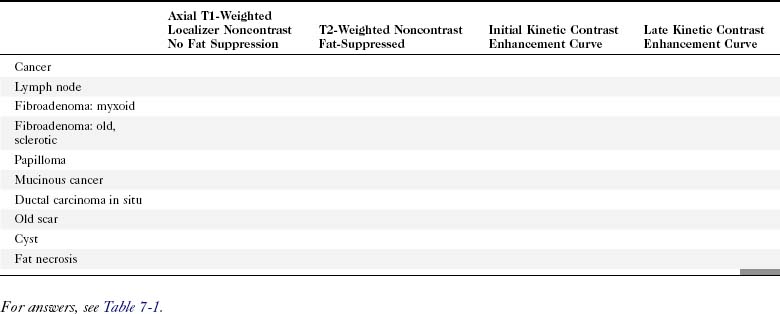
7-14. Fill in the basic bilateral protocol for breast cancer MR imaging.
| Series Description | Purpose |
|---|---|
| 1 ___________________________________________ | _________________________________________________ |
| 2 ___________________________________________ | _________________________________________________ |
| [3] ___________________________________________ | _________________________________________________ |
| 4 ___________________________________________ | _________________________________________________ |
| 5 ___________________________________________ | _________________________________________________ |
| [6] ___________________________________________ | _________________________________________________ |
| N/A ___________________________________________ | _________________________________________________ |
7-15. Fill in the common artifacts.
| Artifact | Cause |
|---|---|
| ______________________ | ______________________ |
| ______________________ | ______________________ |
| ______________________ | ______________________ |
| ______________________ | ______________________ |
| ______________________ | ______________________ |
| ______________________ | ______________________ |
7-16. Fill in the T2-weighted imaging of breast lesions.
| T2 > Glandular Tissue or Muscle | T2 ≤ Glandular Tissue | |
|---|---|---|
| Enhances with contrast | ______________ | ____________ |
| ______________ | ||
| Nonenhancing | ______________ | ____________ |
7-17. Fill in the ACR BI-RADS®–MRI lexicon terms and classification scheme.
[/level-membership-for-radiology-category][not-level-membership-for-radiology-category]
Chapter 7 Magnetic Resonance Imaging of Breast Cancer and MRI-Guided Breast Biopsy
Basic Principles
Breast Cancer
Invasive breast tumors are characterized by an ingrowth of neovascularity at their periphery. Tumor angiogenesis is associated with increased perfusion and abnormal leaky endothelium, leading to preferential enhancement of tumors versus normal breast tissue (Box 7-1). With bolus administration of an intravenous (IV) contrast agent, increased vascular flow and the rapid exchange rate of contrast between blood and the extracellular compartment cause invasive breast tumors to enhance more rapidly and more avidly than normal fibroglandular tissue, even in patients with dense breasts. Thus, invasive breast cancers have high signal intensity and are brighter than the surrounding normal tissue on the first postcontrast scan, which ideally should be obtained about 90 seconds after injection. As a result, MRI exquisitely reveals invasive tumors that are occult on mammography (Fig. 7-1). The sensitivity of MRI for invasive breast cancer is extremely high—over 90%. However, as discussed in detail in this chapter, contrast enhancement on MRI is seen in many benign conditions as well; the specificity of MRI varies between 39% and 95%. As detailed in this chapter, morphology, T1 and T2 characteristics, and the time course of contrast enhancement help differentiate benign from malignant lesions (Table 7-1).
Box 7-1 Principles of Breast Cancer MRI
Contrast-enhanced MRI is extremely sensitive for tumor angiogenesis, regardless of radiographic breast density.
Tumor angiogenesis leads to preferential enhancement of cancers with intravenous contrast.
Lesion morphology helps distinguish cancer from benign conditions.
The time-course of contrast enhancement helps distinguish invasive cancer from other conditions:
Technique
Patient Preparation
Benign hormone-related enhancement of normal breast tissue, called background enhancement, occurs before the onset of menses and can lead to false-positive studies. When possible, patients should be imaged 7 to 10 days after the onset of their menstrual cycle, when spurious contrast enhancement of normal breast tissue is at its nadir (Box 7-2).
Before MRI scanning, the patient fills out an MRI safety form to exclude contraindications of entering the strong magnetic field, such as ferromagnetic vascular clips, metallic ocular fragments, pacemakers, and implanted electromechanical devices. A qualified person reviews the standardized MRI safety form before scanning (Fig. 7-2).
Equipment
An IV catheter is placed before scanning and is continuously flushed by using the keep vein open (KVO) setting of an MRI-compatible remote power injector. Placement of the catheter in the antecubital fossa contralateral to any known, previous, or suspected malignancy is preferred. The patient is placed prone on a dedicated breast coil (Fig. 7-3A). Prone positioning minimizes respiratory motion in the breast. Phased-array breast coils maximize the signal-to-noise ratio of the image. Patient discomfort is the primary cause of motion; the majority of patients remain most comfortable for the duration of the entire scan with both arms at their sides and wearing hearing protection (see Fig. 7-3B). The technologist spends considerable time discussing the importance of “holding still” with the patient to obtain the best scan. The patient then works with the technologist to obtain a comfortable position within the breast coil. Optional mild breast stabilization, or “compression,” may be used to reduce breast motion and decrease the volume of tissue to be scanned so that the whole breast is included. However, firm compression (as used routinely for mammography) should be avoided because it may negatively affect contrast enhancement. Scanners with a magnetic field strength of 1.5 Tesla (T) or 3.0 T provide the best signal-to-noise ratio. Magnets with high-performance gradients enable the fastest, highest-resolution scans (Box 7-3).
MRI Protocols
Conventional breast MRI begins with T1-weighted images to define the position and anatomy of the breast. T1-weighted images using the signal from the “body coil” rather than the breast coil enable basic evaluation of the axillae, anterior mediastinum, chest wall, and supraclavicular fossa for enlarged regional lymph nodes. Thereafter, a dedicated breast coil signal should be used to perform all subsequent sequences. T2-weighted fast spin-echo (FSE) images are then obtained to characterize the breast and any lesions. T2-weighted scans using an FSE, turbo spin-echo (TSE), or rapid acquisition with relaxation inhibition (RARE) technique, produce high-quality images within reasonable scan times of 5 to 6 minutes. High fat signal on T2-weighted FSE images can be prevented with fat suppression and is most successful if unilateral scanning is performed (Table 7-2).
| Series | Description | Purpose |
|---|---|---|
| 1 | Axial T1 or STIR | Show lymph nodes and overall anatomy; localization |
| 2 | Fast T2* | Map cysts, ducts; assess lesion T2 |
| [3] | Diffusion-weighted EPI† | Assess lesion ADC |
| 4 | 3-D T1 fat-saturated spoiled gradient echo; 90 seconds or less‡ | Baseline prior to contrast injection |
| 5 | Repeat series 4 over 7–12 min with contrast§ | Assess contrast enhancement morphology and kinetics |
| [6] | 1H spectroscopy¶ | Measure choline |
| N/A | Postprocessing | Enhancement curves, subtraction, 3-D, measurements, parametric maps |
Sagittal imaging for all scans except series 1 allows smallest field of view (∼20 cm for most patients) and thus highest resolution.
Frequency encoding in the anteroposterior direction minimizes artifacts from cardiac and respiratory motion in the breast.
Series in brackets are optional, and not yet standard of care.
1H, proton (hydrogen nucleus); ADC, apparent diffusion coefficient; EPI, echo-planar imaging; FOV, field of view; FSE, fast spin echo; Gd-DTPA, gadolinium diethylenetriamine pentaacetic acid; IPAT, integrated parallel acquisition techniques; NEX, number of excitations or signal averages; RARE, rapid acquisition with refocused echoes; SENSE, sensitivity encoding; STIR, short tau inversion recovery; TE, echo time; TR, repetition time; TSE, turbo spin echo.
* T2: Fast spin-echo (FSE, RARE, TSE, etc.) with effective TE 80–100 ms and TR at least 3000 ms provides good T2 weighting. Use 3- to 4-mm-thick slices and 256×192 matrix or higher for small FOV sagittal images. Fat saturation improves conspicuity of bright lesions on T2, although nonfat-suppressed T2 imaging allows fat signal intensity to be used as a reference signal intensity. Volume shimming improves fat suppression.
† B-values have not been standardized yet, but most investigators use 500–1000 with good results. Parallel imaging may reduce distortions in echo planar imaging.
‡ Both fat suppression and high spatial resolution (<2 mm in all directions) are essential to assess lesion morphology. Rapid imaging (60–90 sec per scan or less) is necessary to assess contrast uptake kinetics. Use “fast” spoiled 3-D gradient echo (TR ≤ 6 ms; FA ∼ 15° for T1 weighting). Intermittent “special” fat saturation pulses speed imaging substantially over conventional fat saturation. Fractional k-space (“1/2 NEX,” etc.), and parallel imaging (SENSE/IPAT, etc.) maximize resolution obtained during the limited scan time.
§ Repeat rapidly for dynamic scans totaling approximately 7 minutes or more. Inject 0.1 mmol/kg standard low molecular weight gadolinium contrast agent (e.g., Gd-DTPA, gadoteridol, etc.) at 2 mL/sec followed by 20 mL flush (normal saline) at the start of the acquisition. Avoid negatively charged gadolinium agents if protocol includes spectroscopy, because they may reduce choline signal. (Lenkinski B, Wang X, Elian M, Goldberg SN: Interaction of gadolinium-based MR contrast agents with choline: implications for MR spectroscopy (MRS) of the breast, Magn Reson Med 61(6):1286–1292, 2009.
¶ Single-voxel choline spectroscopy. A minimum voxel size of 1 cm × 1 cm × 1 cm is recommended for adequate signal-to-noise. Localized shimming and high-quality spatial saturation pulses, fat suppression, and partial water suppression improve quality of spectra.
The Normal Breast MRI
Normal Breast MRI Findings
Typical images from a normal patient who underwent both bilateral dynamic and high-spatial resolution imaging are provided in Figure 7-4. On T1-weighted noncontrast-enhanced images, aqueous tissues (including skin, fibroglandular tissue, muscle, and lymph nodes) have moderately low signal intensity when compared with the higher signal intensity of fat, which has a short T1 relaxation time. In the absence of previous surgery or pathology, a layer of subcutaneous and retromammary fat completely surrounds the mammary gland tissue except where it enters the nipple–areola complex. The mammary gland itself is composed of a mix of low-signal fibroglandular tissue and high-signal fat lobules. The mix and distribution of fat and fibroglandular tissue vary greatly between patients—from dense, uniformly glandular tissue with almost no visible fat, to heterogeneous, to predominantly fatty tissue separated by thin strands or septa of fibroglandular tissue. In the ACR Breast Imaging Reporting and Data System (BI-RADS®) MRI lexicon the amount of dense glandular tissue by volume is described in the same terms as used in the mammography lexicon. These include almost all fat (0% to 25% dense), scattered fibroglandular tissue (25% to 50% dense), heterogeneously dense (50% to 75% dense), or dense (>75% dense) (Box 7-4 and Fig. 7-5).
After contrast injection, normal glandular tissue enhances to variable degrees. Normal fibroglandular breast tissue enhancement is called background enhancement in the BI-RADS® lexicon. An understanding of normal background enhancement is important because normal background enhancement can obscure cancers and make the MRI harder to read. Background enhancement describes slowly enhancing breast tissue within the breast. Specifically, normal fibroglandular tissue enhances with nonmasslike patterns, including stippled enhancement (tiny <5 mm foci of enhancement separated by normal tissue); scattered, regional, or multiple regions; or diffused stippled enhancement throughout both breasts. The areas of enhancement are usually separated by nonenhancing normal breast tissue between the normal background enhancing foci. In the BI-RADS® lexicon, the amount of background enhancement is described as a percentage of enhancing breast tissue with respect to the volume of the entire breast. Background enhancement is categorized in quartiles. The descriptors include none (0%), minimal (1% to 25%), mild (25% to 50%), moderate (50% to 75%), and marked (>75%) (Box 7-5 and Fig. 7-6).
Common Breast MRI Artifacts
Ghosting from cardiac or respiratory motion occurs in the phase-encoding direction (Table 7-3). It can be prevented from obscuring breast tissue by careful selection of phase- and frequency-encoding directions. Poor fat suppression is usually due to poor shimming or incorrect choice of the excitation center frequency, especially in patients with silicone implants (Fig. 7-7) or non–MRI-compatible objects, such as BB markers, magnetic tissue expanders, scar markers, and metal infusion ports, in or near the breast. Patient motion may cause blurring of the image, so it is especially important that the patient hold still and breathe quietly during scanning. On subtraction imaging, patient motion causes alternating bright and dark bands at fat–glandular tissue interfaces (see Fig. 7-7).
| Artifact | Cause |
|---|---|
| Line(s) of noise | Electronic noise/poor room shielding/scan room door open |
| Ghosting from heart across the breast | Wrong frequency-encoding direction |
| Blurring | Patient motion |
| Bright and dark edges on subtraction | Patient motion |
| Poor enhancement | Slow or failed contrast injection |
| Poor fat suppression | Poor shimming or center frequency, non-MRI compatible skin marker left on breast |
Poor breast tissue enhancement may be due to failed contrast injection, which can be confirmed by abnormal dynamic enhancement curves from the heart. The heart usually shows normal rapid, avid initial enhancement and rapid washout. In fact, one of the most common errors in contrast-enhanced breast MRI is the result of a poor bolus of IV contrast. Sometimes, the IV line is injected slowly or may even become detached from the vein; as a result, the contrast never enters the patient. To ensure rapid uptake of contrast and washout of signal intensity within the heart, one checks a region of interest over the heart or a large artery for a rapid intake bolus and late washout on the kinetic curve. This is important because only a good bolus of contrast will translate into breast cancer enhancing rapidly on the MRI scans. An abnormal or poor cardiac kinetic curve tells the radiologist that something is wrong with the contrast injection; further investigation is needed to determine why contrast in the heart did not rise in signal intensity rapidly and washout as expected. Scans that show poor contrast enhancement in the heart indicate a problem with the contrast injection and cannot be trusted to show cancer in the breast (Fig. 7-8).
Breast Lesions: Approach and Lexicon
To interpret studies of lesions on MRI, radiologists use a combination of high-spatial resolution scanning (which produces sharp images for analysis of abnormally enhancing findings or produces analysis by lesion morphology) and dynamic imaging (which produces the kinetic curves of an abnormally enhancing finding). In addition, T2-weighted imaging plays a secondary role in distinguishing some benign and malignant lesions (Table 7-4).
| T2 > Glandular Tissue or Muscle | T2 ≤ Glandular Tissue | |
|---|---|---|
| Enhances with contrast |
* The exceptions are rare mucinous carcinomas and some invasive ductal cancers, which may enhance and have high T2 signal; irregular, rim-enhancing morphology and dynamic enhancement curves may help with diagnosis.
Morphology
In the high-spatial resolution approach, lesion morphology is evaluated on fat-nulled, 3-D images to look for characteristic shapes, borders, or internal enhancement patterns characteristic of cancer. With this approach, Nunes and colleagues reported a sensitivity of 96% and a specificity of 80% for cancer. Leong and colleagues reported similar results. The morphologic characteristics of benign and malignant lesions are summarized in Table 7-1 and Box 7-6, and are shown in Figure 7-9. As discussed elsewhere in this chapter, the radiologist first decides if the finding is a mass or a nonmasslike enhancement. Consistent with mammography, masses with spiculated or very irregular borders are suspicious. Bright enhancement, particularly rim enhancement and enhancing septations, is usually suspicious for tumor angiogenesis. A ductal, linear, or segmental pattern of clumped enhancement is suspicious for ductal carcinoma in situ (DCIS), but it can also be seen in benign duct ectasia or fibrocystic change. As with mammography, entirely smooth, oval, or lobulated masses oriented parallel to Cooper ligaments suggest benign lesions, whereas lesions traversing Cooper ligaments are abnormal and suggest invasive ductal cancer. Nonenhancing internal septations in smooth, oval, or lobulated masses are highly specific for a benign fibroadenoma. Nonenhancing lesions are also benign. However, it is important to evaluate the dynamic curves of benign-appearing enhancing masses because round or oval homogeneous cancers mimic benign fibroadenomas. Sometimes the suspicious kinetic curves may be the only clue that the morphologically benign mass is a cancer.
Dynamic Contrast Enhancement
In the dynamic MRI approach, one evaluates a lesion’s signal intensity as a function of time during the bolus IV administration of contrast material (Box 7-7). The dynamic curves are evaluated according to initial and late enhancement. Initial enhancement describes the curve in the first 2 minutes during the bolus or when the curve begins to change. The late phase of enhancement occurs after the first 2 minutes or after the curve starts to change. The late-phase curve is described as persistent, plateau, or washout, in keeping with the ACR BI-RADS® MRI lexicon. The entire spectrum of the time course of enhancement may be categorized from most benign to most suspicious, according to the following scheme of Daniel and colleagues (Fig. 7-10): nonenhancing (type I), gradually enhancing (type II), or rapidly enhancing with a sustained gradual enhancement, plateau, or early washout (types III, IV, and V, respectively). In reference to the curve shapes depicted in Figure 7-7, types I and II typically indicate benignancy and types IV and V indicate a high likelihood of malignancy. Type III curves are indeterminate. Using a similar approach, Kuhl and colleagues reported a sensitivity of 91% and a specificity of 83%. Kuhl type I curves are gradually enhancing with a late persistent plateau. Kuhl type II curves are rapidly enhancing with a late plateau. Kuhl type III curves are rapidly enhancing with a late rapid washout. There are a few exceptions to these general principles. DCIS may exhibit any of the curve types, including nonenhancing or gradually enhancing curves, shown as types I and II in Figure 7-7. Benign papillomas may exhibit type I, II, III, or even type IV curves shown in Figure 7-7. The geographic distribution of dynamic enhancement also appears to be predictive, with tumors usually enhancing most rapidly at their periphery and benign lesions enhancing most rapidly at the center.
T2-Weighted Imaging
T2-weighted imaging also plays an important role in discriminating which enhancing lesions are likely to be benign or malignant (Fig. 7-11; see also Tables 7-1 and 7-4). Lesions with very high signal, in which the lesion is much brighter than glandular tissue and even higher than fat on nonfat-suppressed T2-weighted FSE images, suggest benign lesions such as cysts, fluid-filled ducts, lymph nodes, or fibroadenomas. Invasive tumor, on the other hand, usually has a T2 signal similar to that of glandular tissue, that is, higher than muscle but not as high as fluid. Low-signal septations within very high-signal smooth oval or lobulated lesions on T2-weighted imaging also suggest benign fibroadenomas. Exceptions to this “rule” include mucinous cancer, which can be very bright on a T2-weighted image. Some invasive ductal cancers also may be bright on T2-weighted images. These T2-bright cancers may show irregular margins and inhomogeneity; however, it is important to check kinetic curves on all masses because occasionally cancer may be round or oval and have smooth borders.
Figure 7-11 T2-weighted imaging features of benign and malignant disease. Very high signal on T2-weighted fast spin-echo images that is brighter than fat (on nonfat-suppressed sequences) and substantially brighter than glandular tissue suggests a benign lesion such as a cyst (A, arrow), intramammary lymph node (B, arrows), or fibroadenoma (C). Low-signal septa are particularly specific for fibroadenoma (see Fig. 7-18A). D, Most malignancies, unless frankly necrotic, have a signal intensity that is similar to that of fibroglandular tissue (arrow).
Approach to Interpretation and Reporting of Breast MRI
The ACR BI-RADS® provides a valuable standard for the terminology used to analyze breast lesions on MRI (Table 7-5) and is recommended for all breast MRI reporting. First, reporting should include a brief summary of the scan technique, including the scanner, field strength, and pulse sequences used; the specifics of contrast injection; and imaging findings and management recommendations.
Table 7-5 American College of Radiology BI-RADS®–MRI Lexicon Terms and Classification Scheme
Note: Stippled = nonconfluent < 2 mm dots of enhancement, sand-like. Heterogeneous = confluent and non-confluent, mixed enhancement. Clumped = confluent regions of enhancement, like cobblestones. Homogeneous = confluent, diffuse enhancement.
Reporting of kinetic data should also include the size of the region of interest used to generate the kinetic data and the location (i.e., edge, center, entire lesion), as well as the overall degree of enhancement (i.e., mild, moderate, strong).
Adapted from American College of Radiology: ACR BI-RADS®—MRI, In ACR Breast Imaging and Reporting and Data System, breast imaging atlas, Reston, VA, 2003, American College of Radiology.
To read the MRI, the radiologist reviews the breast history, clinical symptoms, and results of other imaging tests, such as mammogram, ultrasound, and positron emission tomography/computed tomography (Box 7-8). The radiologist then reviews the T1-weighted axial localizer to evaluate any findings outside the breast. These findings can be seen on either coronal or axial scout images, including fat-suppressed T1-weighted noncontrast axial images. Prior studies looking at findings in the thorax or abdomen outside the breast show lymph nodes within the mediastinum, supraclavicular regions, and other areas that the radiologist may not commonly search. Abnormal findings found elsewhere in the body on the breast MRI include lung cancer, bone metastases, liver lesions (most commonly liver cysts or hemangiomas), thyroid masses, and adrenal or renal masses (Fig. 7-12). A systematic search of the T1-weighted axial images and of the thorax (similar to evaluation of computed tomography scans) helps detect unexpected lesions in the thyroid, mediastinum, lungs, liver, spleen, adrenals, kidneys, and the bony thorax.
Box 7-8 Organized Approach to Breast MRI Interpretation
Breast history and old imaging reports
Review breast and nonbreast anatomy (thyroid, lungs, mediastinum, chest wall, liver, spleen, adrenals, kidneys, bones)
Review axillary lymph nodes (supraclavicular, level I–III, Rotter nodes)
T2-weighted scout noncontrast fat-nulled source
First postcontrast scan with fat nulled, suppressed, subtracted
Estimate background enhancement
High signal findings (higher than background)
Region of interest in heart: Check for good IV contrast bolus
If good bolus: check kinetics on important findings
Next, the radiologist looks at imaging findings on the first postcontrast scan. Specifically, the first postcontrast scan should have marked enhancement in the heart, blood vessels, and any rapidly enhancing finding, such as cancer or lymph nodes. The scans are usually obtained with the middle of k-space at approximately 90 seconds after the injection of contrast. The radiologist looks for the whitest part of the image and the background enhancement, which represents enhancement greater than normal background enhancement. Multiple foci in background enhancement represent normal findings; the radiologist judges whether it is normal or abnormal based on morphology, symmetry, kinetics, and change over time (Fig. 7-13). Abnormal enhancement findings would then be classified into either normal findings, for which nothing needs to be done, or abnormal findings, which need to be investigated further.
