[level-membership-for-pulmolory-and-respiratory-category]Chapter 4
Lung Volumes, Airway Resistance, and Gas Distribution Tests
1. Describe the measurement of lung volumes using gas dilution/washout methods.
2. Explain two advantages of measuring lung volumes using the body plethysmograph.
3. Calculate residual volume and total lung capacity from FRC and the subdivisions of VC.
4. Identify a restricted disease process from measured lung volumes.
5. Describe the measurement of airway resistance using the body plethysmograph.
1. Calculate FRC using helium dilution and nitrogen washout methods.
2. Describe the correct technique for measuring thoracic gas volume using body plethysmography.
3. Identify air trapping and hyperinflation using measured lung volumes.
4. Describe the differences between Raw, sGaw, and sRaw.
5. Identify uneven distribution of gas in the lungs by either single- or multiple-breath techniques.
closed-circuit, multiple-breath helium dilution (FRChe)
FRCpleth (FRC measured with the body plethysmograph)
functional residual capacity (FRC)
lung volume reduction surgery (LVRS)
open-circuit, multiple-breath nitrogen washout technique (FRCn2)
single-breath nitrogen washout test (SBN2)
specific airway conductance (sGaw)
Lung Volumes: Functional Residual Capacity, Residual Volume, Total Lung Capacity, and Residual Volume/Total Lung Capacity Ratio
Description
Functional residual capacity (FRC) is the volume of gas remaining in the lungs at the end of a quiet breath. On a simple spirogram, this point is termed the end-expiratory level (see Figure 2-1). Residual volume (RV) is the volume of gas remaining in the lungs at the end of a maximal expiration regardless of the lung volume at which exhalation was started (see Figure 2-1). Total lung capacity (TLC) is the volume of gas contained in the lungs after maximal inspiration. FRC, TLC, and RV are reported in liters (L) or milliliters (mL), corrected to BTPS. The RV/TLC ratio defines the fraction of TLC that cannot be exhaled (RV), expressed as a percentage.
Technique
There are a variety of methods for measuring absolute lung volumes (Table 4-1). FRC is measured directly with the open-circuit multiple-breath N2 washout, closed-circuit multiple-breath He dilution, and body plethysmographic techniques. Once FRC and VC have been measured, RV and TLC can be calculated. TLC can be estimated directly with the single-breath N2 washout, and single-breath He dilution as part of the diffusing capacity (Dlco) test, and by chest imaging techniques. RV can only be measured indirectly once FRC or TLC has been determined.
Table 4-1
Methods for Measurement of Lung Volumes
| Method | Lung Volume | Advantages/Disadvantages |
| Multiple-breath He dilution | FRC | Simple, relatively inexpensive; affected by distribution of ventilation in moderate or severe obstruction; multiple-breath; requires IC, ERV to calculate other lung volumes |
| Multiple-breath N2 washout | FRC | Simple, relatively inexpensive; affected by distribution of ventilation in moderate or severe obstruction; multiple-breath; requires IC, ERV to calculate other lung volumes |
| Single-breath N2 washout | TLC | Calculated from single-breath N2 distribution test; may underestimate lung volume in the presence of obstruction |
| Single-breath He (or other inert gas; e.g., neon) dilution | TLC | Calculated as part of Dlco (VA); may underestimate lung volume in the presence of obstruction |
| Plethysmography | VTG (FRCpleth) | Plethysmographic method more complex, but very fast; tends to be more accurate in the presence of airway obstruction than gas dilution techniques |
| Chest radiograph | TLC | Requires posterior-anterior and lateral chest x-ray films; must breath-hold at TLC; not accurate in the presence of diffuse, space-occupying diseases |
| Chest computerized tomography (CT) | TLC | Involves radiation exposure and increased cost; must breath-hold at TLC; underestimates lung volumes in the presence of airway obstruction |
| Magnetic resonance imaging (MRI) | TLC | No radiation exposure; very costly; research tool only |
Dlco, Diffusing capacity; IC, inspiratory capacity; N2, nitrogen; VA, alveolar volume.
Open-Circuit, Multiple-Breath Nitrogen Washout

FEN2final = fraction of N2 in volume expired
FAN2alveolar1 = fraction of N2 in alveolar gas initially
FAN2alveolar2 = fraction of N2 in alveolar gas at end (from an alveolar sample)
N2tissue = volume of N2 washed out of blood/tissues
The original N2 washout technique lasted 7 minutes. However, not all of the N2 in the lungs may be washed out, even after 7 minutes of 100% O2 breathing. The FAn2alveolar2 is measured at the end of the test and subtracted from the initial N2 concentration. Correction for the “switch-in” error should also be made (see Correcting for the Switch-in Error). The final FRC is then corrected to BTPS, and volume of the equipment dead space (including filters) must be subtracted (see the Sample Calculations on Evolve at http://evolve.elsevier.com/Mottram/Ruppel/).

Some available commercial systems use a rapid N2 analyzer in combination with a spirometer to provide a “breath-by-breath” analysis of expired N2 (Figure 4-1, A). An alternative approach is to use fast-response O2 and carbon dioxide (CO2) analyzers to calculate the concentration of N2 in expired gas during the washout:
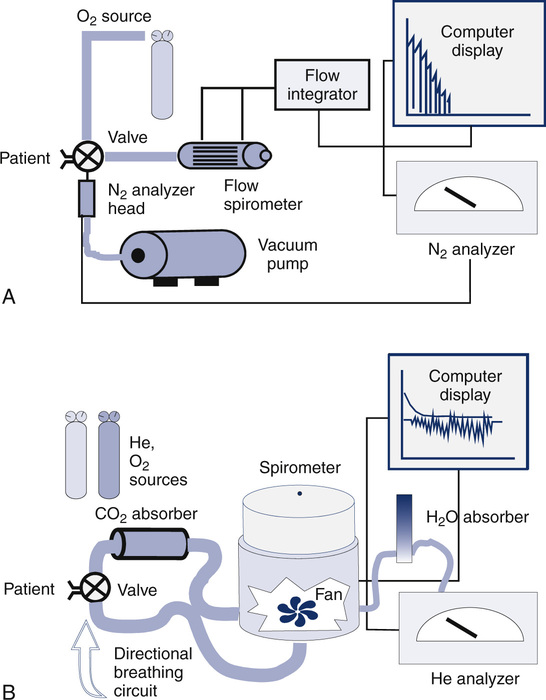
(A) Open-circuit equipment used for N2 washout determination of FRC. The patient inspires O2 from a regulated source and exhales past a rapidly responding N2 analyzer into a pneumotachometer. FRC is calculated from the total volume of N2 exhaled and the change in alveolar N2 from the beginning to the end of the test (Figure 4-2 and open-circuit method); (B) Closed-circuit equipment used for He dilution FRC determination includes a directional breathing circuit with a volume-based spirometer, He analyzer, CO2 absorber, O2 source, and water absorber. A breathing valve near the mouth allows the patient to be “switched in” to the system after He has been added and the system volume determined. Tidal breathing and the He dilution curve are displayed on the computer.

FEo2 = fraction of O2 in expired gas (dry)
FEco2 = fraction of CO2 in expired gas (dry)
In these fast methods, the patient, wearing a noseclip, breathes through a mouthpiece-valve system. Precisely at end-expiration, a valve is opened to allow 100% O2 breathing to begin. Each breath of 100% O2 washes out some of the residual N2 in the lungs. Analog signals proportional to N2 concentration and volume (or flow) are integrated to derive the volume of N2 exhaled for each breath. Values for each breath are summed to provide a total volume of N2 washed out (Figure 4-2). The test is continued until the N2 in alveolar gas has been reduced to approximately 1% (Criteria for Acceptability 4-1). Some older systems terminate the test at 7 minutes. However, the O2 breathing should be continued until alveolar N2 falls to less than 1.5% for at least three consecutive breaths. A change in inspired N2 concentration of greater than 1% or sudden large increases in expiratory N2 concentrations indicate a leak, in which case the test should be stopped and repeated.
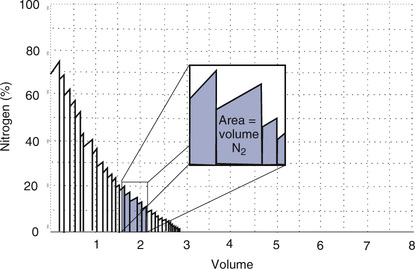
The concentration (or log concentration) of N2 is plotted against time or against the volume expired as the patient breathes through a circuit (Figure 4-1, A). The volume of N2 expired with each breath is measured by integrating flow and N2 concentration to determine the area under each curve (see inset). FRC is determined by dividing the volume of N2 expired by the change in alveolar N2 from the beginning to the end of the test, with corrections, as described in the text.
accomplished by software or electronic correction of the analyzer output.
Closed-Circuit, Multiple-Breath Helium Dilution
FRC can also be determined by equilibrating the gas in the lungs with a known volume of gas containing He (closed-circuit, multiple-breath helium dilution [FRChe]). A spirometer is filled with a known volume of air, and then a volume of He is added so that a concentration of approximately 10% is achieved (see Figure 4-1, B). The exact concentration of He and spirometer volume is measured and recorded before the test is begun. The patient breathes through a valve that allows a connection to a rebreathing system. The valve is opened at the end of a quiet breath (i.e., the end-expiratory level). Then the patient rebreathes the gas in the spirometer, with a CO2 absorber in place, until the concentration of He falls to a stable level (Figure 4-3). A fan or blower mixes the gas within the spirometer system. O2 is added to the spirometer system to maintain the Fio2 near or above 0.21 and to keep the system volume relatively constant.
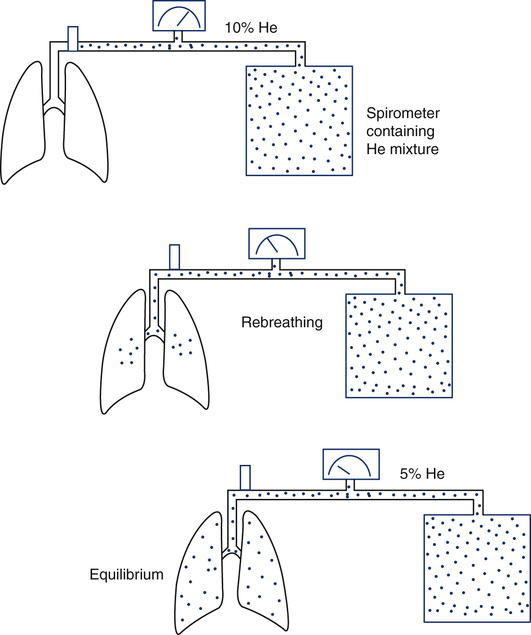
At the beginning of the test, the patient’s lungs contain no He. The spirometer contains a known concentration of He in a known volume (see text). The patient then rebreathes the He mixture from this system (Figure 4-1, B). He is diluted until equilibrium is reached. At the end of the test, the known volume of He has been diluted in the rebreathing system and the lungs. FRC is calculated from the change in He concentration and the known system volume. The patient must be switched from breathing air to the He mixture at the end-expiratory level for accurate measurement of FRC. RV is derived by subtracting the ERV. (Modified from Comroe JH Jr, Forster RE, Dubois AB, et al. The lung: Clinical physiology and pulmonary function tests. 2nd ed. St. Louis: Mosby; 1962.)
Equilibration between normal lungs and the rebreathing system takes place in approximately 3 minutes when a 10% He mixture in a system volume of 6–8 L is used (Figure 4-4). The final concentration of He is then recorded. The system volume is computed first. System volume is the volume of the spirometer, breathing circuitry, and valves before the patient is connected. It can be calculated as follows:
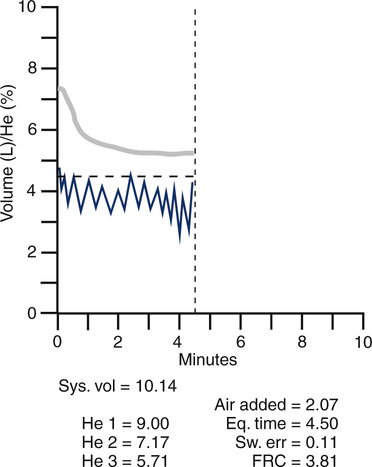
Graph shows He concentration from the beginning of rebreathing until equilibrium is achieved (upper line). System volume of the spirometer and the patient’s tidal breathing is also shown (lower line). A CO2 absorber removes carbon dioxide produced by the patient. A computerized valve system replaces O2 to keep the system volume constant. Measurements of He concentrations and system variables are also displayed.

Headded = volume of He placed in the spirometer in liters (L)
Fhe initial = % He converted to a fraction (%He/100)
When the system volume is known, FRC can be computed as follows:

Some automated systems use a similar method to calculate the system volume; a small amount of He is added to the closed system, followed by a known volume of air. The change in He concentration after the addition of the air is used to determine the system volume. Rebreathing is continued until the He concentration changes by no more than 0.02% in 30 seconds (Criteria for Acceptability 4-2).
Additional Comments on FRC by Gas Dilution Techniques
In either of the gas dilution techniques, a leak will cause erroneous estimates of FRC. Leaks may occur in breathing valves or circuitry, or at the patient connection. Some patients have difficulty maintaining an adequate seal at the mouthpiece throughout the test. Failure to properly apply noseclips can also result in a leak. Leaks usually result in an overestimate of lung volume. A leak in the open-circuit N2 washout system allows room air to enter, increasing the volume of N2 washed out. A leak in the closed-circuit He dilution system allows air to dilute the He concentration or He to escape. Each situation causes the test gas concentration to change more than it should. Leaks during the N2 washout can usually be identified by an inspection of the graphic display or recording (Figure 4-5). Inaccuracy or malfunction of the gas analyzers in either method often causes errors. Leaks or analyzer problems should be considered whenever FRC values are inconsistent with spirometry results (See Interpretive Strategies Box 4-1).
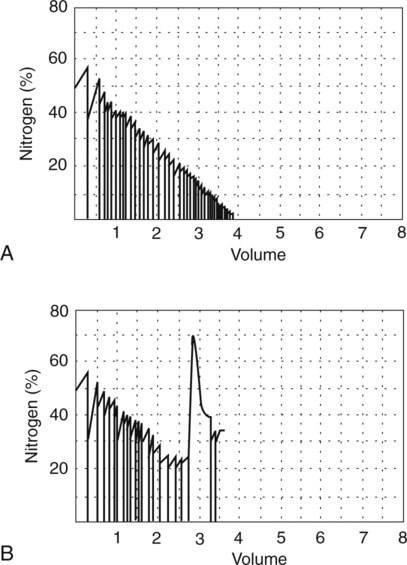
(A) A computer-generated recording of a nitrogen (N2) washout test in a healthy patient. The tracings show a continuous decrease in end-tidal N2 concentration with successive breaths. The test is continued until the N2 concentration falls to less than 1%. (B) A similar plot of N2 washout from a healthy patient, but, in this instance, a leak occurs during the test. Leaks may occur if the patient does not maintain a tight seal at the mouthpiece. Leaks are usually easy to detect because room air enters the system and causes an abrupt increase in N2 concentration.
Body Plethysmography
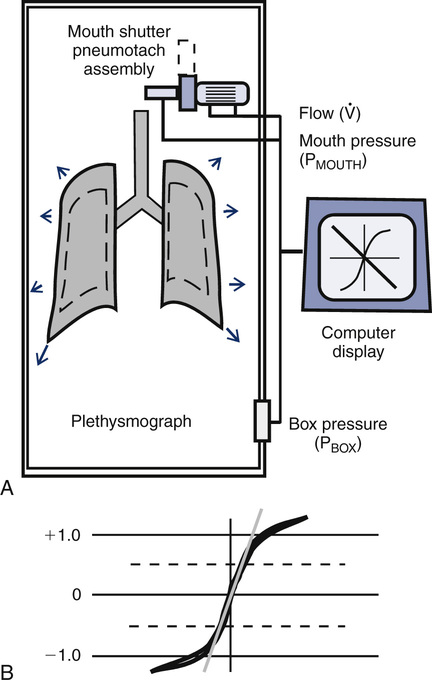
FRC measured with the body plethysmograph (FRCpleth) (Figure 4-6) refers to the volume of intrathorax gas measured when airflow occlusion occurs at end-expiration (FRC) during shutter closure. The technique is based on Boyle’s law relating pressure to volume. A volume of gas varies in inverse proportion to the pressure to which it is subjected if the temperature remains constant (isothermal). The patient has an unknown volume of gas in the thorax at the end of a normal expiration (i.e., the FRC). The airway is occluded momentarily at or near FRC; the patient is asked to gently pant at a frequency between 0.5 and 1.0 Hz (0.5–1.0 cycles per second), allowing the air in the chest to be compressed and decompressed. This causes a change in volume and pressure. The changes in pressure are easily measured at the mouth (Pmouth) with a pressure transducer. Mouth pressure theoretically equals alveolar pressure when there is no airflow. Changes in pulmonary gas volume are estimated by measuring pressure changes in the plethysmograph. The pressure in the plethysmograph is measured by a sensitive transducer. This transducer is calibrated by introducing a small, known volume of gas into the sealed box and relating the pressure change to the known volume (Pbox). The calibration factor is then applied to measurements made on human patients.
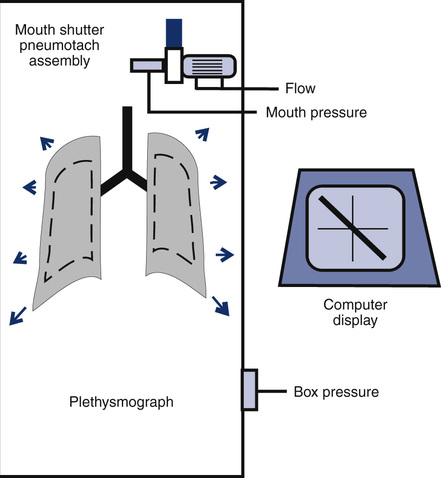
Boyle’s law states that volume varies inversely with pressure if temperature is held constant. A pressure-type (constant volume) plethysmograph, with pressure transducers for measurements of box pressure and mouth (alveolar) pressure, is shown. A pneumotachometer measures flow to track lung volumes. The mouth shutter occludes the airway momentarily so alveolar pressure can be estimated. The patient pants gently against the closed shutter. Gas in the lungs is alternately compressed and decompressed. Changes in lung volume are reflected by changes in box pressure. These changes are displayed as a sloping line on a computer display. When the original pressure (P), the new pressure (P +ΔP), and the new volume (V +ΔV) are known, the original volume (V or VTG) can be computed from Boyle’s law (see the section on the technique of thoracic gas volume and see Evolve at http://evolve.elsevier.com/Mottram/Ruppel/).
The display of the panting maneuver is a graph with Pmouth and Pbox. Pmouth is plotted on the vertical axis, and Pbox is plotted on the horizontal axis (Figure 4-7). The resulting figure appears as a sloping line equal to DP/DV, where DP equals change in alveolar pressure and DV equals change in alveolar volume. Change in alveolar volume is measured indirectly by noting the reciprocal change in plethysmograph volume.
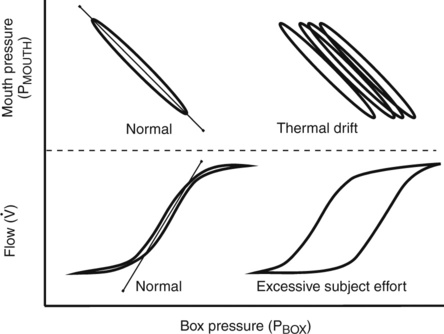
Top left, Normal closed-shutter maneuver in which mouth pressure is plotted against box pressure. The loop should be closed, or nearly so. If thermal equilibrium has not been achieved, the loop (shown on the top right) tends to be open and to drift across the screen. Bottom left, Normal open-shutter measurement in which flow is plotted against box pressure. If the patient pants near FRC, the loop takes on a nearly closed S-shaped appearance. If the patient pants too rapidly or too deeply, the tracing becomes open and flattened (shown on the bottom right). Thermal drift can also cause the open-shutter tracing to resemble excessive patient effort.
The VTG can then be obtained from the slope of the tracing by applying a derivation of Boyle’s law:
PB = barometric pressure minus water vapor pressure
λVTG = slope of the displayed line equal to DP/DV
Pboxcal = box pressure transducer calibration factor
Pmouthcal = mouth pressure transducer calibration factor
K = correction factor for volume displaced by the patient
For the complete derivation of the equation and sample calculations, see Evolve (http://evolve.elsevier.com/Mottram/Ruppel/).
lung volume can be monitored by continuously integrating the flow through the plethysmograph’s pneumotachometer. The end-expiratory level can be determined from tidal breathing. The patient then pants with the mouth shutter open. The computer records the change in lung volume above or below the resting level (FRC). When asked to pant, most patients do so slightly above FRC. The shutter then closes automatically, the patient continues panting, and VTG is measured as described. The computer then adds or subtracts the change in volume from the end-expiratory level (before panting began) to calculate the true FRC. This computerized technique allows the patient to pant at the correct frequency and depth before the shutter is closed. It also eliminates the necessity of closing the shutter precisely at end-expiration. Raw and sGaw can also be measured simultaneously during the open-shutter panting (see following text). It should be noted that the correct panting frequencies for measuring Raw and VTG are slightly different. Raw measurements should be made with the patient panting at about 1.5–2.5 Hz (1.5–2.5 cycles per second, or 90–150 breaths/min), whereas VTG should be measured with the patient panting at a slower rate of 0.5–1 Hz. Many computerized systems display the panting frequency so the technologist can coach the patient to achieve the correct rate.
Depending on the construction of the plethysmograph, venting to the atmosphere is usually required to establish thermal equilibrium. Equilibrium takes about 30-60 sec and can be presumed when the flow-volume recording stabilizes (i.e., does not drift). The patient is then instructed to pant. When the correct panting frequency and depth have been established, the shutter may be closed. Some plethysmograph systems require tidal breathing before shutter closure to establish the patient’s end-expiratory level. In either type of system, the patient should pant against the closed shutter until a stable tracing is produced. Two to four pants are usually sufficient. If the patient pants too hard, the tracing may drift or appear as an “open” loop (see Figure 4-7). The recorded pressure changes should be within the range over which the transducers were calibrated. The entire tracing should be visible on the display. If the tracing goes off-screen, the pressure changes probably exceed the calibration ranges. Three or more technically satisfactory maneuvers should be recorded, each followed by ERV and IVC maneuvers (Criteria for Acceptability 4-3). At least three FRCpleth values that agree within 5% should be obtained and the mean value reported. The technologist’s comments should note the acceptability of the maneuvers. Most computerized plethysmographs automatically measure the slope of the DP/DV tracings. This is done by using the least-squares method to calculate a “best-fit” line through the recorded data points. The technologist may need to correct computer-generated tangents, depending on data quality from the panting maneuvers.
Additional Comments on FRC by Plethysmography
The plethysmographic method is a quick and accurate means of measuring lung volumes. It can be used in combination with simple spirometry to derive all lung volume compartments. The plethysmograph’s primary advantage is that it measures all gas in the thorax, whether in ventilatory communication with the atmosphere or not. The plethysmographic measurement of FRC is often larger than that measured by He dilution or N2 washout. This is the case in emphysema and other diseases characterized by air trapping, as well as in the presence of an uneven distribution of ventilation. When gas dilution tests are continued for more than 7 minutes, the results for FRC determinations approach the VTG value. See Interpretive Strategies 4-2.
Two varieties of body boxes are commonly used: constant-volume and flow-based (see Chapter 11). For constant-volume plethysmographs, spirometry is done with the door open. Flow-based plethysmographs have the advantage of allowing forced spirometry with the door closed. Flow boxes also allow a slightly different type of flow-volume curve to be recorded. Normal spirometry plots airflow at the mouth against volume at the mouth (as detected by the spirometer). With the patient in a flow box, flow at the mouth can be plotted against actual lung volume changes as detected by the box. This may be particularly useful in patients with severe airway obstruction. It is possible to detect a significant compression volume during forced expiration and plot it against the flow generated. Spirometry, lung volumes, and airway resistance can all be obtained in a single sitting with either type of plethysmograph.
Total Lung Capacity and Residual Volume/Total Lung Capacity Ratio


Each method requires accurate measurement of the subdivisions of the VC. TLC can also be calculated with single-breath techniques (i.e., single-breath He dilution or single-breath N2 washout). Single-breath measurements of lung volumes are usually done as part of other tests, such as the diffusing capacity (Dlco) test (see Chapter 3). Single-breath lung volumes correlate well with multiple-breath techniques in healthy patients. However, single-breath lung volumes tend to underestimate true values in moderate to severe obstruction. TLC can also be measured from standard chest x-ray films, as well as from CT scans of the thorax.
Significance and Pathophysiology
FRC varies with body size, with change in body position, and with time of day (i.e., diurnal variation). However, unlike TLC and RV, FRC is an effort-independent maneuver that is determined by the balance of lung and chest wall recoil at relaxed end-expiration. As with other lung volumes, normal FRC may be affected by racial or ethnic background (Interpretive Strategies 4-1 and 4-2). Equations for calculating predicted FRC can be found on Evolve (http://evolve.elsevier.com/Mottram/Ruppel/).
The RV is the volume left in the lungs after the VC is exhaled. An increased RV indicates that, despite maximal expiratory effort, the lungs contain a larger volume of gas than normal. Increased RV often results in an equivalent decrease in VC (Figure 4-8). Elevated RV may occur during an acute asthmatic episode but is usually reversible. Increased RV is characteristic of emphysema and bronchial obstruction; both may cause chronic air trapping. RV and FRC usually increase together. As RV becomes larger, increased ventilation is needed to adequately exchange O2 and CO2 in the lung. This requires an increase in tidal volume, respiratory rate, or both. Because of altered pressure-volume characteristics of the lung, work of breathing is also increased. Patients with increased RV often display gas exchange abnormalities such as hypoxemia or CO2 retention. Because RV is effort-dependent, elevated RV may also be caused by muscle weakness or suboptimal effort.
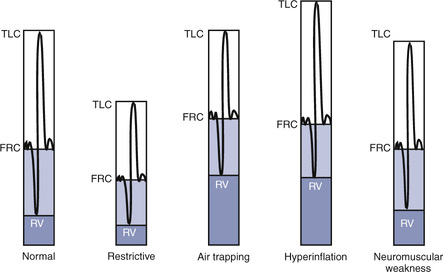
A comparison of changes in lung volume compartments and VC (superimposed) shows the following: in restrictive patterns FRC, RV, and VC are all decreased proportionately, resulting in a decrease in the TLC, which defines restriction (see text). In obstruction (with air trapping), FRC and RV are both increased at the expense of the VC, and therefore TLC remains relatively unchanged. Similar increases in RV and FRC may occur without reduction of VC, in which case the TLC increases (hyperinflation). In neuromuscular weakness, the FRC is normal, but the TLC is reduced and the RV/TLC is too high.
Table 4-2 lists comparative lung volumes for a healthy adult male and for patients with air trapping (as in emphysema), hyperinflation, restriction (as in sarcoidosis) and neuromuscular weakness (as in amyotrophic lateral sclerosis–ALS).
Table 4-2
| Value | Normal | Air Trapping | Hyperinflation | Restriction | Neuromuscular Weakness |
| VC (L) | 4.80 | 3.00 | 4.80 | 3.00 | 3.50 |
| FRC (L) | 2.40 | 3.60 | 3.60 | 1.50 | 2.40 |
| RV (L) | 1.20 | 3.00 | 3.00 | 0.75 | 1.50 |
| TLC (L) | 6.00 | 6.00 | 7.80 | 3.75 | 5.00 |
| RV/TLC (%) | 20 | 50 | 38 | 20 | 30 |
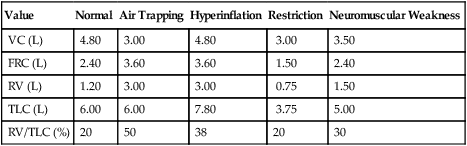
In obstruction, two different patterns may be observed. RV is usually increased. This increase may be at the expense of a reduction in VC (see Figure 4-6), with TLC remaining close to normal. In other cases, RV may increase while VC is preserved, so TLC is greater than predicted. The term air trapping is sometimes used to describe an increase in FRC and RV, and the term hyperinflation is used to describe the absolute increase in TLC. TLC may be either normal or increased in obstructive processes such as asthma, chronic bronchitis, bronchiectasis, cystic fibrosis, and emphysema. TLC does not appear to change dynamically, even though FRC may increase acutely during exercise.
proportional decreases in most lung compartments as described for FRC and RV. When the TLC value is less than 80% of predicted, or less than the 95% confidence limit, a restrictive process is present. Reduced VC, along with a normal or increased FEV1/FVC ratio, is suggestive of restriction, but a measurement of TLC is needed to confirm the diagnosis of a restrictive defect.
Airway resistance and conductance
Description
Technique
Raw can be measured as the ratio of alveolar pressure (PA) to airflow ( ). Gas flow at the mouth is measured with a pneumotachometer (see Chapter 11). PA is measured in the body plethysmograph (Figure 4-9, A). For gas to flow into the lungs during inspiration, PA must fall below atmospheric pressure (mouth pressure). During expiration, PA rises above atmospheric pressure. Changes in
  are plotted against plethysmograph pressure changes. Changes in plethysmograph pressure are proportional to alveolar volume changes. The patient pants with a small VT at a rate of about 1.5–2.5 breaths/sec (1.5–2.5 Hz). Shallow, rapid breathing produces an S-shaped pressure-flow curve (see Figure 4-9, B). A tangent (the slope) is measured from this curve. Traditionally, the tangent is drawn to pass through zero flow and connects the +0.5 L/sec and –0.5 L/sec flow points. The slope of this line is the ratio of
  / Pbox.
  is flow at the mouth, and Pbox is plethysmograph pressure.
(A) diagrammatic representation of airway resistance measurement:
Raw = Atmospheric pressure-alveolar pressure/Flow
Flow (
 ) is measured directly by means of the pneumotachometer. As the patient pants with the shutter open, flow is plotted against box pressure (
 /Pbox) as it occludes the airway momentarily, usually at end-expiration, and a sloping line representing the ratio of mouth pressure to box pressure (Pmouth/Pbox) is recorded in a manner similar to that used for measurement of VTG. In this example, the flow tracing (shutter open) and volume tracing (shutter closed) are superimposed on the computer display. The Pmouth/Pbox tangent is measured as for the VTG; (B) The flow tangent is measured from the steep portion of the flow tracing, from -0.5 to + 0.5 L/sec. Airway resistance is then calculated as the ratio of these two tangents, using appropriate calibration factors (see text and Evolve at http://evolve.elsevier.com/Mottram/Ruppel/).
Problems with the open-shutter panting technique are illustrated by the loops seen in Figure 4-10. The most common problems are thermal drift, or panting at too high or low a frequency or volume.
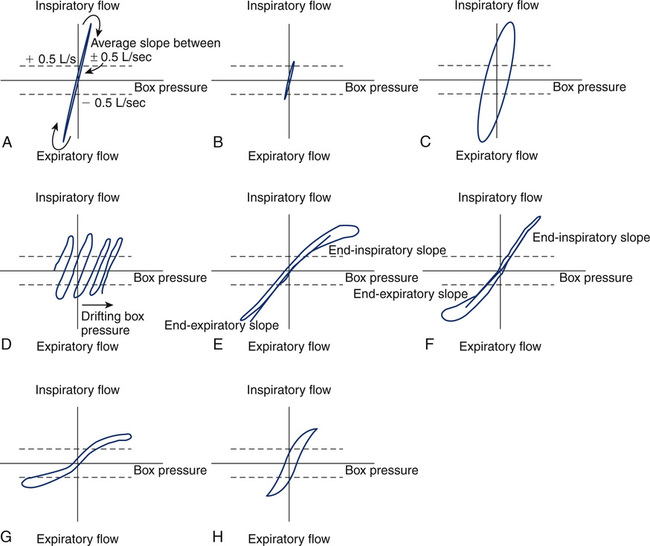
(A) Normal tracing, showing narrow loop and consistent slope on both inspiration and expiration; (B) Small, narrow loop caused by panting frequency that is too high or panting volume that is too small; (C) Wide, large loop (hysteresis) caused by panting frequency that is too low or panting volume that is too large; (D) Thermal drift caused by the failure of body plethysmograph to come to a steady temperature before obtaining panting loops; (E) High inspiratory resistance, causing hysteresis and flattening of inspiratory portion of panting loop. Notice that separate inspiratory and expiratory tangents (slopes) can be obtained; (F) High expiratory resistance, causing hysteresis and flattening of expiratory portion of panting loop; (G) High inspiratory and expiratory resistance caused by fixed airway obstruction, causing flattening of both inspiratory and expiratory portions of panting loops; (H) Typical loop seen in asthma, with slight widening and flattening of the loop, indicative of overall increased resistance.
Raw is then calculated by taking the ratio of these two slopes, as follows:
 = airflow
Pbox = plethysmographic pressure, measured with the shutter open and closed
Mouth cal = calibration factor for the mouth pressure transducer
Flow cal = calibration factor for the pneumotachometer
This formula shows how Raw is calculated from the ratio of PA and  , as Pbox cancels out. Calibration factors for the flow and mouth pressure transducers are included in the previous equation. (See the Sample Calculations on Evolve (http://evolve.elsevier.com/Mottram/Ruppel/).
Gaw can be calculated as the reciprocal of Raw. Specific conductance is calculated by dividing Gaw by the lung volume at which it was measured, which is VTG calculated from the closed shutter maneuver. sGaw should be calculated separately for each Raw maneuver because the lung volume at which measurements are made influences Raw and Gaw. After three to five acceptable trials are obtained, calculated Raw and sGaw are averaged. Individual values should be within approximately 10% of the mean (Criteria for Acceptability 4-4).
Computerized plethysmographs permit thoracic gas volume (VTG), Raw, and sGaw to be measured from a combined maneuver. The patient breathes through the pneumotachometer with the plethysmograph sealed. Tidal breathing is recorded with the patient breathing near FRC. The computer stores this end-expiratory volume as a reference point. Then the patient pants, and the open-shutter slope of  /Pbox is recorded. The mouth shutter is then closed and Pmouth /Pbox is recorded as described previously. The VTG in this maneuver does not equal the FRC because the shutter is closed at a volume different from the FRC. However, the change in volume from the tidal breathing level was stored at the beginning of the maneuver. This volume is the “switch-in” volume described earlier and can be added to or subtracted from the VTG to determine FRC. Most patients pant above their FRC, so the VTG in this combined method is usually slightly greater (Figure 4-11). Because of this issue, a separate test to measure FRC for use in calculating absolute lung volumes may need to be done and is often recommended.
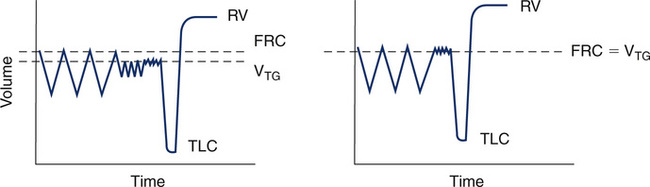
On the left, a combined open followed by closed shutter maneuver was performed to obtain both Raw and VTG. Inhalation is down and exhalation is up. Because VTG drifted above FRC (downward in the tracing) during the open panting maneuver, VTG is higher than FRC. VTG, in this case, is still necessary to calculate sGaw, but it is a poor approximation of FRC. On the right, only a closed shutter maneuver was performed to measure VTG, which closely approximates FRC. In this case, a separate open shutter maneuver is needed to measure Raw, followed by a closed shutter maneuver to calculate sGaw.
FRC, functional residual capacity; RV, residual volume; VTG, thoracic gas volume; TLC, total lung capacity.
Significance and Pathophysiology
Raw in healthy adults is divided across the airway as follows:
Nose, mouth, upper airway = 50%
Lesions obstructing the larger airways (e.g., tumors, traumatic injuries, or foreign bodies) may also cause a significant increase in Raw. Large airway obstruction is often accompanied by increased work of breathing and dyspnea on exertion. Airflow in the trachea and mainstem bronchi is predominately turbulent. Any large airway obstruction can exaggerate this turbulent flow. For this reason, Raw and SGaw may be more sensitive to elevations in central airway resistance than FEV1. Breathing low-density gas mixtures (e.g., helium + oxygen) reduces Raw and therefore the work of breathing. The shapes of the open panting loops may give clues as to the underlying pathophysiology, as seen in Figure 4-10.
Raw and sGaw measurements are not influenced by the degree of patient effort, so Raw and sGaw measurements may be useful for determining airway status in patients who are unable or unwilling to exert maximum effort. However, acceptable panting maneuvers in the plethysmograph require a certain degree of patient coordination. Not all patients may be able to perform these maneuvers. Patients with severe obstruction may produce pressure-flow curves during panting that are difficult to measure. Such curves may be flat (see Figure 4-10) or show widening (hysteresis). Inspiratory and expiratory flows may produce different resistances, causing the curve to appear as a loop (see Figure 4-10). In these cases, inspiratory flow resistance is usually reported.
In addition to measuring Raw by use of the body plethysmograph, measurement of Raw by means of the forced oscillation technique is becoming increasingly common. For further discussion, see Chapter 10.
Gas distribution tests: single-breath nitrogen washout, closing volume, and closing capacity
Description
Technique
The test is performed with equipment similar to that used for the open-circuit FRCn2 determination (see Figure 4-1, A). The patient exhales to RV, then inspires a VC breath of 100% O2 from a reservoir or demand valve. The 100% O2 dilutes the N2 present in the lungs. Without holding the breath, the patient exhales slowly and evenly at a flow of 0.3–0.5 L/sec. The N2 concentration is measured by an N2 analyzer, while the exhaled volume is measured by the spirometer. Volume expired is plotted against N2 concentration on a graph (Figure 4-12). This washout curve can be divided into four phases:
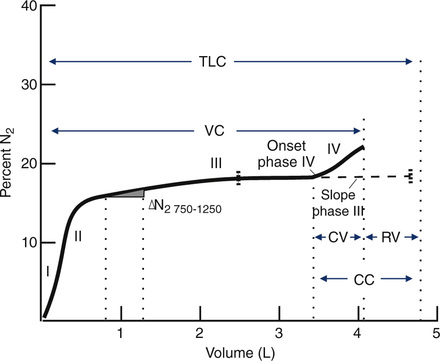
A plot of increasing N2 concentration on expiration after a single VC breath of 100% O2. The curve is divided into four phases. Phase I is the extreme beginning of the expiration, when only O2 is being exhaled. Phase II shows an abrupt rise in N2 concentration as mixed bronchial and alveolar air is expired. Phase III is the alveolar gas plateau. N2 concentration changes slowly as long as ventilation is uniformly distributed. Phase IV is an abrupt increase in N2 concentration as basal airways close and a larger proportion of gas comes from the N2–rich lung apices. Several useful parameters are derived from the SBN2 tracing. The
 N2 750–1250 and slope of phase III are indices of the evenness of ventilation distribution. CV can be read directly from the onset of phase IV until RV is reached; VC can also be read directly. RV, TLC, and CC can be calculated if the area under the curve is determined either by planimetry or electronic integration (see text).
Phase I: upper airway gas from the anatomic dead space (VDanat), consisting of 100% O2
Phase II: mixed dead space gas in which the relative concentrations of O2 and N2 change abruptly as the VDanat volume is expired
Phase III: a plateau caused by the exhalation of alveolar gas in which relative O2 and N2 concentrations change slowly and evenly
Phase IV: an abrupt increase in the concentration of N2 that continues until RV is reached
 N2 (%N2 750–1250).
 %N2 per liter of lung volume.
CC is recorded as a percentage of TLC:

FEN2= mean expired N2 concentration determined by integration of the area under the curve
FAN2 = N2 concentration in the lungs at the beginning of inspiration, approximately 0.75–0.79
This method is accurate only in patients who do not have significant obstruction or dead space–producing disease. CV and CC measurements may be in error if the patient does not perform an acceptable VC maneuver (Criteria for Acceptability 4-5). The inspired and expired VC should be within 5%. The VC during the SBN2 should match the FVC or VC within 5% or 200 mL. Expiratory flow should be maintained between 0.3 and 0.5 L/sec.
Significance and Pathophysiology
See Interpretive Strategies 4-3.
Interpretive strategies 4-3 SBN2
1. Was the test performed acceptably? Was the VC reproducible within 5% or 200 mL? Is expiratory flow appropriate?
2. Are reference values appropriate? Age, height, sex, race?
3. Is  %N2 750–1250 greater than 1.5%? If so, suspect uneven distribution of ventilation.
4. Is the slope of phase III greater than 1.0%–1.5%? If so, there is an uneven distribution of ventilation.
5. Is CV/VC% greater than 20% (or age-related expected value)? If so, suspect small airway abnormalities. Correlate with clinical findings.
 %N2 750–1250
 %N2 750–1250 is 1.5% or less for healthy young adults and slightly higher for healthy older adults (up to approximately 3%). Increased
  %N2 750–1250 is found in diseases characterized by uneven distribution of gas during inspiration or unequal emptying rates during expiration, such as asthma, COPD, or cystic fibrosis. In patients with severe emphysema,
  %N2 750–1250 may exceed 10%.
 %N2 750–1250. Values in healthy young adults range from 0.5%–1.0% N2/L of lung volume, with wide variability. Very slow expiratory flow rates may cause oscillations in the tracing of phase III, making the accurate measurement of
  %N2 difficult. These oscillations are attributed to changes in alveolar N2 concentrations as blood pulses through the pulmonary capillaries during cardiac systole. Increasing the expiratory flow rate slightly eliminates this artifact. Patients who have small VC values may have difficulty exhaling enough gas to make the
  %N2 or slope of phase III meaningful.
Closing Volume and Closing Capacity
• Restrictive disease patterns in which the FRC becomes less than the CV
• Smokers and other patients with early obstructive disease of small airways
• Congestive heart failure when the caliber of the small airways is compromised by edema
 %N2 750–1250 and slope of phase III.
In some patients with no pulmonary disease, the onset of phase IV cannot be accurately determined. Because of the variability in both the CV and CC, the mean of three tests is usually reported. Because of its poor reproducibility, the CV test is not widely used. Although it appears to be a sensitive indicator of abnormalities in the small airways, particularly in smokers, an increased CV/VC ratio is not highly predictive of which individuals will have chronic airway obstruction. To calculate normal values for CV/VC and CC/TLC according to age and sex, see Evolve (http://evolve.elsevier.com/Mottram/Ruppel/).
Summary
• To measure TLC, the functional residual capacity (FRC) is measured first. FRC can be measured with N2 washout (FRCn2), He dilution (FRChe), or body plethysmograph (FRCpleth) techniques.
• TLC is calculated by adding the inspiratory capacity (IC, measured from simple spirometry) to the FRC.
• The expiratory reserve volume (ERV, also measured by simple spirometry) may be subtracted from FRC to derive RV.
• The addition of RV and VC (from spirometry) also provides an estimate of TLC.
• The plethysmographic technique is the preferred method because it is largely independent of gas distribution in the lungs.
• The plethysmographic technique also allows the measurement of airway resistance (Raw) and its volume-associated parameters, sGaw and sRaw.
• Gas dilution techniques may underestimate lung volumes in the presence of significant airway obstruction.
• Gas dilution techniques, along with the analysis of N2 after a single breath of oxygen (SBN2), provide a qualitative means of assessing gas distribution in the lungs.
Case Studies
Case 4-1
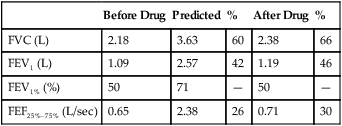
Spirometry and Airway Resistance
| Before Drug | Predicted | % | |
| FVC (L) | 2.9 | 4.7 | 62 |
| FEV1 (L) | 2.47 | 3.86 | 64 |
| FEV1% (%) | 85 | 82 | — |
| FEF25%–75% (L/sec) | 4.62 | 4.35 | 106 |
| FEF50% (L/sec) | 4.94 | 5.82 | 85 |
| MVV (L/min) | 178 | 130 | 137 |
| Raw (cm H2O/L/sec) | 2.33 | 0.6 – 2.4 | — |
| sGaw (L/sec/cm H2O/L) | 0.23 | 0.12 – 0.50 | — |
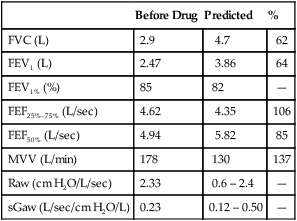
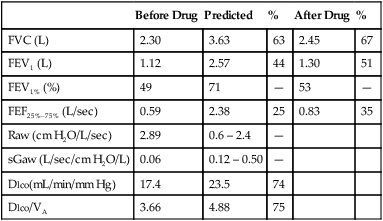
The subject returned for analysis of arterial blood gases, which revealed resting hypoxemia and slightly elevated Paco2. Blood gas measurements confirmed the degree of impairment caused by the moderately severe restrictive pattern. Other tests that might be considered include ventilatory response tests for hypoxemia or hypercapnia (Chapter 5). Studies to diagnose sleep apnea might be indicated if the subject had
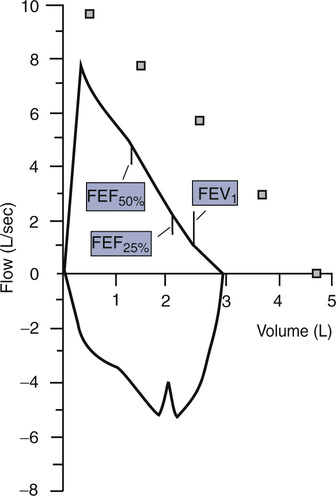
Upward tick mark superimposed on the loop denotes the FEV1, whereas downward tick marks show FEF50% and FEF25%, respectively. Small, shaded boxes represent the student’s reference values.
symptoms of disordered breathing during sleep or excessive daytime sleepiness. This subject’s borderline Raw suggests upper airway involvement, which might predispose him to obstructive sleep apnea.
Case 4-2
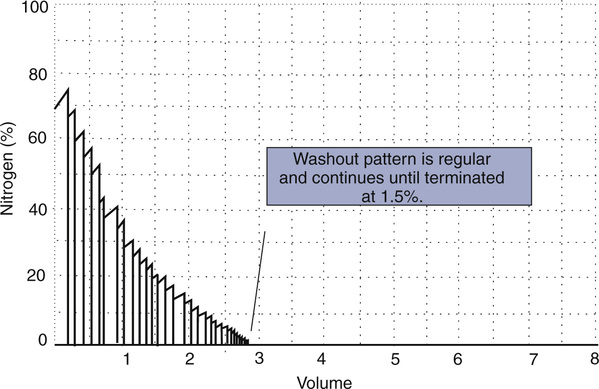
Tracing shows a normal pattern of washout with N2 concentration plotted against lung volume (FRC). The test was terminated when N2 concentration fell to less than 1.5%.
considered. Arterial blood gas testing to evaluate possible hypoxemia is recommended.
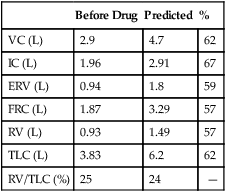
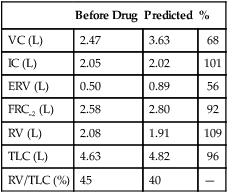
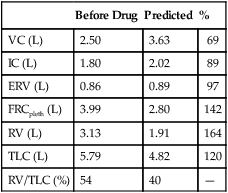
Lung volume measurements (see Figure in p. 128) confirm the presence of a restrictive component (see Figure 4-8). All lung volumes are reduced in similar proportions. The reduction in VC matches decreases in FRC, RV, and TLC. The subject’s history and symptoms suggest the possibility of restrictive or obstructive disease or both. The obstructive component may be related to the student’s smoking history, but the etiology of the restrictive component is less clear. On further inquiry, it was learned that the student’s occupation involved exposure to asbestos, which can cause fibrosis and/or carcinoma. Chest radiographs revealed linear calcifications of the diaphragmatic pleura and pleural thickening, as well as fibrotic changes. These findings are all consistent with asbestos exposure.
Case 4-3
Case 4-4
| Baseline | Post-Albuterol | |||||
| Actual | % Predicted | Predicted | Actual | % Predicted | % Change | |
| FVC (L) | 4.17 | 85 | 4.89 | 4.23 | 86 | 1 |
| FEV1 (L) | 3.46 | 91 | 3.79 | 3.49 | 92 | 1 |
| FEV1/FVC (%) | 83 | 107 | 77 | 83 | 107 | 0 |
| Baseline | Post-Albuterol | |||||
| Actual | % Predicted | Predicted | Actual | % Predicted | % Change | |
| TLC (L) | 6.13 | 91 | 6.76 | 5.55 | 82 | -9 |
| FRC (box) (L) | 2.97 | 80 | 3.70 | 2.28 | 62 | -23 |
| RV (L) | 2.09 | 112 | 1.87 | 1.44 | 77 | -31 |
| Raw (cm H2O/L/sec) | 2.30 | 0.2-2.5 | 1.18 | -48 | ||
| sGaw (L/sec/cm H2O) | 0.14 | 0.11-0.40 | 0.32 | +128 | ||
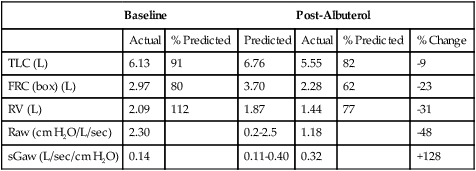
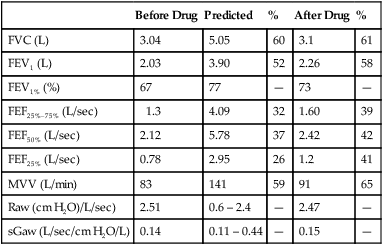
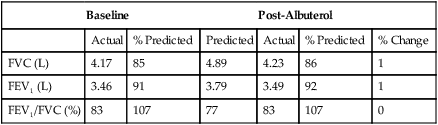
1. The lung function tests show normal spirometry with no bronchodilator response, based on change in FEV1 or FVC. Baseline lung volumes are normal with a slightly elevated RV/TLC, suggesting the possibility of air trapping. Following the bronchodilator, the FRC and RV significantly decrease, suggesting less hyperinflation after the bronchodilator. Baseline airway resistance and conductance are normal, but after the bronchodilator, resistance falls substantially and conductance increases. Because resistance measurements are volume-dependent, and lung volumes changed here, one must use the sGaw to assess any bronchodilator response, which, in this case, increased by more than 100%.
2. The subject’s symptoms can definitely be explained by these findings because dyspnea is strongly associated with hyperinflation and air trapping, which the student has at baseline and is markedly reduced after bronchodilator.
3. Although there was no bronchodilator response on spirometry, the subject had clinical improvement with bronchodilator therapy and clearly has a bronchodilator response in lung volumes and airway resistance. A reasonable, significant response in lung volumes is a decrease of approximately 20% or more, and in sGaw is an increase of approximately 25% or more. The reason spirometry did not change is because of an “isovolume shift” in airflow caused by the bronchodilator, such that under conditions of less hyperinflation, flows are greater at any given absolute lung volume. In fact, approximately 15% of subjects with suspected obstructive airways disease may be missed by spirometry testing alone, but most will be identified by performing additional measurements of volumes or airway resistance. This subject should continue to be treated with the bronchodilator.
1. Which of the following cannot be used to measure FRC?
a. Single-breath nitrogen washout
b. Open-circuit, multiple-breath nitrogen washout
2. In patients with obstructive lung disease, the gas dilution methods for FRC determination:
3. Standardizing the measurement of lung volumes, the N2 washout test is considered complete when the:
a. N2 concentration has decreased to less than 2.5% after 7 minutes
b. N2 concentration has decreased to less than 1.5% for at least three consecutive breaths
c. N2 concentration changes by less than 0.02% in 30 seconds
4. A patient has the following results from a pulmonary function test:
| VC | 4.35 L |
| IC | 3.15 L |
| ERV | 1.20 L |
| FRChe | 3.40 L |
What is the patient’s RV and RV/TLC ratio?
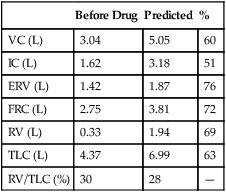
5. A patient has the following lung volumes measured using a body plethysmograph:
| Measured | Predicted | % Predicted | |
| VC (L) | 3.50 | 4.30 | 81 |
| FRCpleth (L) | 3.80 | 3.00 | 127 |
| RV (L) | 3.00 | 2.00 | 150 |
| TLC (L) | 7.20 | 6.30 | 114 |
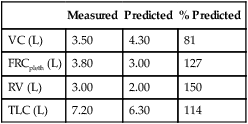
These values are most consistent with:
6. The calculation of FRC with the body plethysmograph is based on:
8. Which of the following are true about the measurement of lung volumes, using the body plethysmograph?
1. The plethysmograph measures all gas in the thorax.
2. Gas in the thorax that does not communicate with the mouth is not measured by the plethysmograph.
3. FRCpleth is often larger than gas dilutional FRC determinations.
4. FRCpleth can overestimate true FRC in severe airway obstruction.
9. A 53-year-old woman has the following measurements obtained during pulmonary function testing:
| FVC | 2.55 L |
| FEV1 | 1.20 L |
| FEV1/FVC | 47% |
| FRChe | 2.32 L |
| FRCpleth | 3.59 L |
Which of the following best explains these findings?
10. In measuring FRC by body plethysmography, which of the following is most correct?
1. Patient should pant at a rate between 0.5 and 1 Hz.
2. Patient should pant at about 90 breaths/min.
3. The largest of three acceptable tests is reported.
4. The average of three acceptable tests that agree within 5% is reported.
11. A 25-year-old patient performs an SBN2 test and records a slope of phase III of 2.9%. This value is:
a. Consistent with increased physiologic dead space
b. Indicative of uneven distribution of gas within the lungs
12. A patient with alpha-1 antitrypsin deficiency and severe airway obstruction has lung volumes measured with the open-circuit N2 washout method and by plethysmography with the following results:
| FRCn2 | 2.99 L |
| FRCpleth | 4.58 L |
| VC | 2.77 L |
| IC | 1.54 L |
| FRC predicted | 3.67 L |
13. A patient with an FEV1 of 1.24 L and an FVC of 3.10 L performs the FRChe test. The He concentration between 6 and 6.5 minutes changed by 0.1%, and between 7 and 7.5 minutes changed by 0.08%. The technician correctly concludes equilibration has not been reached. The most likely explanation is:
a. The patient is malingering.
b. The N2 analyzer has malfunctioned.
14. A 30-year-old man is being tested for asthma but has normal spirometry at baseline and no change after a bronchodilator. Which of the following parameters could be used to assess whether the patient has a bronchodilator response?
[/level-membership-for-pulmolory-and-respiratory-category][not-level-membership-for-pulmolory-and-respiratory-category]Chapter 4
Lung Volumes, Airway Resistance, and Gas Distribution Tests
1. Describe the measurement of lung volumes using gas dilution/washout methods.
2. Explain two advantages of measuring lung volumes using the body plethysmograph.
3. Calculate residual volume and total lung capacity from FRC and the subdivisions of VC.
4. Identify a restricted disease process from measured lung volumes.
5. Describe the measurement of airway resistance using the body plethysmograph.
1. Calculate FRC using helium dilution and nitrogen washout methods.
2. Describe the correct technique for measuring thoracic gas volume using body plethysmography.
3. Identify air trapping and hyperinflation using measured lung volumes.
4. Describe the differences between Raw, sGaw, and sRaw.
5. Identify uneven distribution of gas in the lungs by either single- or multiple-breath techniques.
closed-circuit, multiple-breath helium dilution (FRChe)
FRCpleth (FRC measured with the body plethysmograph)
functional residual capacity (FRC)
lung volume reduction surgery (LVRS)
open-circuit, multiple-breath nitrogen washout technique (FRCn2)
single-breath nitrogen washout test (SBN2)
specific airway conductance (sGaw)
Lung Volumes: Functional Residual Capacity, Residual Volume, Total Lung Capacity, and Residual Volume/Total Lung Capacity Ratio
Description
Functional residual capacity (FRC) is the volume of gas remaining in the lungs at the end of a quiet breath. On a simple spirogram, this point is termed the end-expiratory level (see Figure 2-1). Residual volume (RV) is the volume of gas remaining in the lungs at the end of a maximal expiration regardless of the lung volume at which exhalation was started (see Figure 2-1). Total lung capacity (TLC) is the volume of gas contained in the lungs after maximal inspiration. FRC, TLC, and RV are reported in liters (L) or milliliters (mL), corrected to BTPS. The RV/TLC ratio defines the fraction of TLC that cannot be exhaled (RV), expressed as a percentage.
Technique
There are a variety of methods for measuring absolute lung volumes (Table 4-1). FRC is measured directly with the open-circuit multiple-breath N2 washout, closed-circuit multiple-breath He dilution, and body plethysmographic techniques. Once FRC and VC have been measured, RV and TLC can be calculated. TLC can be estimated directly with the single-breath N2 washout, and single-breath He dilution as part of the diffusing capacity (Dlco) test, and by chest imaging techniques. RV can only be measured indirectly once FRC or TLC has been determined.
Table 4-1
Methods for Measurement of Lung Volumes
| Method | Lung Volume | Advantages/Disadvantages |
| Multiple-breath He dilution | FRC | Simple, relatively inexpensive; affected by distribution of ventilation in moderate or severe obstruction; multiple-breath; requires IC, ERV to calculate other lung volumes |
| Multiple-breath N2 washout | FRC | Simple, relatively inexpensive; affected by distribution of ventilation in moderate or severe obstruction; multiple-breath; requires IC, ERV to calculate other lung volumes |
| Single-breath N2 washout | TLC | Calculated from single-breath N2 distribution test; may underestimate lung volume in the presence of obstruction |
| Single-breath He (or other inert gas; e.g., neon) dilution | TLC | Calculated as part of Dlco (VA); may underestimate lung volume in the presence of obstruction |
| Plethysmography | VTG (FRCpleth) | Plethysmographic method more complex, but very fast; tends to be more accurate in the presence of airway obstruction than gas dilution techniques |
| Chest radiograph | TLC | Requires posterior-anterior and lateral chest x-ray films; must breath-hold at TLC; not accurate in the presence of diffuse, space-occupying diseases |
| Chest computerized tomography (CT) | TLC | Involves radiation exposure and increased cost; must breath-hold at TLC; underestimates lung volumes in the presence of airway obstruction |
| Magnetic resonance imaging (MRI) | TLC | No radiation exposure; very costly; research tool only |
Dlco, Diffusing capacity; IC, inspiratory capacity; N2, nitrogen; VA, alveolar volume.
Open-Circuit, Multiple-Breath Nitrogen Washout
FEN2final = fraction of N2 in volume expired
FAN2alveolar1 = fraction of N2 in alveolar gas initially
FAN2alveolar2 = fraction of N2 in alveolar gas at end (from an alveolar sample)
N2tissue = volume of N2 washed out of blood/tissues
The original N2 washout technique lasted 7 minutes. However, not all of the N2 in the lungs may be washed out, even after 7 minutes of 100% O2 breathing. The FAn2alveolar2 is measured at the end of the test and subtracted from the initial N2 concentration. Correction for the “switch-in” error should also be made (see Correcting for the Switch-in Error). The final FRC is then corrected to BTPS, and volume of the equipment dead space (including filters) must be subtracted (see the Sample Calculations on Evolve at http://evolve.elsevier.com/Mottram/Ruppel/).
Some available commercial systems use a rapid N2 analyzer in combination with a spirometer to provide a “breath-by-breath” analysis of expired N2 (Figure 4-1, A). An alternative approach is to use fast-response O2 and carbon dioxide (CO2) analyzers to calculate the concentration of N2 in expired gas during the washout:
(A) Open-circuit equipment used for N2 washout determination of FRC. The patient inspires O2 from a regulated source and exhales past a rapidly responding N2 analyzer into a pneumotachometer. FRC is calculated from the total volume of N2 exhaled and the change in alveolar N2 from the beginning to the end of the test (Figure 4-2 and open-circuit method); (B) Closed-circuit equipment used for He dilution FRC determination includes a directional breathing circuit with a volume-based spirometer, He analyzer, CO2 absorber, O2 source, and water absorber. A breathing valve near the mouth allows the patient to be “switched in” to the system after He has been added and the system volume determined. Tidal breathing and the He dilution curve are displayed on the computer.
FEo2 = fraction of O2 in expired gas (dry)
FEco2 = fraction of CO2 in expired gas (dry)
In these fast methods, the patient, wearing a noseclip, breathes through a mouthpiece-valve system. Precisely at end-expiration, a valve is opened to allow 100% O2 breathing to begin. Each breath of 100% O2 washes out some of the residual N2 in the lungs. Analog signals proportional to N2 concentration and volume (or flow) are integrated to derive the volume of N2 exhaled for each breath. Values for each breath are summed to provide a total volume of N2 washed out (Figure 4-2). The test is continued until the N2 in alveolar gas has been reduced to approximately 1% (Criteria for Acceptability 4-1). Some older systems terminate the test at 7 minutes. However, the O2 breathing should be continued until alveolar N2 falls to less than 1.5% for at least three consecutive breaths. A change in inspired N2 concentration of greater than 1% or sudden large increases in expiratory N2 concentrations indicate a leak, in which case the test should be stopped and repeated.
The concentration (or log concentration) of N2 is plotted against time or against the volume expired as the patient breathes through a circuit (Figure 4-1, A). The volume of N2 expired with each breath is measured by integrating flow and N2 concentration to determine the area under each curve (see inset). FRC is determined by dividing the volume of N2 expired by the change in alveolar N2 from the beginning to the end of the test, with corrections, as described in the text.
accomplished by software or electronic correction of the analyzer output.
Closed-Circuit, Multiple-Breath Helium Dilution
FRC can also be determined by equilibrating the gas in the lungs with a known volume of gas containing He (closed-circuit, multiple-breath helium dilution [FRChe]). A spirometer is filled with a known volume of air, and then a volume of He is added so that a concentration of approximately 10% is achieved (see Figure 4-1, B). The exact concentration of He and spirometer volume is measured and recorded before the test is begun. The patient breathes through a valve that allows a connection to a rebreathing system. The valve is opened at the end of a quiet breath (i.e., the end-expiratory level). Then the patient rebreathes the gas in the spirometer, with a CO2 absorber in place, until the concentration of He falls to a stable level (Figure 4-3). A fan or blower mixes the gas within the spirometer system. O2 is added to the spirometer system to maintain the Fio2 near or above 0.21 and to keep the system volume relatively constant.
At the beginning of the test, the patient’s lungs contain no He. The spirometer contains a known concentration of He in a known volume (see text). The patient then rebreathes the He mixture from this system (Figure 4-1, B). He is diluted until equilibrium is reached. At the end of the test, the known volume of He has been diluted in the rebreathing system and the lungs. FRC is calculated from the change in He concentration and the known system volume. The patient must be switched from breathing air to the He mixture at the end-expiratory level for accurate measurement of FRC. RV is derived by subtracting the ERV. (Modified from Comroe JH Jr, Forster RE, Dubois AB, et al. The lung: Clinical physiology and pulmonary function tests. 2nd ed. St. Louis: Mosby; 1962.)
Equilibration between normal lungs and the rebreathing system takes place in approximately 3 minutes when a 10% He mixture in a system volume of 6–8 L is used (Figure 4-4). The final concentration of He is then recorded. The system volume is computed first. System volume is the volume of the spirometer, breathing circuitry, and valves before the patient is connected. It can be calculated as follows:
Graph shows He concentration from the beginning of rebreathing until equilibrium is achieved (upper line). System volume of the spirometer and the patient’s tidal breathing is also shown (lower line). A CO2 absorber removes carbon dioxide produced by the patient. A computerized valve system replaces O2 to keep the system volume constant. Measurements of He concentrations and system variables are also displayed.
Headded = volume of He placed in the spirometer in liters (L)
Fhe initial = % He converted to a fraction (%He/100)
When the system volume is known, FRC can be computed as follows:
Some automated systems use a similar method to calculate the system volume; a small amount of He is added to the closed system, followed by a known volume of air. The change in He concentration after the addition of the air is used to determine the system volume. Rebreathing is continued until the He concentration changes by no more than 0.02% in 30 seconds (Criteria for Acceptability 4-2).
Additional Comments on FRC by Gas Dilution Techniques
In either of the gas dilution techniques, a leak will cause erroneous estimates of FRC. Leaks may occur in breathing valves or circuitry, or at the patient connection. Some patients have difficulty maintaining an adequate seal at the mouthpiece throughout the test. Failure to properly apply noseclips can also result in a leak. Leaks usually result in an overestimate of lung volume. A leak in the open-circuit N2 washout system allows room air to enter, increasing the volume of N2 washed out. A leak in the closed-circuit He dilution system allows air to dilute the He concentration or He to escape. Each situation causes the test gas concentration to change more than it should. Leaks during the N2 washout can usually be identified by an inspection of the graphic display or recording (Figure 4-5). Inaccuracy or malfunction of the gas analyzers in either method often causes errors. Leaks or analyzer problems should be considered whenever FRC values are inconsistent with spirometry results (See Interpretive Strategies Box 4-1).
(A) A computer-generated recording of a nitrogen (N2) washout test in a healthy patient. The tracings show a continuous decrease in end-tidal N2 concentration with successive breaths. The test is continued until the N2 concentration falls to less than 1%. (B) A similar plot of N2 washout from a healthy patient, but, in this instance, a leak occurs during the test. Leaks may occur if the patient does not maintain a tight seal at the mouthpiece. Leaks are usually easy to detect because room air enters the system and causes an abrupt increase in N2 concentration.
Body Plethysmography
FRC measured with the body plethysmograph (FRCpleth) (Figure 4-6) refers to the volume of intrathorax gas measured when airflow occlusion occurs at end-expiration (FRC) during shutter closure. The technique is based on Boyle’s law relating pressure to volume. A volume of gas varies in inverse proportion to the pressure to which it is subjected if the temperature remains constant (isothermal). The patient has an unknown volume of gas in the thorax at the end of a normal expiration (i.e., the FRC). The airway is occluded momentarily at or near FRC; the patient is asked to gently pant at a frequency between 0.5 and 1.0 Hz (0.5–1.0 cycles per second), allowing the air in the chest to be compressed and decompressed. This causes a change in volume and pressure. The changes in pressure are easily measured at the mouth (Pmouth) with a pressure transducer. Mouth pressure theoretically equals alveolar pressure when there is no airflow. Changes in pulmonary gas volume are estimated by measuring pressure changes in the plethysmograph. The pressure in the plethysmograph is measured by a sensitive transducer. This transducer is calibrated by introducing a small, known volume of gas into the sealed box and relating the pressure change to the known volume (Pbox). The calibration factor is then applied to measurements made on human patients.
Boyle’s law states that volume varies inversely with pressure if temperature is held constant. A pressure-type (constant volume) plethysmograph, with pressure transducers for measurements of box pressure and mouth (alveolar) pressure, is shown. A pneumotachometer measures flow to track lung volumes. The mouth shutter occludes the airway momentarily so alveolar pressure can be estimated. The patient pants gently against the closed shutter. Gas in the lungs is alternately compressed and decompressed. Changes in lung volume are reflected by changes in box pressure. These changes are displayed as a sloping line on a computer display. When the original pressure (P), the new pressure (P +ΔP), and the new volume (V +ΔV) are known, the original volume (V or VTG) can be computed from Boyle’s law (see the section on the technique of thoracic gas volume and see Evolve at http://evolve.elsevier.com/Mottram/Ruppel/).
The display of the panting maneuver is a graph with Pmouth and Pbox. Pmouth is plotted on the vertical axis, and Pbox is plotted on the horizontal axis (Figure 4-7). The resulting figure appears as a sloping line equal to DP/DV, where DP equals change in alveolar pressure and DV equals change in alveolar volume. Change in alveolar volume is measured indirectly by noting the reciprocal change in plethysmograph volume.
Top left, Normal closed-shutter maneuver in which mouth pressure is plotted against box pressure. The loop should be closed, or nearly so. If thermal equilibrium has not been achieved, the loop (shown on the top right) tends to be open and to drift across the screen. Bottom left, Normal open-shutter measurement in which flow is plotted against box pressure. If the patient pants near FRC, the loop takes on a nearly closed S-shaped appearance. If the patient pants too rapidly or too deeply, the tracing becomes open and flattened (shown on the bottom right). Thermal drift can also cause the open-shutter tracing to resemble excessive patient effort.
The VTG can then be obtained from the slope of the tracing by applying a derivation of Boyle’s law:
PB = barometric pressure minus water vapor pressure
λVTG = slope of the displayed line equal to DP/DV
Pboxcal = box pressure transducer calibration factor
Pmouthcal = mouth pressure transducer calibration factor
K = correction factor for volume displaced by the patient
For the complete derivation of the equation and sample calculations, see Evolve (http://evolve.elsevier.com/Mottram/Ruppel/).
lung volume can be monitored by continuously integrating the flow through the plethysmograph’s pneumotachometer. The end-expiratory level can be determined from tidal breathing. The patient then pants with the mouth shutter open. The computer records the change in lung volume above or below the resting level (FRC). When asked to pant, most patients do so slightly above FRC. The shutter then closes automatically, the patient continues panting, and VTG is measured as described. The computer then adds or subtracts the change in volume from the end-expiratory level (before panting began) to calculate the true FRC. This computerized technique allows the patient to pant at the correct frequency and depth before the shutter is closed. It also eliminates the necessity of closing the shutter precisely at end-expiration. Raw and sGaw can also be measured simultaneously during the open-shutter panting (see following text). It should be noted that the correct panting frequencies for measuring Raw and VTG are slightly different. Raw measurements should be made with the patient panting at about 1.5–2.5 Hz (1.5–2.5 cycles per second, or 90–150 breaths/min), whereas VTG should be measured with the patient panting at a slower rate of 0.5–1 Hz. Many computerized systems display the panting frequency so the technologist can coach the patient to achieve the correct rate.
Depending on the construction of the plethysmograph, venting to the atmosphere is usually required to establish thermal equilibrium. Equilibrium takes about 30-60 sec and can be presumed when the flow-volume recording stabilizes (i.e., does not drift). The patient is then instructed to pant. When the correct panting frequency and depth have been established, the shutter may be closed. Some plethysmograph systems require tidal breathing before shutter closure to establish the patient’s end-expiratory level. In either type of system, the patient should pant against the closed shutter until a stable tracing is produced. Two to four pants are usually sufficient. If the patient pants too hard, the tracing may drift or appear as an “open” loop (see Figure 4-7). The recorded pressure changes should be within the range over which the transducers were calibrated. The entire tracing should be visible on the display. If the tracing goes off-screen, the pressure changes probably exceed the calibration ranges. Three or more technically satisfactory maneuvers should be recorded, each followed by ERV and IVC maneuvers (Criteria for Acceptability 4-3). At least three FRCpleth values that agree within 5% should be obtained and the mean value reported. The technologist’s comments should note the acceptability of the maneuvers. Most computerized plethysmographs automatically measure the slope of the DP/DV tracings. This is done by using the least-squares method to calculate a “best-fit” line through the recorded data points. The technologist may need to correct computer-generated tangents, depending on data quality from the panting maneuvers.
Additional Comments on FRC by Plethysmography
The plethysmographic method is a quick and accurate means of measuring lung volumes. It can be used in combination with simple spirometry to derive all lung volume compartments. The plethysmograph’s primary advantage is that it measures all gas in the thorax, whether in ventilatory communication with the atmosphere or not. The plethysmographic measurement of FRC is often larger than that measured by He dilution or N2 washout. This is the case in emphysema and other diseases characterized by air trapping, as well as in the presence of an uneven distribution of ventilation. When gas dilution tests are continued for more than 7 minutes, the results for FRC determinations approach the VTG value. See Interpretive Strategies 4-2.
