[level-membership-for-neurology-category]
Chapter 20 Lumbar Puncture and Imaging Studies
Lumbar Puncture
Neurologists often obtain cerebrospinal fluid (CSF) by performing a lumbar puncture (LP) – one of the oldest neurologic tests still employed – under a variety of clinical circumstances. When patients have at least two elements of the relatively common triad of headache, fever, and nuchal rigidity, neurologists usually perform an LP to look for meningitis, subarachnoid hemorrhage, or other inflammatory conditions affecting the central nervous system (CNS). They also perform an LP in cases of dementia attributable to infectious illnesses. In Creutzfeldt–Jakob disease (CJD), the CSF almost always contains 14-3-3 protein; in subacute sclerosing panencephalitis, antimeasles antibodies; in acquired immunodeficiency syndrome (AIDS), retrovirus markers; and other infectious illnesses, such as cryptococcal or tuberculous meningitis, herpes simplex encephalitis, and neurosyphilis, specific antigens or DNA detectable by polymerase chain reaction. In another particularly useful test, neurologists send CSF for the JC virus in patients with AIDS who have a cerebral lesion. If present, the JC virus indicates that the diagnosis is progressive multifocal leukoencephalopathy (PML) (see Fig. 15-10). Moreover, a positive test obviates the need for a brain biopsy. Neurologists also test the CSF of patients suspected of having multiple sclerosis (MS) for oligoclonal bands and myelin basic protein (see Chapter 15). In Alzheimer disease, the CSF contains increased levels of tau protein but decreased levels of β-amyloid and Aβ42 peptide.
Diagnosing neurologic illnesses sometimes rests on abnormalities of the CSF profile, which comprises the CSF color, red and white blood cell count, and concentrations of protein and glucose (Table 20-1). For example, most infectious or inflammatory CNS illnesses cause a CSF pleocytosis (increase in the CSF white blood cell count). In these illnesses, a rise in protein concentration parallels CSF pleocytosis, and, in their hallmark, glucose concentration falls to abnormally low levels. Bacterial meningitis accentuates that profile: CSF pleocytosis is markedly elevated, with a predominance of polymorphonuclear instead of lymphocytic cells, and the glucose concentration can fall to undetectable levels. Cultures of virus, fungus, and Mycobacterium may require 1–3 weeks to identify an organism, but sometimes antigen testing can immediately indicate bacterial and nonbacterial organisms. As an exception to the general observation that infectious and inflammatory conditions produce CSF pleocytosis, in Guillain–Barré syndrome, CSF contains a markedly elevated protein concentration but little or no increase in the white cell content (the “albumino-cytologic disassociation,” see Chapter 5).
TABLE 20-1 Cerebrospinal Fluid (CSF) Profiles*

WBC, white blood cells; TB, tuberculosis; VDRL, Venereal Disease Research Laboratory.
*Characteristic abnormalities in italics.
‡Mostly polymorphonuclear cells.
§In encephalitis from herpes simplex virus, the CSF also contains red blood cells.
¶In carcinomatous meningitis, the CSF profile is similar to fungal meningitis but malignant cells may be detected on cytologic examination.
$About 40% of neurosyphilis cases have a false-negative VDRL CSF test (see Chapter 7).
**White and red cells are in same proportion as in blood (1:1000).
An intracranial mass lesion is one of the most common contraindications to an LP. This prohibition is based on the fear that an LP could suddenly reduce pressure in the spinal canal, allowing the unopposed force of a cerebral mass to lead to transtentorial herniation (see Fig. 19-3). Moreover, a CSF examination would not help in diagnosing most mass lesions because their CSF profiles are not distinctive. Although increased intracranial pressure without an associated mass lesion defines idiopathic increased intracranial hypertension (pseudotumor cerebri, see Chapter 9), in this setting neurologists perform LPs with impunity for diagnosis and occasionally for treatment. Overall, unless neurologists suspect acute bacterial meningitis or subarachnoid hemorrhage, in which case rapid diagnosis is crucial, they usually do not perform an LP or they postpone it until after imaging studies have excluded an intracranial lesion.
Computed Tomography
Although lacking fine detail, CT can clearly reveal changes in major structures (Fig. 20-1). It shows generalized cerebral atrophy, such as occurs in advanced age or Alzheimer disease (Figs 20-2 and 20-3), and atrophy of a particular region, such as with porencephaly (Fig. 20-4), Huntington disease (Fig. 20-5), and frontotemporal dementia (Fig. 20-6). Similarly, it shows expansion of the ventricles – hydrocephalus – not only as a consequence of generalized atrophy (hydrocephalus ex vacuo, Fig. 20-3), but also from normal-pressure hydrocephalus (Fig. 20-7) and CSF obstructions (obstructive hydrocephalus) (see later). CT readily detects large lesions, such as primary and metastatic tumors (Fig. 20-8). CT will also reveal subdural hematomas, except perhaps for isodense ones (Fig. 20-9). CT is even superior at finding dense, calcium-laden meningiomas (Fig. 20-10). It can show numerous small lesions, such as in toxoplasmosis (Fig. 20-11) and cysticercosis (Fig. 20-12), with the detail necessary for a firm diagnosis. (Cysticercosis, which is caused by the parasite Taenia solium, is the most common cerebral mass lesion in South and Central America.)
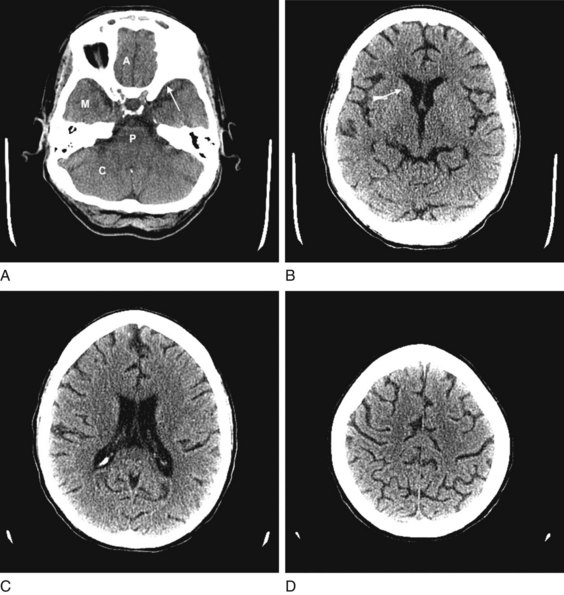
FIGURE 20-1 These computed tomography (CT) scans show progressively higher axial images of a normal brain. A, The anterior cranial fossae (A) contain the anterior frontal lobes and the olfactory nerves. The middle fossae (M) contain the anterior temporal lobes, which are situated behind the sphenoid wing (arrow). The posterior fossa contains the cerebellum (C) and the medulla and pons (P) – main components of the bulb. B, The head of the caudate nucleus (arrow) indents the anterior horn of the lateral ventricle. C, The lateral ventricles spread lengthwise in the hemispheres. D, The cerebral cortex rests against the inner table of the skull. Thin sulci separate the gyri.
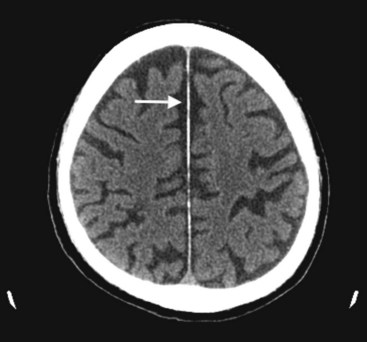
FIGURE 20-2 This computed tomography (CT) scan illustrates generalized cerebral atrophy. (See Fig. 20-18 for magnetic resonance imaging appearance of cerebral atrophy.) Because of atrophy, the gyri shrink, sulci expand, cerebral cortex retracts from the inner table of the skull and from the falx (arrow), and ventricles expand (see later). Cerebral atrophy, as pictured in this case, represents a normal concomitant of old age. Although cerebral atrophy is associated with Alzheimer disease, vascular cognitive impairment, trisomy 21, alcoholism, neurodegenerative illnesses, and treatment-resistant schizophrenia, it is not invariably associated with dementia.
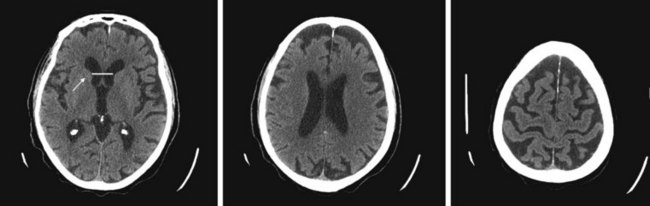
FIGURE 20-3 These three progressively higher computed tomography (CT) images (left to right) show that cerebral atrophy leads to expansion of the lateral ventricles (line in the left-most image) and widening of the third ventricle – hydrocephalus ex vacuo – as well as thinning of cerebral gyri and widening of sulci (right-most image). Nevertheless, as the left-most image shows, the head of the caudate nucleus (arrow) maintains its normal volume and continues to indent the lateral border of the lateral ventricle. In Huntington disease, by way of contrast, the characteristic atrophy of the head of the caudate nuclei allows the ventricles to bow outward (see Fig. 20-5).
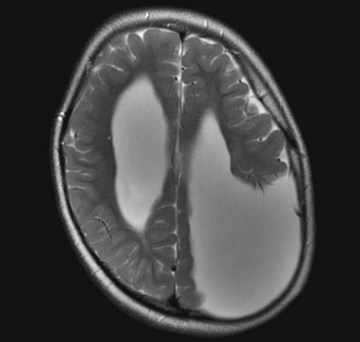
FIGURE 20-4 Computed tomography (CT) and magnetic resonance imaging (MRI), by convention, display the brain with its lateral, but not vertical, sides reversed. For example, the left cerebral hemisphere appears on the right side of the CT image while the frontal lobes still appear on the top on the image. In this MRI, the misshapen region filled with cerebrospinal fluid in the parietal lobe represents a congenital absence of brain tissue, porencephaly, in the patient’s left parietal lobe. The porencephaly displays the opposite effect of a mass lesion. In particular, the absence of mass effect draws the adjacent lateral ventricle and midline structures shift toward it.
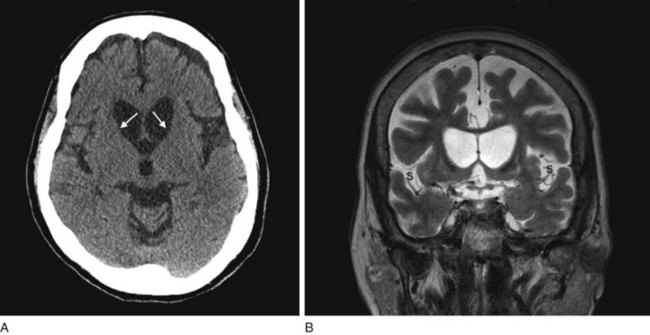
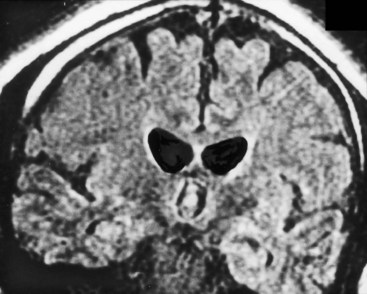
FIGURE 20-5 A, This computed tomography (CT) scan shows the characteristic abnormality of Huntington disease: the anterior horns of the lateral ventricles are convex (bowed outward) because of atrophy of the caudate nuclei (arrows). Contrast that convex shape of the ventricles in Huntington disease to the concave shape seen in normal individuals (see Figs 20-1B and 20-17) and in those with cerebral atrophy and hydrocephalus ex vacuo (see Figs 20-2, 20-3, and 20-18). In addition to the caudate atrophy, Huntington disease, like many other neurodegenerative illnesses, causes cortical atrophy with widened sulci and enlarged ventricles. B, This coronal view of the MRI of the same patient also shows the convex expansion of the lateral ventricles, large sulci, and widened sylvian fissures (S).
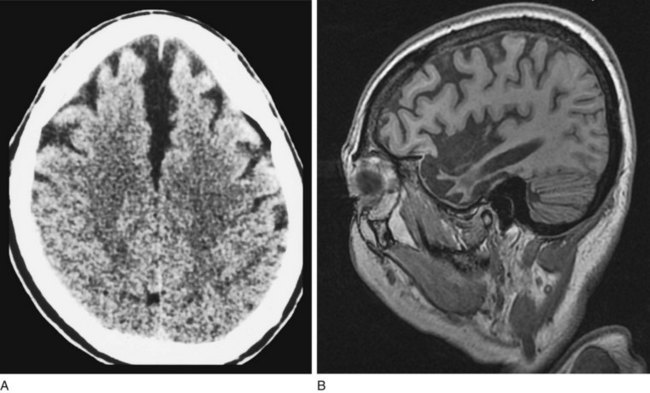
FIGURE 20-6 A, This computed tomography (CT) scan from a patient with frontotemporal dementia shows that the frontal lobes have undergone atrophy and retracted both from each other and from the inner table of the skull. Other views, which are not shown, reveal comparable changes in the temporal lobes; however, characteristically, the parietal and occipital lobes remain unchanged. B, Sagittal magnetic resonance imaging (MRI) scan from another patient with frontotemporal dementia clearly demonstrates the selective frontal and temporal lobe atrophy.
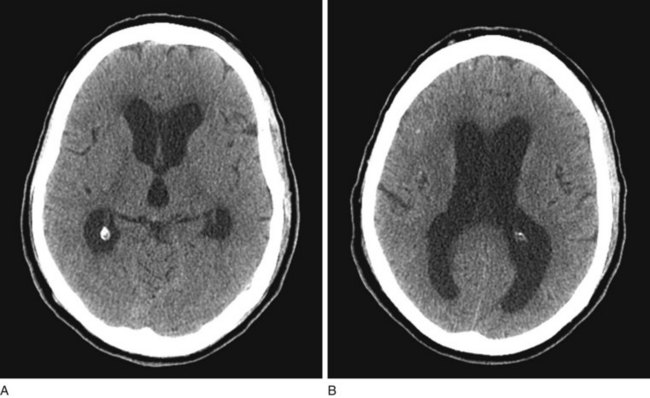
FIGURE 20-7 A, B Computed tomography (CT) scan, from a patient with normal-pressure hydrocephalus (NPH), shows widening of the third and lateral ventricles with little or no cerebral atrophy. (See Fig. 20-19 for magnetic resonance imaging scan of NPH.)
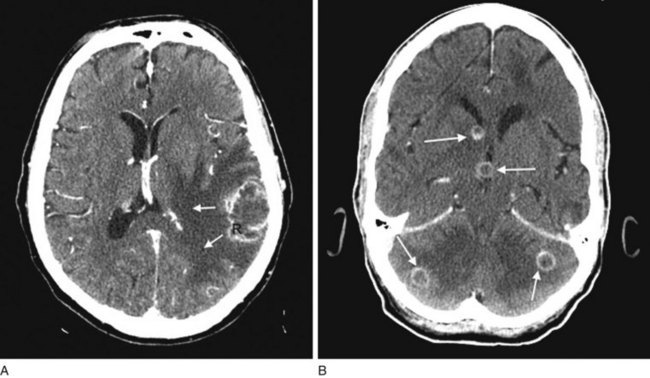
FIGURE 20-8 A, Computed tomography (CT) scan shows a glioblastoma with its characteristic white, contrast-enhanced ring (right) and black border of edema (arrows). (See Fig. 20-20 for magnetic resonance imaging showing a glioblastoma.) B, With contrast enhancement, CT shows several metastatic cerebral tumors (arrows).
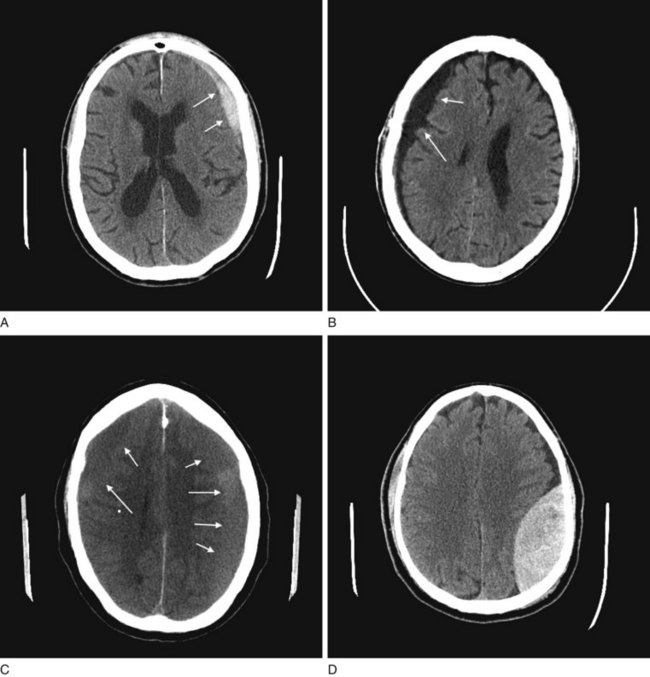
FIGURE 20-9 A, The acute subdural hematoma (arrows), overlying the patient’s left frontal lobe, contains fresh blood, which is radiodense compared to normal brain tissue. B, The chronic subdural hematoma (arrows), overlying this patient’s right cerebral hemisphere, contains aged, liquefied blood that is less radiodense than brain. Chronic subdural hematomas are typically black on a computed tomography (CT) scan and often bordered by a radiodense, contrast-enhancing membrane, not well seen here. C, As acute subdural hematomas evolve into chronic ones, their density decreases to that of the underlying brain’s density. When they become isodense, subdurals are indistinguishable. This CT shows a barely visible isodense subdural overlying both of this patient’s cerebral hemispheres. However, the membrane, compression of the gyri-sulci pattern, and shift of midline structures reveal its presence. D, This CT shows an epidural hematoma, which almost always represents acute intracranial bleed and therefore appears white. In the majority of cases, the CT shows a skull fracture, which is not seen in this view, as well as blood under the scalp. Note the hematoma’s classic elliptical shape and, because of compression, shift of the underlying brain.
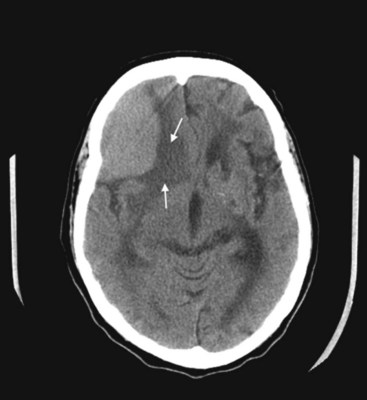
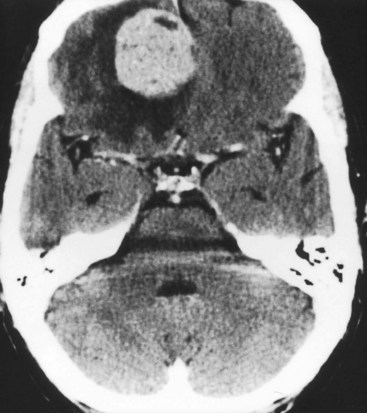
FIGURE 20-10 This coronal computed tomography (CT) scan, of a previous healthy 59-year-old-man, shows a large, rounded radiodense right frontal lesion, with a dural margin, that compresses the adjacent anterior horn of the lateral ventricle and causes some local edema (arrows). The lesion is a typical, chronic, and slowly growing meningioma. As this CT exemplifies, frontal meningiomas often reach a large size before producing seizures, neuropsychologic changes, such as apathy or disinhibition, or other symptoms.
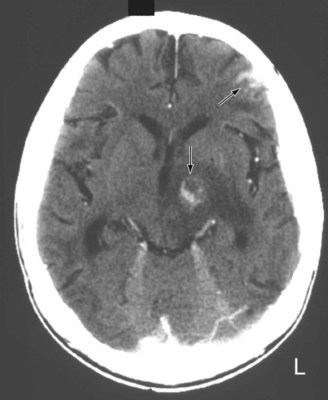
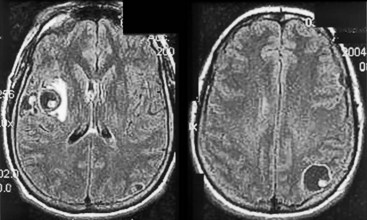
FIGURE 20-11 A computed tomography (CT) scan shows two toxoplasmosis lesions (arrows) enhanced by contrast infusion, in the left cerebrum in a patient with acquired immunodeficiency syndrome (AIDS). As in this study, toxoplasmosis has a predilection for developing in the basal ganglia in AIDS patients with CD4 counts below 200 cells/mL. The infection’s propensity to develop in the basal ganglia explains why AIDS patients who develop involuntary movement disorders, such as hemiballismus or chorea, are likely to be harboring toxoplasmosis.
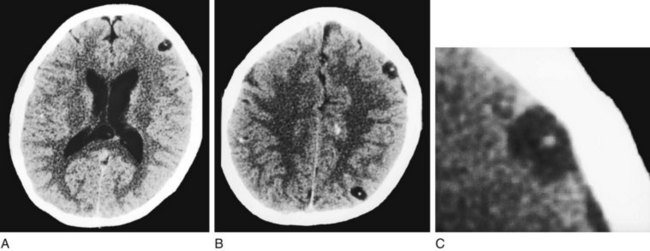
FIGURE 20-12 This computed tomography (CT) scan shows multiple cerebral cysticercosis lesions in views through the cerebrum (A) and cerebral cortex (B) and an enlargement of the frontal cortex lesion (C). These lesions, in contrast to toxoplasmosis (see Fig. 20-11), are usually situated in the cerebral cortex, contain calcification, and lack surrounding edema. Even though each cyst is small, together they exert a substantial cumulative mass effect and irritate the surrounding cerebral cortex. Their tendency to irritate the cerebral cortex explains why patients with cysticercosis often first come to medical attention because of seizures.
CT can also show strokes that are large established infarctions and those that are hemorrhagic (Fig. 20-13); however, MRI can better locate ones that are small or acute. CT is invaluable in the special situation of cerebellar hemorrhage, where rapid diagnosis is essential to prevent brainstem compression and obstructive hydrocephalus (Fig. 20-14).
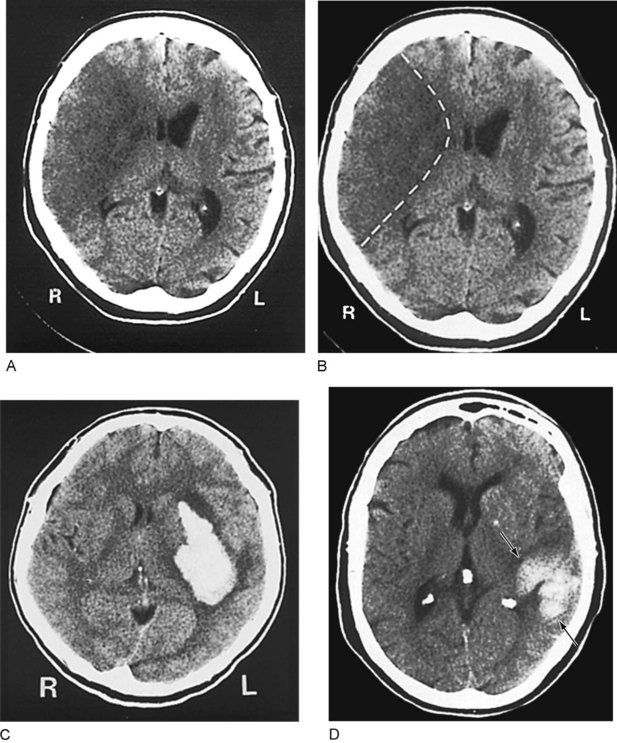
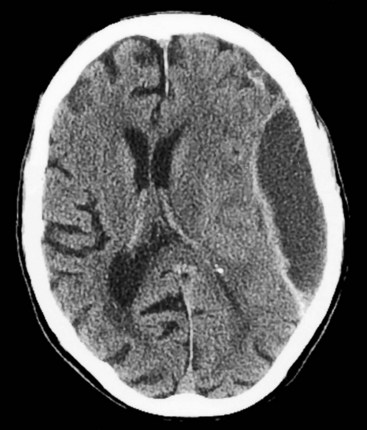
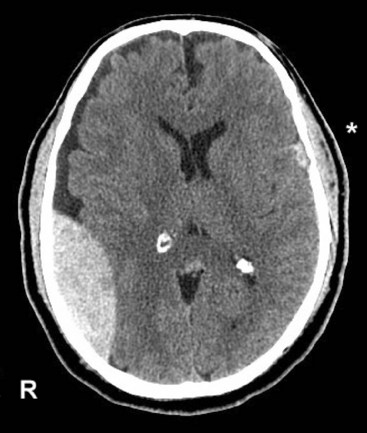
FIGURE 20-13 A, This computed tomography (CT) image shows an acute stroke from occlusion of the right middle cerebral artery. Because the infarcted area of the brain is deprived of blood, which is normally radiodense, it is darker (more hypodense) than the adjacent normal brain. In addition, its mass effect compresses the adjacent lateral ventricle and shifts midline structures. B, An outline of the stroke on the same image shows its pie-shaped area in the lateral portion of the right cerebral hemisphere, containing the origin of the corticospinal tract for the left face and arm. C, This image shows a cerebral hemorrhage that originated in the left basal ganglia. The blood, denser than the brain, forms the white plume. D, In this image, a hemorrhage (arrows) involves the left parietal lobe and compresses the occipital horn of the left lateral ventricle. The three small white objects are, laterally, the normally calcified choroid plexus of the lateral ventricles and, medially, the pineal gland.
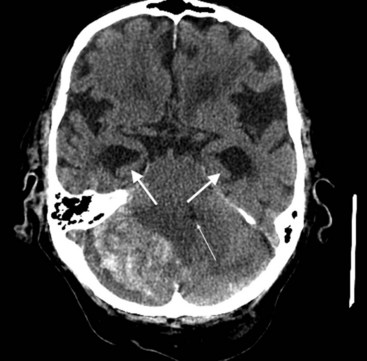
FIGURE 20-14 This computed tomography (CT) scan shows a large white mass lesion in the posterior fossa. The lesion is a cerebellar hemorrhage that has compressed and shifted the fourth ventricle (small arrow), blocking cerebrospinal fluid passage. The resulting obstructive hydrocephalus has caused dilation of the temporal horns of the lateral ventricles (arrows).
The administration of an intravenous contrast solution during CT increases the density of blood-filled structures and whitens their image. This technique, contrast enhancement, highlights vascular structures, such as arteriovenous malformations (AVMs), glioblastomas, and membranes surrounding chronic subdural hematomas and cystic lesions (Fig. 20-15).
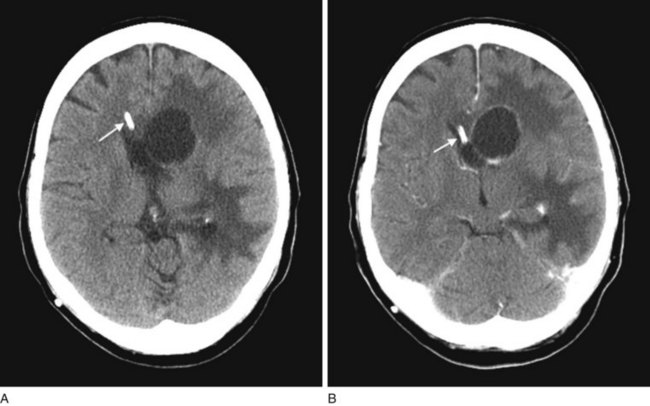
FIGURE 20-15 Computed tomography (CT) scan before (A) and during (B) infusion of contrast material highlights an abscess in a patient’s left frontal region. Disruption of the blood–brain barrier allows the contrast material to concentrate in the lesion’s membranes. In both images, a ventricular catheter can be visualized (arrow), because the catheter is designed to be radio-opaque on CT (with or without contrast).
Magnetic Resonance Imaging
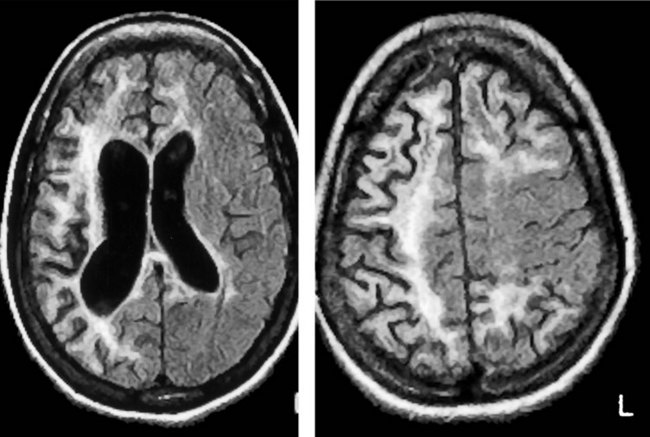
MRI offers several advantages over CT in addition to not exposing the patient to ionizing radiation. Because the resolution of MRI surpasses that of CT, its images provide finer detail (Fig. 20-16), more vivid displays of neuroanatomy (Fig. 20-17), and better illustrations of large common structural changes, such as atrophy (Fig. 20-18) and hydrocephalus (see Figs 20-5, 20-7, and 20-19). It also shows fine detail of mass lesions, such as glioblastomas and strokes (Figs 20-20 through 20-24). With diffusion-weighted images, a standard sequence of a routine study, MRI can show cerebral infarctions not only with fine detail, but, unlike CT, also almost immediately after their onset (see Fig. 20-24). MRI, but not CT, can support the diagnosis of illnesses that alter cerebral or spinal cord white matter, i.e., leukoencephalopathies, such as many congenital storage diseases, MS (Fig. 20-25), PML, and hydrocarbon solvent abuse. In MS, neurologists rely on MRI to confirm the diagnosis, establish the extent, and subsequently detect subclinical as well as clinical progression. It also shows characteristic changes, although not diagnostic ones, in prion illnesses, such as CJD and fatal familial insomnia (see Chapter 17).
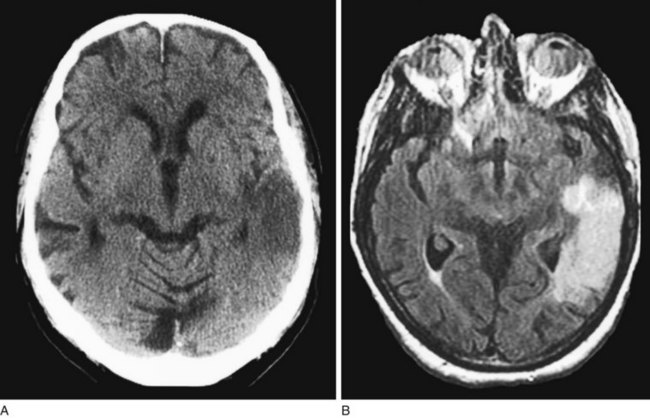
FIGURE 20-16 Computed tomography (CT) scan (A) and magnetic resonance imaging (MRI) (B) showing MRI’s superior resolution and ability to detect acute cerebral infarctions. In this case, a left temporal lobe infarction, barely discernible on CT, is obvious on MRI.
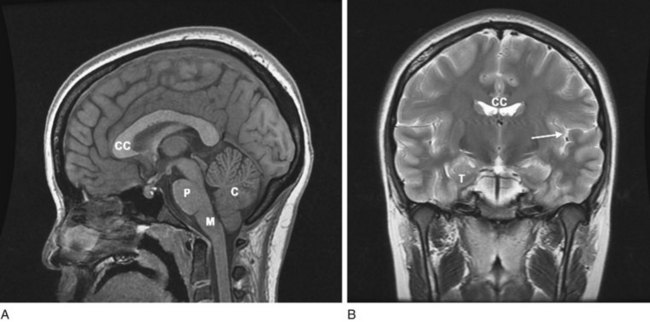
FIGURE 20-17 A, A magnetic resonance imaging (MRI) sagittal view of a normal brain reveals exquisitely detailed cerebral gyri and sulci, the corpus callosum (CC), and three major structures of the posterior fossa, the pons (P), medulla (M), and cerebellum (C). The anterior portion of the corpus callosum is the genu, and its posterior portion, the splenium. In addition, it shows the cervical–medullary junction and various nonneurologic soft-tissue structures. Note that the medulla remains above the foramen magnum. B, The coronal view reveals the corpus callosum, the “great commissure,” which spans and interconnects the cerebral hemispheres. The white matter of the corpus callosum and subcortical cerebral hemispheres is distinct from the ribbon of overlying gray matter. The anterior horns of the lateral ventricles, with their concave lateral borders, are beneath the corpus callosum and medial to the caudate nuclei (see Fig. 18-1, A). The cerebral cortex around the left (dominant) sylvian fissure (arrow), including the planum temporale, is usually more convoluted than that around the right (nondominant). The convolutions confer greater cortical area for language function on the dominant hemisphere. The frontal lobe is above the sylvian fissure, and the temporal lobe is below. The medial inferior surface of the temporal lobe (T), which is the origin of most partial complex seizures, is sequestered by the bulk of the temporal lobe above and below the sphenoid wing anteriorly. It is far from the sites of conventional scalp electroencephalogram (EEG) electrodes.
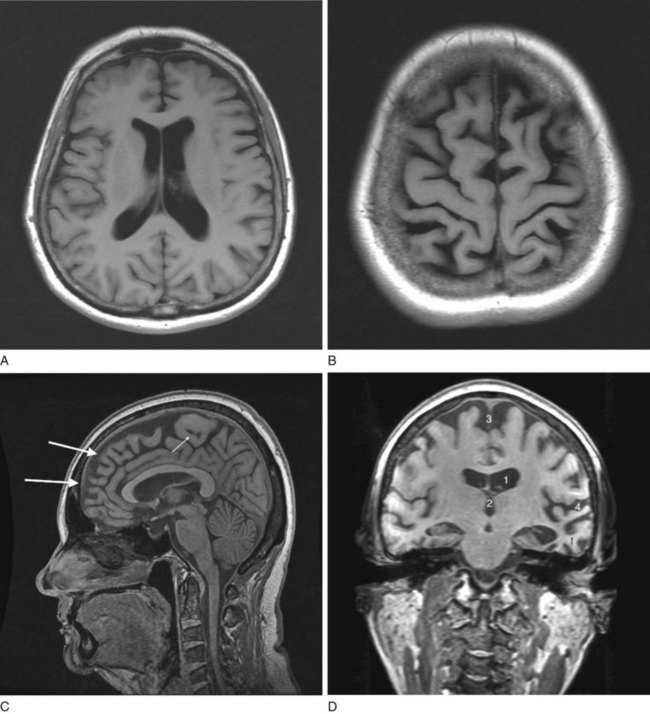
FIGURE 20-18 Four magnetic resonance imaging (MRI) images of cerebral atrophy can be contrasted to the normal brain (see Fig. 20-17). MRI emphasizes cerebral atrophy because it does not detect the cortical bone of the skull, which emits almost no signal because it contains virtually no water. However, the scalp emits a signal because it contains blood, fat, and other water-containing soft tissues. A, In this axial view through the cerebral hemispheres, the cerebrospinal fluid (CSF), which is dark, fills the dilated lateral ventricles and sulci. B, In a view that shows the surface of the brain, computed tomography demonstrates the thin gyri. To fill the void left by the atrophied gyri, copious amounts of CSF fill the sulci and cover the cortex. C, In a sagittal view, the MRI shows thin, ribbon-like frontal lobe gyri (large arrows) and the less atrophied parietal lobe gyri (small arrow). The corpus callosum, pons, and cerebellum stand out. The tentorium, appearing as a straight line, is situated above the cerebellum. D, This coronal view through the frontal lobes shows typical manifestations of cerebral atrophy: (1) dilated lateral ventricles; (2) an enlarged third ventricle; (3) enlargement of the anterior interhemispheric fissure because of separation of the medial surfaces of the frontal lobes; and (4) dilated sylvian fissures with the atrophic temporal lobe (t) below and the atrophic frontal lobe above.
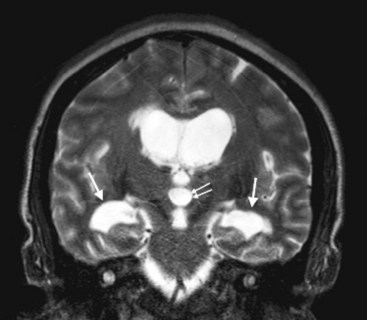
FIGURE 20-19 This magnetic resonance imaging study shows a coronal view of the brain of a patient with normal-pressure hydrocephalus. (See Fig. 20-7 for a comparable computed tomography scan.) It demonstrates the classic findings: dilation of the lateral ventricles, their temporal horns (white arrows), and the third ventricle (double arrows), and absence of cerebral atrophy.
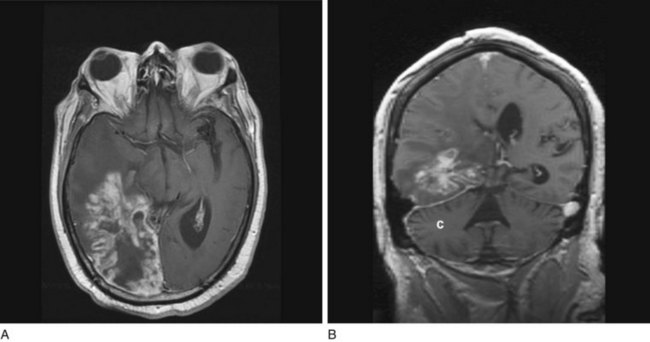
FIGURE 20-20 Transaxial (axial) (A) and coronal (B) projections of a magnetic resonance imaging scan show a large lobulated hyperintense, right temporo-occipital glioblastoma. Its mass effect obliterates the occipital horn of the lateral ventricle and shifts midline structures to the patient’s left side. The coronal view shows the cerebellum (C) as well as the posterior cerebrum.
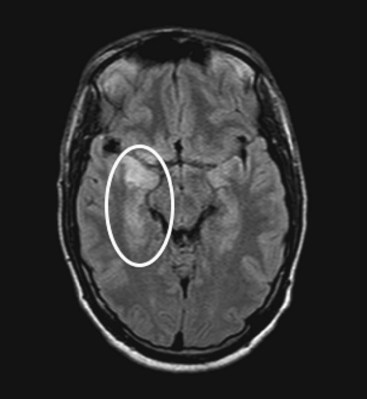
FIGURE 20-21 An axial projection of a magnetic resonance imaging scan of a young man with acute herpes simplex encephalitis shows hyperintensity in inferior gyri of the right temporal lobe (circled). As in this case, herpes simplex infection typically causes hemorrhagic inflammation in the inferior surface of the temporal and frontal lobes. Permanent temporal lobe damage, which is often bilateral, subjects survivors to memory impairment (amnesia), partial complex seizures, and the Klüver–Bucy syndrome.
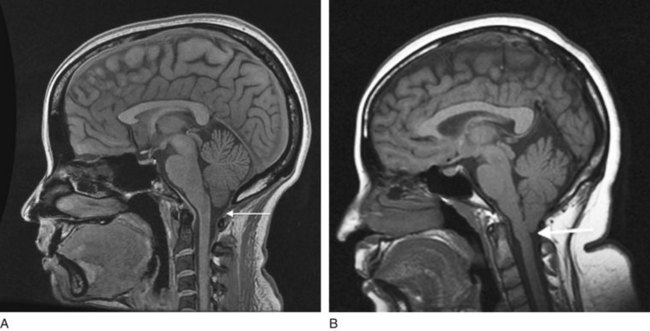
FIGURE 20-22 A, In this sagittal view of the normal neuroanatomy, the cerebellum and medulla sit above the foramen magnum (arrow). B, In the Arnold–Chiari malformation, the cerebellar tonsils and the medulla are situated below the foramen magnum (arrow), as though they were pulled downward. The malformation has also caused aqueductal stenosis that will lead to hydrocephalus (not seen).
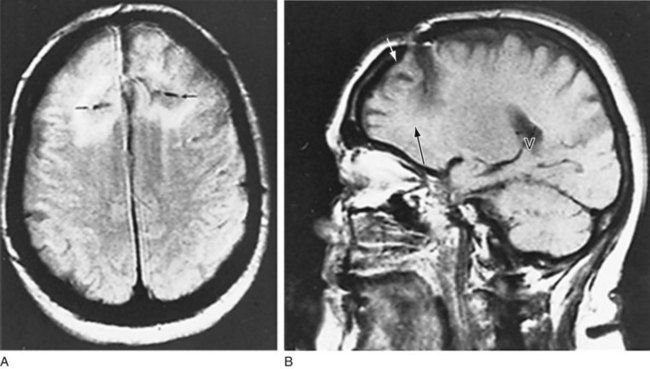
FIGURE 20-23 This magnetic resonance imaging scan, from a patient who had undergone a frontal lobotomy, shows the results of drilling a hole through the skull above each frontal lobe and severing their white-matter tracts. A, The axial view shows black horizontal slits, which represent the incisions and their surrounding scar tissue. B, The sagittal view, through the right cerebral hemisphere, shows the skull defect (white arrow) and lowermost extent of the incision (black arrow). The frontal lobe anterior to the incision has undergone atrophy. The radiolucent area in the posterior cerebrum (V) is the right posterior lateral ventricle.
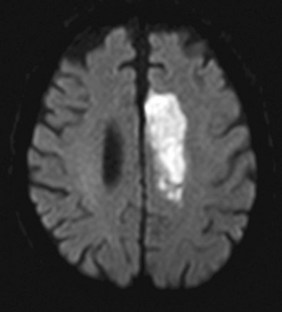
FIGURE 20-24 This diffusion-weighted image sequence on magnetic resonance imaging shows an acute stroke in the left anterior cerebral artery territory. This finding was not apparent on computed tomography done soon after onset of symptoms.
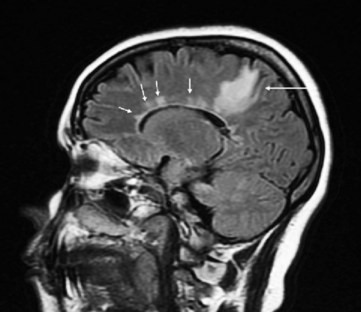
FIGURE 20-25 This magnetic resonance imaging scan, from a patient with multiple sclerosis (MS), shows multiple areas of demyelination. MS lesions, often called plaques, are typically high-signal (white) and clustered in the deep white matter of the cerebral hemispheres, and tend to spread outward from the ventricles (“Dawson’s fingers”). In this sagittal-view image, a large lesion is situated in the patient’s right parietal lobe, posterior to the lateral ventricle (arrow). Multiple lesions arise periventricularly (small arrows) and may also involve the corpus callosum. Because MS plaques generally first develop in the periventricular white matter and spare the cerebral cortex, cognitive impairments are not an early manifestation of MS.
MRI holds another advantage because most of the skull is composed of cortical bone, which contains no water: the skull does not produce linear streak artifacts that obscure images – a common problem in CT. The lack of artifact allows MRI to generate detailed images of structures in bony casings, such as the acoustic nerves, cerebellum and other posterior fossa contents, the pituitary gland, and the spinal cord. Neurologists require MRI in diagnosing mesial temporal sclerosis (Fig. 20-26) and planning epilepsy surgery. It is also indispensable in identifying acoustic neuromas (Fig. 20-27). However, because it does not detect lesions with little or no water content, MRI may fail to display skull fractures.
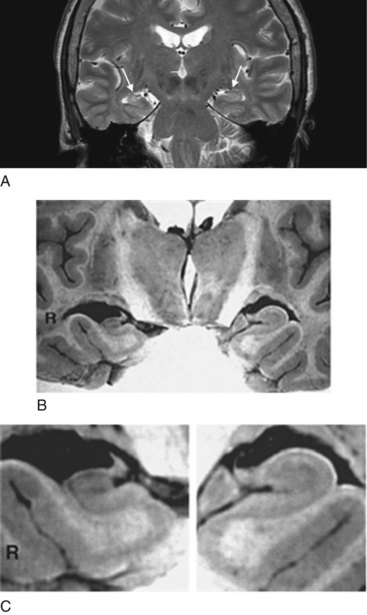
FIGURE 20-26 A, This coronal view of a magnetic resonance imaging (MRI) scan shows right-sided mesial temporal sclerosis, which consists of shrinkage and scarring of the hippocampus and underlying amygdala. Comparing the medial temporal lobes (arrows), the patient’s left-sided medial temporal lobe is round and broad, but the right-sided one, beset by sclerosis, is contracted and poorly demarcated. Moreover, because of the sclerosis, it emits a slightly brighter (white) signal.
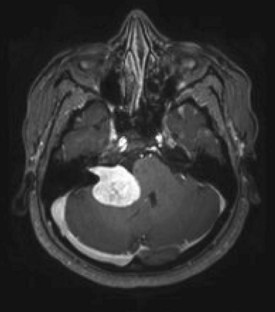
FIGURE 20-27 A large acoustic neuroma, originating from the patient’s right cerebellopontine angle, compresses the pons and shifts the fourth ventricle. In contrast to being obvious on this magnetic resonance imaging (MRI), cerebellopontine angle lesions may escape detection on computed tomography because they are usually small and sequestered in a corner of the skull base where artifacts obscure them. Neurofibromatosis type 2 patients, who tend to develop bilateral acoustic neuromas, routinely undergo MRI with views of the internal auditory canals.
Other Applications of Magnetic Resonance
With the appropriate software, magnetic resonance can generate images of intracranial and extracranial cerebral vessels. This technique, magnetic resonance angiography (MRA), can display highly accurate images of the carotid and vertebral arteries (see Figs 11-2 and 20-28). It can detect aneurysms, AVMs, and other vascular malformations. Because it can outline internal carotid artery stenosis, plaques, and dissections, MRA eliminates the need for conventional carotid angiography, which can be hazardous and painful.
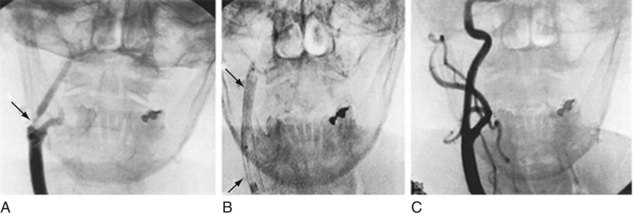
FIGURE 20-28 This angiogram shows how insertion and expansion of a carotid stent form a tubular scaffold that reduces stenosis. A, The angiogram demonstrates the right common carotid artery ascending and dividing into the external and internal carotid artery, which has a severe stenosis (arrow). B, The stent (arrows) has been inserted and expanded. C, A follow-up angiogram shows a patent and smooth internal carotid artery.
The remarkable sensitivity of MRI has led to functional MRI (fMRI), a technique that displays gross metabolic activity. Based on different properties of blood in its oxygenated and deoxygenated states, fMRI exploits small increases in blood flow and oxygen metabolism during cerebral activity. It highlights regions of the brain receiving sensory stimuli, initiating physical activity, imagining sensory or physical experiences, and performing cognitive processes – activities that increase metabolic demands. For example, it can detect language circuits. Thus, fMRI may eventually replace the Wada test in epilepsy surgery candidates (see Chapter 8).
Positron Emission Tomography
Neuroscientists use PET to analyze cerebral metabolism during normal activities, administration of medications, and several illnesses. It offers valuable imaging in some varieties of epilepsy, neurodegenerative illnesses, and structural lesions. In epilepsy, PET images show that, in complex partial epilepsy, the affected temporal lobe is generally hypoactive during the interictal period but hyperactive during seizures. Determining whether the temporal lobe is epileptogenic by this method, which is complementary to electroencephalography and fMRI, helps decide if a temporal lobectomy would benefit a patient with intractable epilepsy (see Chapter 10).
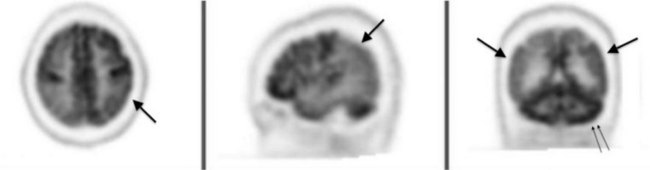
PET is also helpful in studying several neurodegenerative illnesses. In Alzheimer disease, PET shows decreased cerebral metabolism, especially in the parietal and frontal lobes’ association areas (Fig. 20-29). It can also help distinguish vascular neurocognitive disorder and frontotemporal dementia from Alzheimer disease. More importantly, using a special amyloid-binding ligand Pittsburgh Compound B, PET can localize and quantitate amyloid deposition, which allows for a diagnosis of Alzheimer disease in its presymptomatic as well as symptomatic stages (see Chapter 7). Similarly, PET abnormalities may appear before either clinical signs or MRI abnormalities in Parkinson and Huntington diseases. It can monitor the progression of these illnesses.
Interventional Radiology
In the past decade, neuroradiologists have introduced dramatic therapies for several neurologic diseases. They offer MRI-guided needle biopsies of cerebral and spinal lesions, which are often deep-seated or otherwise unapproachable, that spare patients grossly invasive and painful surgery. Neuroradiologists have been able to dilate stenoses of external carotid arteries and insert stents to maintain their patency (see Chapter 11), but treating stenoses in small intracerebral vessels remains unsafe. They can float epoxy resins or particles into inoperable AVMs or aneurysms. Similarly, they can direct catheters to deliver chemotherapy to brain tumors.
Allison K, Miller T, Bello J. Neuroradiological imaging in children. In: Walker AM, Kaufman DM, Pfeffer C, et al, eds. Child and Adolescent Neurology for Psychiatrists. Philadelphia: Lippincott Williams & Wilkins, 2008.
Brenner DJ, Hall EJ. Computed tomography – An increasing source of radiation exposure. N Engl J Med. 2007;357:2277–2284.
Chugani HT, Juhasz C. Functional imaging of the developing brain. In: Coffey CE, Brumback RA, eds. Pediatric Neuropsychiatry. Philadelphia: Lippincott Williams & Wilkins, 2006.
Fazel R, Krumholz H, Wang SMY, et al. Exposure to low-dose ionizing radiation from medical imaging procedures. N Engl J Med. 2009;361:849–857.
Giedd JN. Anatomic imaging of the developing brain. In: Coffey CE, Brumback RA, eds. Pediatric Neuropsychiatry. Philadelphia: Lippincott Williams & Wilkins, 2006.
Johnson KA, Becker JA. The Whole Brain Atlas. http://www.med.harvard.edu/AANLIB/home.html.
Vernooij M, Ikram MA, Tanghe HL, et al. Incidental findings on brain MRI in the general population. N Engl J Med. 2007;357:1821–1828.
8. A 30-year-old woman with a history of depression develops increasingly severe generalized headaches. Neurologic examination shows florid papilledema and bilateral sixth cranial nerve palsies, but she remains fully alert and without cognitive impairment, paresis, or ataxia. An MRI shows small ventricles and no mass lesions. Which profile is her CSF apt to show?
18. A 75-year-old man came to his physician because, for 6 weeks, he had had an increasingly severe left-sided headache. A neurologic examination showed inattention, apathy, word-finding difficulties, and a mild right-sided hemiparesis. Before the onset of these symptoms, he had been in good health and a general medical examination disclosed no significant abnormalities. Which condition does the CT indicate?
b. The corpus callosum is the roof; the hypothalamus, the floor; and the caudate, the lateral borders of the lateral ventricles (see Figs 18-1 and 20-17). Atrophy of the caudate, which is characteristic of Huntington disease, allows the lateral ventricles to expand and assume a convex “bat-wing” appearance (see Fig. 20-5 and Questions 11 and 12).
20. A psychiatrist was watching her father and his friends play baseball in a senior citizen’s league. A foul tip struck one of her father’s teammates in his left frontal head and knocked him unconscious. He recovered after a minute and waved off suggestions for medical evaluation. The psychiatrist felt reassured when she found that he was alert, oriented, had equal and reactive pupils, and was able to ambulate. However, 20 minutes later, he suddenly lapsed into coma. In the emergency room, the staff obtained his CT. What is the abnormality?
28. A 58-year-old man with uncontrolled hypertension presents to the emergency room with a blood pressure of 240/110 mmHg and new-onset left hemiparesis and dysarthria. The neurologist wants to obtain an MRI, but the patient’s severe claustrophobia prevents him from being in the machine for more than 2–3 minutes. The radiologists report that this is enough time to obtain only one sequence. Which one should his physicians select?
[/level-membership-for-neurology-category][not-level-membership-for-neurology-category]
Chapter 20 Lumbar Puncture and Imaging Studies
Lumbar Puncture
Neurologists often obtain cerebrospinal fluid (CSF) by performing a lumbar puncture (LP) – one of the oldest neurologic tests still employed – under a variety of clinical circumstances. When patients have at least two elements of the relatively common triad of headache, fever, and nuchal rigidity, neurologists usually perform an LP to look for meningitis, subarachnoid hemorrhage, or other inflammatory conditions affecting the central nervous system (CNS). They also perform an LP in cases of dementia attributable to infectious illnesses. In Creutzfeldt–Jakob disease (CJD), the CSF almost always contains 14-3-3 protein; in subacute sclerosing panencephalitis, antimeasles antibodies; in acquired immunodeficiency syndrome (AIDS), retrovirus markers; and other infectious illnesses, such as cryptococcal or tuberculous meningitis, herpes simplex encephalitis, and neurosyphilis, specific antigens or DNA detectable by polymerase chain reaction. In another particularly useful test, neurologists send CSF for the JC virus in patients with AIDS who have a cerebral lesion. If present, the JC virus indicates that the diagnosis is progressive multifocal leukoencephalopathy (PML) (see Fig. 15-10). Moreover, a positive test obviates the need for a brain biopsy. Neurologists also test the CSF of patients suspected of having multiple sclerosis (MS) for oligoclonal bands and myelin basic protein (see Chapter 15). In Alzheimer disease, the CSF contains increased levels of tau protein but decreased levels of β-amyloid and Aβ42 peptide.
Diagnosing neurologic illnesses sometimes rests on abnormalities of the CSF profile, which comprises the CSF color, red and white blood cell count, and concentrations of protein and glucose (Table 20-1). For example, most infectious or inflammatory CNS illnesses cause a CSF pleocytosis (increase in the CSF white blood cell count). In these illnesses, a rise in protein concentration parallels CSF pleocytosis, and, in their hallmark, glucose concentration falls to abnormally low levels. Bacterial meningitis accentuates that profile: CSF pleocytosis is markedly elevated, with a predominance of polymorphonuclear instead of lymphocytic cells, and the glucose concentration can fall to undetectable levels. Cultures of virus, fungus, and Mycobacterium may require 1–3 weeks to identify an organism, but sometimes antigen testing can immediately indicate bacterial and nonbacterial organisms. As an exception to the general observation that infectious and inflammatory conditions produce CSF pleocytosis, in Guillain–Barré syndrome, CSF contains a markedly elevated protein concentration but little or no increase in the white cell content (the “albumino-cytologic disassociation,” see Chapter 5).
TABLE 20-1 Cerebrospinal Fluid (CSF) Profiles*
WBC, white blood cells; TB, tuberculosis; VDRL, Venereal Disease Research Laboratory.
*Characteristic abnormalities in italics.
‡Mostly polymorphonuclear cells.
§In encephalitis from herpes simplex virus, the CSF also contains red blood cells.
¶In carcinomatous meningitis, the CSF profile is similar to fungal meningitis but malignant cells may be detected on cytologic examination.
$About 40% of neurosyphilis cases have a false-negative VDRL CSF test (see Chapter 7).
**White and red cells are in same proportion as in blood (1:1000).
An intracranial mass lesion is one of the most common contraindications to an LP. This prohibition is based on the fear that an LP could suddenly reduce pressure in the spinal canal, allowing the unopposed force of a cerebral mass to lead to transtentorial herniation (see Fig. 19-3). Moreover, a CSF examination would not help in diagnosing most mass lesions because their CSF profiles are not distinctive. Although increased intracranial pressure without an associated mass lesion defines idiopathic increased intracranial hypertension (pseudotumor cerebri, see Chapter 9), in this setting neurologists perform LPs with impunity for diagnosis and occasionally for treatment. Overall, unless neurologists suspect acute bacterial meningitis or subarachnoid hemorrhage, in which case rapid diagnosis is crucial, they usually do not perform an LP or they postpone it until after imaging studies have excluded an intracranial lesion.
Computed Tomography
Although lacking fine detail, CT can clearly reveal changes in major structures (Fig. 20-1). It shows generalized cerebral atrophy, such as occurs in advanced age or Alzheimer disease (Figs 20-2 and 20-3), and atrophy of a particular region, such as with porencephaly (Fig. 20-4), Huntington disease (Fig. 20-5), and frontotemporal dementia (Fig. 20-6). Similarly, it shows expansion of the ventricles – hydrocephalus – not only as a consequence of generalized atrophy (hydrocephalus ex vacuo, Fig. 20-3), but also from normal-pressure hydrocephalus (Fig. 20-7) and CSF obstructions (obstructive hydrocephalus) (see later). CT readily detects large lesions, such as primary and metastatic tumors (Fig. 20-8). CT will also reveal subdural hematomas, except perhaps for isodense ones (Fig. 20-9). CT is even superior at finding dense, calcium-laden meningiomas (Fig. 20-10). It can show numerous small lesions, such as in toxoplasmosis (Fig. 20-11) and cysticercosis (Fig. 20-12), with the detail necessary for a firm diagnosis. (Cysticercosis, which is caused by the parasite Taenia solium, is the most common cerebral mass lesion in South and Central America.)
FIGURE 20-1 These computed tomography (CT) scans show progressively higher axial images of a normal brain. A, The anterior cranial fossae (A) contain the anterior frontal lobes and the olfactory nerves. The middle fossae (M) contain the anterior temporal lobes, which are situated behind the sphenoid wing (arrow). The posterior fossa contains the cerebellum (C) and the medulla and pons (P) – main components of the bulb. B, The head of the caudate nucleus (arrow) indents the anterior horn of the lateral ventricle. C, The lateral ventricles spread lengthwise in the hemispheres. D, The cerebral cortex rests against the inner table of the skull. Thin sulci separate the gyri.
FIGURE 20-2 This computed tomography (CT) scan illustrates generalized cerebral atrophy. (See Fig. 20-18 for magnetic resonance imaging appearance of cerebral atrophy.) Because of atrophy, the gyri shrink, sulci expand, cerebral cortex retracts from the inner table of the skull and from the falx (arrow), and ventricles expand (see later). Cerebral atrophy, as pictured in this case, represents a normal concomitant of old age. Although cerebral atrophy is associated with Alzheimer disease, vascular cognitive impairment, trisomy 21, alcoholism, neurodegenerative illnesses, and treatment-resistant schizophrenia, it is not invariably associated with dementia.
FIGURE 20-3 These three progressively higher computed tomography (CT) images (left to right) show that cerebral atrophy leads to expansion of the lateral ventricles (line in the left-most image) and widening of the third ventricle – hydrocephalus ex vacuo – as well as thinning of cerebral gyri and widening of sulci (right-most image). Nevertheless, as the left-most image shows, the head of the caudate nucleus (arrow) maintains its normal volume and continues to indent the lateral border of the lateral ventricle. In Huntington disease, by way of contrast, the characteristic atrophy of the head of the caudate nuclei allows the ventricles to bow outward (see Fig. 20-5).
FIGURE 20-4 Computed tomography (CT) and magnetic resonance imaging (MRI), by convention, display the brain with its lateral, but not vertical, sides reversed. For example, the left cerebral hemisphere appears on the right side of the CT image while the frontal lobes still appear on the top on the image. In this MRI, the misshapen region filled with cerebrospinal fluid in the parietal lobe represents a congenital absence of brain tissue, porencephaly, in the patient’s left parietal lobe. The porencephaly displays the opposite effect of a mass lesion. In particular, the absence of mass effect draws the adjacent lateral ventricle and midline structures shift toward it.
FIGURE 20-5 A, This computed tomography (CT) scan shows the characteristic abnormality of Huntington disease: the anterior horns of the lateral ventricles are convex (bowed outward) because of atrophy of the caudate nuclei (arrows). Contrast that convex shape of the ventricles in Huntington disease to the concave shape seen in normal individuals (see Figs 20-1B and 20-17) and in those with cerebral atrophy and hydrocephalus ex vacuo (see Figs 20-2, 20-3, and 20-18). In addition to the caudate atrophy, Huntington disease, like many other neurodegenerative illnesses, causes cortical atrophy with widened sulci and enlarged ventricles. B, This coronal view of the MRI of the same patient also shows the convex expansion of the lateral ventricles, large sulci, and widened sylvian fissures (S).
FIGURE 20-6 A, This computed tomography (CT) scan from a patient with frontotemporal dementia shows that the frontal lobes have undergone atrophy and retracted both from each other and from the inner table of the skull. Other views, which are not shown, reveal comparable changes in the temporal lobes; however, characteristically, the parietal and occipital lobes remain unchanged. B, Sagittal magnetic resonance imaging (MRI) scan from another patient with frontotemporal dementia clearly demonstrates the selective frontal and temporal lobe atrophy.
FIGURE 20-7 A, B Computed tomography (CT) scan, from a patient with normal-pressure hydrocephalus (NPH), shows widening of the third and lateral ventricles with little or no cerebral atrophy. (See Fig. 20-19 for magnetic resonance imaging scan of NPH.)
FIGURE 20-8 A, Computed tomography (CT) scan shows a glioblastoma with its characteristic white, contrast-enhanced ring (right) and black border of edema (arrows). (See Fig. 20-20 for magnetic resonance imaging showing a glioblastoma.) B, With contrast enhancement, CT shows several metastatic cerebral tumors (arrows).
FIGURE 20-9 A, The acute subdural hematoma (arrows), overlying the patient’s left frontal lobe, contains fresh blood, which is radiodense compared to normal brain tissue. B, The chronic subdural hematoma (arrows), overlying this patient’s right cerebral hemisphere, contains aged, liquefied blood that is less radiodense than brain. Chronic subdural hematomas are typically black on a computed tomography (CT) scan and often bordered by a radiodense, contrast-enhancing membrane, not well seen here. C, As acute subdural hematomas evolve into chronic ones, their density decreases to that of the underlying brain’s density. When they become isodense, subdurals are indistinguishable. This CT shows a barely visible isodense subdural overlying both of this patient’s cerebral hemispheres. However, the membrane, compression of the gyri-sulci pattern, and shift of midline structures reveal its presence. D, This CT shows an epidural hematoma, which almost always represents acute intracranial bleed and therefore appears white. In the majority of cases, the CT shows a skull fracture, which is not seen in this view, as well as blood under the scalp. Note the hematoma’s classic elliptical shape and, because of compression, shift of the underlying brain.
FIGURE 20-10 This coronal computed tomography (CT) scan, of a previous healthy 59-year-old-man, shows a large, rounded radiodense right frontal lesion, with a dural margin, that compresses the adjacent anterior horn of the lateral ventricle and causes some local edema (arrows). The lesion is a typical, chronic, and slowly growing meningioma. As this CT exemplifies, frontal meningiomas often reach a large size before producing seizures, neuropsychologic changes, such as apathy or disinhibition, or other symptoms.
FIGURE 20-11 A computed tomography (CT) scan shows two toxoplasmosis lesions (arrows) enhanced by contrast infusion, in the left cerebrum in a patient with acquired immunodeficiency syndrome (AIDS). As in this study, toxoplasmosis has a predilection for developing in the basal ganglia in AIDS patients with CD4 counts below 200 cells/mL. The infection’s propensity to develop in the basal ganglia explains why AIDS patients who develop involuntary movement disorders, such as hemiballismus or chorea, are likely to be harboring toxoplasmosis.
FIGURE 20-12 This computed tomography (CT) scan shows multiple cerebral cysticercosis lesions in views through the cerebrum (A) and cerebral cortex (B) and an enlargement of the frontal cortex lesion (C). These lesions, in contrast to toxoplasmosis (see Fig. 20-11), are usually situated in the cerebral cortex, contain calcification, and lack surrounding edema. Even though each cyst is small, together they exert a substantial cumulative mass effect and irritate the surrounding cerebral cortex. Their tendency to irritate the cerebral cortex explains why patients with cysticercosis often first come to medical attention because of seizures.
CT can also show strokes that are large established infarctions and those that are hemorrhagic (Fig. 20-13); however, MRI can better locate ones that are small or acute. CT is invaluable in the special situation of cerebellar hemorrhage, where rapid diagnosis is essential to prevent brainstem compression and obstructive hydrocephalus (Fig. 20-14).
FIGURE 20-13 A, This computed tomography (CT) image shows an acute stroke from occlusion of the right middle cerebral artery. Because the infarcted area of the brain is deprived of blood, which is normally radiodense, it is darker (more hypodense) than the adjacent normal brain. In addition, its mass effect compresses the adjacent lateral ventricle and shifts midline structures. B, An outline of the stroke on the same image shows its pie-shaped area in the lateral portion of the right cerebral hemisphere, containing the origin of the corticospinal tract for the left face and arm. C, This image shows a cerebral hemorrhage that originated in the left basal ganglia. The blood, denser than the brain, forms the white plume. D, In this image, a hemorrhage (arrows) involves the left parietal lobe and compresses the occipital horn of the left lateral ventricle. The three small white objects are, laterally, the normally calcified choroid plexus of the lateral ventricles and, medially, the pineal gland.
FIGURE 20-14 This computed tomography (CT) scan shows a large white mass lesion in the posterior fossa. The lesion is a cerebellar hemorrhage that has compressed and shifted the fourth ventricle (small arrow), blocking cerebrospinal fluid passage. The resulting obstructive hydrocephalus has caused dilation of the temporal horns of the lateral ventricles (arrows).
The administration of an intravenous contrast solution during CT increases the density of blood-filled structures and whitens their image. This technique, contrast enhancement, highlights vascular structures, such as arteriovenous malformations (AVMs), glioblastomas, and membranes surrounding chronic subdural hematomas and cystic lesions (Fig. 20-15).
FIGURE 20-15 Computed tomography (CT) scan before (A) and during (B) infusion of contrast material highlights an abscess in a patient’s left frontal region. Disruption of the blood–brain barrier allows the contrast material to concentrate in the lesion’s membranes. In both images, a ventricular catheter can be visualized (arrow), because the catheter is designed to be radio-opaque on CT (with or without contrast).
