CHAPTER 94 Lumbar Provocation Discography: Clinical Relevance, Sensitivity, Specificity, and Controversies
INTRODUCTION
Lumbar provocation discography is a commonly used diagnostic procedure utilized to determine the presence or absence of discogenic pain at a specific spinal segment. Although discography has been proposed as the criterion standard for identifying discogenic pain [NASS statement], the test is controversial. Skeptics argue that newer diagnostic tests such as MRI scans make discography obsolete and the test should be discontinued unless its utility can be validated.1
CORRELATION OF LUMBAR PROVOCATION DISCOGRAPHY WITH HISTORY AND PHYSICAL EXAMINATION FINDINGS
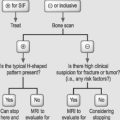
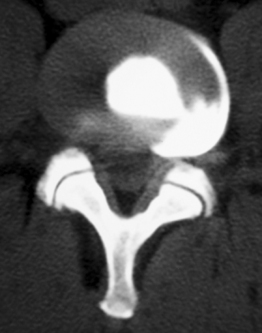
Various studies have attempted to correlate history and physical examination findings with the diagnosis of discogenic pain by discography and to compare these findings with respect to treatment outcome (Fig. 94.1). Simmons and Segil2 reported a diagnostic accuracy of 44% for clinical examination and 82% for discography based on ability to predict symptomatic level as confirmed by successful clinical result after surgery. They did not specify any particular tests used preoperatively, but used the following in follow-up examinations: straight leg raise, neurologic examination including reflexes, sensory or motor, range of motion, and tenderness. Although they correlated discogram results with these physical examination techniques, no other outcome instruments were correlated.
Schwarzer et al.3 found that no historical or clinical examination finding that they studied in 92 patients could accurately identify patients with internal disc disruption as diagnosed by provocation discography. Historical findings sought were pain increased or was relieved by sitting, standing, or walking. Pain referral patterns studied were pain into the buttock, groin, thigh, calf, or foot and whether the pain was unilateral, bilateral, or midline. Physical examination findings performed included provocation of pain with forward flexion, extension, rotation, combined rotation with extension, or straight leg raising making either back or leg pain worse.3 There was a trend (lowest p values obtained) with historical finding of pain increased with sitting (p=0.13), pain increased with standing (p=0.13), but also pain relieved with sitting (p=0.16) and physical examination finding of pain increased with forward flexion (p = 0.16). There was a negative trend (highest p values obtained) with a historical finding of pain increased with walking (p=0.89) or physical examination finding of pain increased with extension.
Young et al.4 prospectively examined 81 patients with clinical examination and various diagnostic injections and found a weak but statistically significant correlation of discogenic pain as diagnosed by discography with centralization of pain with repeated end-range movements (p=0.025, Phi=0.5). Although localization of a specific symptomatic level was not studied, 47% of those with positive discograms had ‘retreat of referred symptoms from the periphery toward the midline of the spine’ (centralization) during the standard McKenzie evaluation. Centralization was not seen with zygapophyseal joint pain as diagnosed by single intra-articular injection. Furthermore, all patients with a positive discogram (15 of 24 total discograms) reported pain when rising from sitting. A positive correlation (p=0.02) was, however, also noted in patients with sacroiliac joint pain.
Donelson et al.5 also prospectively studied 63 patients with chronic low back pain to evaluate the ability of the McKenzie mechanical lumbar assessment to diagnose discogenic pain and assess annular competence as determined by provocation discography. Seventy-four percent of centralizers and 69% of peripheralizers had a positive discogram as defined as exact pain reproduction accompanied by an abnormal image (nucleogram/CT), provided no pain was reproduced at an adjacent control level. The disc was interpreted as having a complete annular disruption or noncontained pathology if there was poor resistance to injection and contrast spread through the anulus to the epidural/perineural or peridiscal space. The disc was interpreted as having an intact outer anulus or contained pathology if there was firm resistance to injection even if contrast leaked from the disc at peak injection pressure. Of the centralizers, 91% had a competent anulus. Of the peripheralizers, 54% had a competent anulus. Of the patients whose symptoms did not change with repeated end-range movement, only 12.5% had a positive discogram. These differences were significant. The localization of a specific symptomatic level was not addressed and, therefore, these maneuvers could only be used for screening but not for identifying specific symptomatic disc levels for targeted interventional treatment.
A ‘bony vibration stimulation test’ or ‘vibration pain provocation’ was described by Yrjama and Vanharanta and the results of bony vibration were compared to the results of provocation discography.6 The studies assumed provocation discography as the reference standard and compared the bony vibration stimulation test by itself or in combination with either ultrasound or MRI.
Thirty-eight patients were studied with the bony vibration stimulation test, ultrasound, and provocation discography.7 Discs were graded by ultrasonographic findings. Grade 0 was a normal disc. Grade 1 discs showed a hyperechoic lesion in the inner anulus. Grade 2 discs demonstrated a hyperechoic lesion in the outer anulus. Grade 3 discs showed a hyperechoic area extending outside the disc. When used alone, the bony vibration stimulation test yielded a sensitivity of 65% and a specificity of 58%. In the patients with a grade 1 or grade 2 disc, the sensitivity was 90% and specificity 75%. In the patients who had a grade 3 disc and pain on bony vibration the sensitivity and specificity were 50%.
The authors also studied 33 patients with low back pain, correlating the results of bony vibration stimulation test and MRI with the results of provocation discography.8 When used alone, the bony vibration stimulation test yielded a sensitivity of 63% and specificity of 44%. If patients with history of previous lumbar surgery were excluded, the sensitivity was 61% and specificity 67%. In patients with or without previous history of surgery who had MRI findings of ‘partial annular rupture’ (as defined as irregular or absent intranuclear cleft images or bright-signal nuclear material into the outer anulus on T2-weighting), the sensitivity was 88% and specificity 50%. If the patients with previous surgery were excluded from this group, the sensitivity was 88% and the specificity 75%. The only false-positive finding in this group was a patient who was ‘hypersensitive’ and felt pain at all levels tested. If a ‘total annular rupture’ (defined as T2-weighted or proton density images showing discontinuity of the low-signal band representing the outer rim of the anulus) was seen, the sensitivity decreased to 47% and specificity to 50%.
UTILITY OF POSTDISCOGRAM COMPUTED TOMOGRAPHY
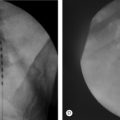
Discography was originally used as an adjunctive to myleography to visualize lateral herniations (Fig. 94.2). There are, however, fundamental limitations to using discograms exclusively as an imaging tool. The classic nucleogram patterns viewed with anteroposterior (AP) and lateral radiographs have been described as both normal and degenerative. Quinnell is credited with the original description of interpreting radiographic images of discography although he never proposed a classification scheme.9 He discussed the importance of monitoring contrast flow and volume to help improve the interpretation of the nucleograms.
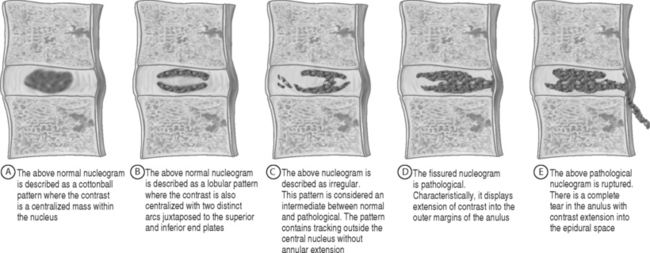
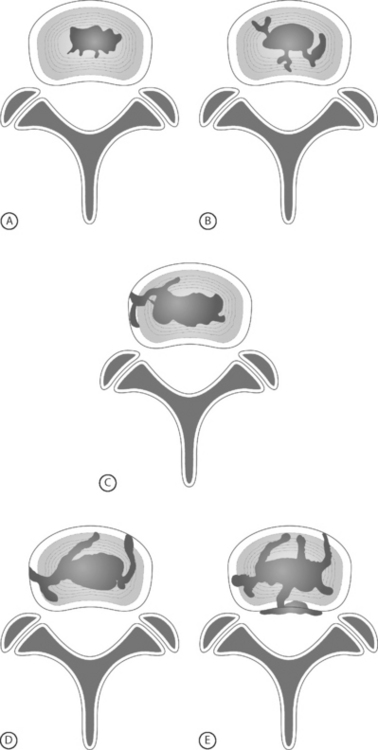
In 1986, Adams et al. initially classified nucleogram patterns into five categories; cottonball, lobular, irregular, fissured, and ruptured (Fig. 94.3).10 Cottonball and lobular patterns are thought to be normal variations, while fissured and ruptured are pathological. An irregular pattern is considered intermediate between these normal and pathological presentations. Adams et al. hypothesized the pathological patterns were due to disc degeneration. Cottonball nuclear patterns show the contrast central to the disc with an ovoid appearance (Fig. 94.3A). Lobular nuclear patterns also show the contrast centralized within the disc; however, there are two distinct arcs that may or may not be contiguous (Fig. 94.3B). An irregular pattern shows some tracking of the contrast outside the central nucleus without extension to the outer anulus (Fig. 94.3C). Although the contrast is intranuclear with irregular nucleograms, the small crevices and clefts exhibit early evidence of degeneration. Fissured nucleograms extend to the posterior annular margin, while ruptured nucleograms demonstrate complete radial tears and show contrast spread into the epidural space (Figs 94.3D, 94.3E).10 Adams speculated that by viewing the first four types of nucleograms, a natural progression of disc degeneration can be seen.
Postdiscogram CT scans provided a more comprehensive view of the disrupted anulus (Figs 94.4–94.6). Axial views allowed a more detailed view of pathological contrast patterns than the AP and lateral radiographs (see Figs. 94.3C, 94.3D, 94.3E). The disorganized patterns seen on radiographs now coalesced into structured images, demonstrating organized annular tears with circumferential spreading.
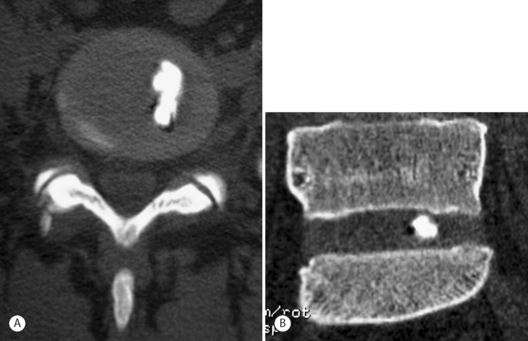
Fig. 94.4 Postdiscography CT with left-sided inner annular injection: (A) axial and (B) coronal views.
In 1989, Thomas Bernard published a case series of 250 patients who underwent both discography and postdiscography CT.11 He showed that computed tomography scanning after discography was not only able to define the type of herniation and disc architecture (protrusion, extrusion, sequestration, or internal disc disruption), but it could also be used to rationalize false-positive levels in the setting of non-nuclear injections (annular injections) (Fig. 94.4).
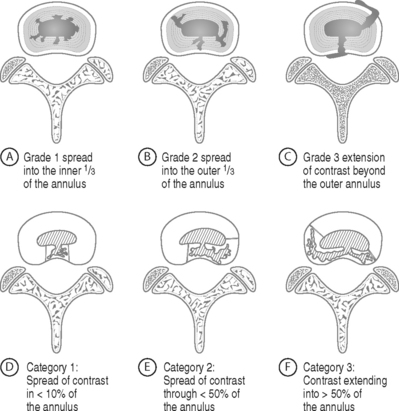
In 1987, Sachs et al. organized the previously inexactly described axial contrast patterns into the Dallas discogram scale (Fig. 94.5).12 Sachs’s original description was based on the appearance of the anulus. This allowed objective categorization of the anulus, classifying both degeneration and annular disruption separately. Sachs’s grading of the Dallas discogram scale is based on a four-point scale of 0 to 3, with zero defined as normal.
Annular disruption defined as ‘leaking/protrusion/annular fissuring’ is based on the radial spread of the contrast away from the center of the nucleus to the periphery (Fig. 94.5A–C). Grade 1 is defined as spread within the inner third of the anulus; grade 2 is into the outer third of the anulus, while a grade 3 is defined as moving beyond the outer anulus.12
Degeneration findings were based on the circumferential distribution of contrast contained in quadrants of the anulus (Fig. 94.5D–94.5F). Grade 1 was defined as local spread in less than 10% of the anulus. Grade 2 was defined as partial spread or less than 50%, while grade 3 was defined as greater than 50% spread of contrast across the anulus.
The development of the Dallas discogram scale not only allowed a new perspective to classify annular degeneration and disruption, but it also increased the inter-rater reliability when interpreting these findings. Sachs et al. were able to show 91% reproducibility and 88% repeatability when using the Pearson correlation test.12 Furthermore, they showed how standard AP and lateral discogram radiographs may appear normal until viewed axially. This reproducibility helped validate the Dallas discogram scale.
Aprill and Bogduk soon added a grade 4 to the disruption scale.13 Approximately 10 years after its original description, Schellhas et al. expanded upon the three-grade disruption classification system to propose the modified Dallas discogram scale. The modified Dallas discogram scale incorporates both aspects of degeneration described as circumferential involvement as well as annular disruption depicted as radial contrast extension. The definitions of grades 0–2 remained the same. Grade 3 was expanded slightly to include either focal or radial extension of contrast into the outer third of the anulus, with a limitation of circumferential spread less than 30 degrees. Grade 4 was defined the same as grade 3, but with greater than 30 degrees of circumferential spread into the outer anulus. Grade 5 is a full-thickness tear, either focal or circumferential, with extension of contrast outside the anulus (Fig. 94.6).14
CORRELATION OF LUMBAR PROVOCATION DISCOGRAPHY WITH LUMBAR MRI
Lumbar MRI is a sensitive means to investigate anatomic abnormalities of the low back. However, even asymptomatic subjects have been noted to have significant spinal pathology on imaging, including disc protrusion or extrusion with or without neural compromise.15–17 Therefore, although MRI demonstrates pathology, it does not necessarily reveal whether the abnormality is causing a patient’s symptoms. The correlation between MRI findings and provocative discography results has been investigated. The common goal of these studies was to determine whether imaging findings could predict the presence of concordant discogenic pain. If imaging studies could reliably predict discography findings, discography was unnecessary. The accuracy of MRI findings such as the high-intensity zone (HIZ) and endplate changes in determining symptomatic levels have been compared to the results of discography.18
High-intensity zone
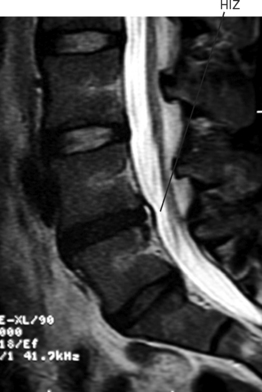
The high-intensity zone in the lumbar spine was first described by Aprill and Bogduk (Fig. 94.7)13 as a high-intensity zone (HIZ) seen on T2-weighted, sagittal images and defined by the authors as a high-intensity signal (bright white) located in the substance of the posterior anulus fibrosus. The HIZ must be clearly dissociated from the signal of the nucleus pulposus because it is surrounded superiorly, inferiorly, posteriorly, and anteriorly by the low-intensity (black) signal of the anulus fibrosus and because the HIZ has an appreciably brighter signal than the nucleus pulposus.
Schellhas et al.14 sought to reproduce Aprill and Bogduk’s findings with a similar study. In their retrospective analysis of 100 HIZs in 63 symptomatic patients, all discs with HIZ were internally deranged with annular disruption, 87 of 100 HIZ discs were concordantly painful at discography, and all 87 of these concordantly painful HIZ-containing discs had grade 3 to grade 5 annular tears on their modified Dallas discogram scale. Their schema is identical to Aprill and Bogduk’s; however, they further stratified the Dallas discogram and added grade 5 to identify those discs which had a ‘full-thickness tear, either focal or circumferential, with extra-anular leakage of contrast.’ Individual discs could be classified into two categories, such as grade3/grade 5 or grade 4/grade 5.14
Other similar studies correlating HIZ with positive provocation discography have shown poor sensitivity of 26%, high specificity of 90–95.2%, positive predictive values of 40–88.9%, and negative predictive value of 47–83%.19
The interobserver reliability of HIZ also varies. Aprill and Bogduk found that out of 67 images, the two observers agreed on the presence of HIZ in all but one (1.5%). Though both observers noted the abnormality, the two disagreed on its meeting the criterion of brightness due to poor-quality film. However, Smith et al.19 only found fair to good interobserver reliability with a kappa value of 0.57 with 95% confidence interval 0.44–0.70.
The original description by Aprill and Bogduk13 only included HIZ located in the posterior anulus and had a prevalence of 28%. The clinical significance of the HIZ was further studied by Rankine et al.20 in a patient population without neural compression. When including HIZs in any aspect of the anulus, the prevalence in a specialty spine surgery clinic was 45.5%. Most of these were posterior (77%) followed by posterolateral (22%). The HIZ was associated with moderate disc degeneration as assessed by signal reduction on T2-weighted sagittal images. There was no correlation of presence of HIZ with clinical features such as age, duration of symptoms, Oswestry score, or Schober’s extension–flexion range of motion testing. There was also no correlation with patient history of employment, pain above or below the knee, or the positions or activities worsening pain. No physical examination findings studied predicted the presence of HIZ. The examination findings tested were paraspinal muscle spasm, spinal tenderness, straight leg raise, neurologic testing with reflexes, myotomal and dermatomal testing, and Waddell’s testing. Correlation of HIZ presence with positive provocative maneuvers producing concordant axial pain with forward bending or extension/quadrant loading was not measured.
Endplate degeneration on MRI
Magnetic resonance signal intensity changes adjacent to vertebral endplates have been described and are associated with degenerative disc disease.21 Modic classified these endplate changes into two types, while others have expanded their classification to three.22 Type 1 endplate changes have decreased signal on T1-weighted images and increased signal intensity on T2-weighted images. Type 2 endplate changes have increased signal on T1-weighted images and isointense or slightly increased T2-weighted image signal intensity. Type 3 endplate changes have a decreased signal intensity on both T1-weighted and T2-weighted images. Kokkonen et al.18 compared endplate degeneration to pain provocation on discography and to the original Dallas discogram description which included three grades of annular disruption. Modic-type endplate degeneration was found to have a strong correlation with disc (anular) degeneration. There was no correlation between endplate degeneration and ‘disc rupture’(annular rupture) and no correlation between endplate degeneration and pain provocation by discography. Based on these data, provocation discography would not necessarily be positive for those who have pain associated with endplate changes.
LUMBAR PROVOCATION DISCOGRAPHY AND ITS PREDICTIVE VALUE FOR TREATMENT AND PROGNOSIS
In 1975, Simmons and Segil retrospectively reported the value of discography for the cervical, thoracic, and lumbar spine by accurately localizing a symptomatic spinal level based on postoperative results.2 Lumbar discograms were performed at 995 levels in 393 patients. Discogram results were assessed by patient pain response, amount and resistance to injection, and discographic appearance by Collis criteria, which describes discs as normal, degenerate, or protruded. Various clinical examinations were compared to the results of surgery on a scale with poor, fair, good, or excellent categories based on patient rating, complaints, occupation, activities, examination findings, and radiographic findings. It was assumed that if the patient was relieved of preoperative symptoms or was significantly improved after surgery, that the level of surgery selected by a certain test was accurate. Specific diagnoses and numbers for each were not reported but lumbar surgeries performed were ‘discotomy,’ ‘discotomy and fusion’ (usually posterolateral and intertransverse), and fusion alone without laminectomy. Overall, 94% of these lumbar surgery patients had satisfactory (fair to excellent) results. Diagnostic accuracy for these surgical outcomes was 44% for clinical examination, 71.5% for routine radiography, 45.6% for myelography, and 82% for discography. Specificity, sensitivity, false-positive, and false-negative rates were not addressed.
In 1979, Brodsky and Binder23 performed a retrospective study of patients who underwent discography. The authors performed discography only if the myelogram was negative but the patient was clinically thought to have discogenic pain. Specific indications included complaints which were atypical or without localizing neurologic signs, a myelogram which was equivocal or indeterminate, and a myelogram which was positive at one level while symptoms were suggestive of another. Discography was also performed to evaluate discs adjacent to a herniated disc. Decision-making was ‘significantly influenced’ by the discogram in 77.9% of cases. Decision-making would have been the same without discogram in 22.1%. Positive discography was confirmed with surgery in 55.8% of the cases.
In 1988, Calhoun et al. prospectively studied the predictive value of symptom reproduction during provocation discography as a guide to planning spine surgery for symptomatic intervertebral discs in the absence of nerve root compression.24 All 195 patients had lumbar provocation discography at L4–5 and L5–S1, most at L3–4, and some at L2–3 and all underwent lumbar surgery including anterior or posterior fusion and/or laminectomy. With at least 2-year follow-up, surgical success was based on whether the surgical objective was achieved radiographically (successful fusion, etc.) and clinical result was based on complete or significant relief of symptoms, resumption of work and/or normal activities, and no intake of analgesics. Failure to achieve these results was ‘clinical failure.’
Also in 1988, Blumenthal et al.25 used provocation discography to diagnose internal disc disruption (IDD) with the main purpose of the study being to evaluate the efficacy of anterior lumbar fusion as a treatment for IDD. All 34 patients underwent provocation discography and anterior fusion with average follow-up of 29 months. The diagnosis of IDD required radiographic signs of degeneration and discography with concordant pain reproduction with ‘instillation of small amounts of contrast.’ Successful treatment was defined as return to work or normal activities and either no medications or use of NSAIDs only. Fusion success was judged by radiographs only. The successful fusion rate was 73 %, but successful clinical treatment rate was 74%. Four cases were indeterminate for fusion. Of those with healed grafts, 73% had clinical success while only 62.5% of those with nonunion had clinical success. Of those patients with a successful clinical result, 81% had evidence of fusion while only 56% of the clinical failures had evidence of fusion. The authors cite higher previous fusion rates of 91–96%. Wetzel et al. performed a retrospective review of 48 patients, with a minimum follow-up of 2 years, who had lumbar arthrodesis based on provocation discography results.26 All were symptomatic for a mean time of 34.4 months prior to discography. Pain reproduction was graded as concordant or nonconcordant. The discography protocol did not, however, include a negative control disc. Fifty-four percent were single-level discographies, presumably without a control level. Two- and three-level discographies accounted for 31% and 14.5%, respectively. Sixty three-levels were graded as positive based on a concordant pain response. Seventy-five percent of patients had a single-level positive discogram, but 72% of these ‘single-level positive’ patients only had a single level studied. Two-level and three-level positive results were obtained in 18.9% and 6.2%, respectively. However, of the two-level positive discs, 77.8% only had a two-level discogram. None of the previously operated levels was included in discography. Fusion was performed to include all symptomatic levels determined by discography. Previously operated discs were included in fusion if they were adjacent to symptomatic discs. Anterior and posterior fusion techniques with and without varying instrumentation were performed. The clinical outcome was evaluated on the criteria of Zucherman which includes subjective symptom improvement, functional limitations, and amount of analgesic use. Categories were poor, fair, good, and excellent. Success of fusion was also assessed radiographically.
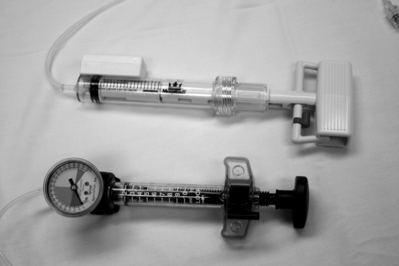
Derby et al. retrospectively evaluated pressure-controlled discography for its ability to predict surgical outcomes for interbody fusion, intertransverse fusion, combination fusion, or nonsurgical treatment.27 The study’s premise is that pressure-controlled manometric discography may allow improved and more specific diagnosis and categorization of discogenic pain and may have the potential to predict outcome of surgery (Fig. 94.8). The positive discs found on provocation discography of 90 patients were classified as ‘chemically sensitive,’ ‘mechanically sensitive,’ or ‘indeterminate’ based on pain provocation at specific values above ‘static opening pressure.’ ‘Opening pressure’ is the manometric reading taken when injected contrast is first visualized entering the disc on fluoroscopy. Derby et al. classified a chemically sensitive disc as one which has positive concordant pain provocation of (1) immediate onset when less than 1 mL of contrast is visualized reaching the outer anulus, or (2) at less than 15 psi above opening pressure. These discs were considered the ‘most positive’ since the lowest pressures resulted in significant concordant pain. A disc was classified as ‘mechanically sensitive’ when concordant pain was noted between 15 psi and 50 psi above opening pressure. A disc was categorized as ‘indeterminate’ when concordant pain occurred between 51 and 90 psi above opening pressure. A disc was classified as normal if no pain occurred at pressures up to 90 psi above opening pressure. Thirty-six patients with chemically sensitive discs were identified. Clinical outcomes were based on the Patient Satisfaction Index adapted from the NASS low back pain outcome instrument, numerical rating scale for pain, and a modified ADL scale. ‘Favorable outcome’ was defined as at least two favorable outcomes of the three scales.
Although this study was limited by its small sample size and retrospective, nonrandomized nature, it demonstrates that low-pressure-sensitive discs may have a different pathobiology and respond differently to treatment than discs that are concordantly painful at higher pressures.28
Derby et al. went on to perform a pilot study in which 32 patients were prospectively followed before and after undergoing IDET.29 Percutaneous treatment was based on chronic low back pain for more than 6 months, axial pain comprising at least 60% of pain symptoms, negative neurologic and neural tension testing, and failure of conservative management. All had at least one positive disc (mean 2.04 symptomatic discs) on provocation discography as defined as provocation of at least 6/10 concordant pain accompanied by an abnormal nucleogram. The discs were classified as low-pressure discs if there was pain produced at minimal pressure less than 15 psi above opening pressure or high-pressure discs if pain was produced at more than 15 psi above opening pressure. Low-pressure discs comprised 37.5% of the discs and high-pressure discs were more common and comprised 62.5% of the discs. If there were more than two positive discs, a ‘clinical decision was made as to which discs were likely to be most symptomatic, and … included’ in the treatment levels.
Rhyne et al.30 retrospectively reviewed 25 cases in which patients who had single-level positive provocation discography did not undergo surgical treatment. The patients had been offered posterolateral fusion but refused due to fear of complications, insurance denial, knowledge of acquaintances who worsened after surgery, or desire to change lifestyle and live with the pain. The patients had a mean follow-up of 4.9 years and completed clinical evaluation including Roland-Morris disability scale and pain scale of Million et al. These scales were filled out twice, one representing their current status and the second to represent the recall of their status at the time of discography. Based on this assessment, 68% of patients improved, 8% had no perceived change in status, and 24% worsened. No patient was pain-free or free of disability. Of those who improved, pain improved an average of 39% and disability decreased an average of 42%. Patients who reported improvement had a shorter history of low back pain (3.5 years versus 11 years) and were older (45 years old versus 33 years old). Psychiatric disease was present in 66.7% of those who worsened. This study is certainly flawed in that not only is it a retrospective study, but the subjects were asked to retrospectively enter data to reflect their status an average of 5 years prior to the time of the study. However, it does demonstrate that 68% perceived an improvement.
VALIDITY AND FALSE-POSITIVE RATES OF PROVOCATION DISCOGRAPHY AS A DIAGNOSTIC TOOL
Holt’s classic study questioned discography’s value, concluding that the false-positive rate of discography in asymptomatic volunteers was 36% based on the ratio of abnormal discographic images to the number of satisfactory disc injections.31 Holt’s work has been widely criticized. Simmons et al. ‘acknowledge[d] that Holt’s study was appropriate for its time,’ but noted subsequent advances in nonirritating contrast dye and radiologic equipment.32–34 In their reassessment they noted Holt’s high failure rate for proper needle placement, which was 30% for the lower two disc levels (site of most disc pathology), 37% for L5–S1, and 23% for L4–5. The selection process for asymptomatic volunteers (who were prison inmates) was not clearly defined and there were discrepancies within the text. Additionally, only disc morphology, and not pain provocation, was considered in calculation of false positives. If pain response and disc morphology were considered, then reanalysis demonstrates that the true negative rate would be 74%. If only patients with successful injections were considered, then the accuracy rate of discography would be 81.9% despite the use of highly irritating contrast material (Hypaque).
‘Major advances in the techniques of discography’ occurring after Holt’s 1968 study prompted Walsh et al.33 to perform a similar study in 1990, reevaluating discography’s value and specificity using ‘current techniques’ and more precise methodology. They used the much less irritating contrast, iopamidol, instead of diatrizole. More importantly, they included pain provocation evaluation. They rated the pain reproduction according to intensity, presence of pain-related behavior, and pain similarity (concordancy) for symptomatic patients. A ‘positive pain-related response’ to disc injection was recorded if the subject exhibited two or more types of pain behavior and rated the pain intensity a 3 or more (‘bad’ on a scale 0 to 5). Pain behaviors considered were guarding/bracing/withdrawing, rubbing, grimacing, sighing, or verbalizing. (Inter-rater reliability for these was 92.6%.) Because asymptomatic subjects could not report ‘concordant’ pain, they were termed ‘positive’ if there was an abnormal disc morphology with positive ratings for pain intensity and pain behavior. Symptomatic control patients required a typical rating for pain similarity to be called ‘positive.’
They included two groups: an asymptomatic group of young men and a symptomatic control group determining interobserver reliability for pain response evaluation and semiblinding the raters as to which participants were asymptomatic. The asymptomatic test subjects demonstrated an abnormal discographic disc morphology in 17% but a false-positive rate of 0% based on pain response. Even if more liberal criteria were used such as only minimal pain (at least 1 on a scale of 5) or presence of only one pain behavior, the false-positive rate would have been 3% and 7%, respectively.
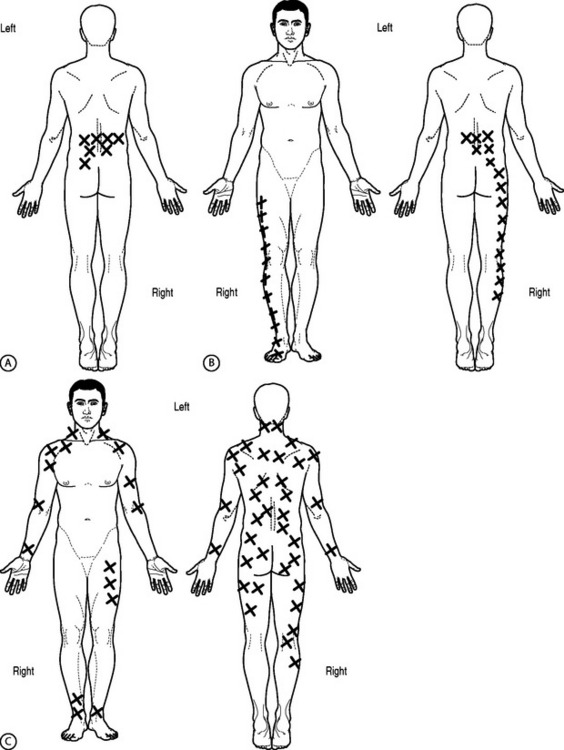
Carragee and colleagues have extensively studied the possibility of false-positive results obtained from provocation discography in clinical practice (Table 94.1). Tanner and Carragee35 suggest that ‘the reproduction of concordant pain has less diagnostic utility that [sic] often assumed, particularly if there is pathology in a similar sclerotomal region.’
Table 94.1 Summary of studies from Eugene J. Carragee, M.D., et al.
| Publication | Objective | Conclusion |
|---|---|---|
| Positive provocation discography as misleading finding in the evaluation of low back pain. Chicago, IL: North American Spine Society; 1997. | To compare results and outcomes with Walsh’s 1990 discography results. | Patients with positive lumbar discography were later found to have other painful processes such as sacroiliac joint abnormalities and posterior element neoplasm. The reproduction of concordant pain has less diagnostic utility than assumed, particularly if there is pathology in a similar sclerotomal region. |
| False-positive findings on lumbar discography: Reliability of subjective concordance assessment during provocative disc injection. Spine 1999; 24(23):2542–2547. | To determine if patients subjective interpretation of pain concordancy during provocative discal injections is reliable. | In patients without a history of low back pain, lumbar discography is able to concordantly produce pain from a posterior iliac crest bone graft harvest site, questioning the reliability of concordant pain production originating from discal pathology. |
| The rates of false-positive lumbar discography in select patients without low back pain symptoms. Spine 2000; 25:1373–1381. | To test the null hypothesis of discography; ‘the first assumption in discography’ that ‘stimulation of a disc in an asymptomatic individual will not cause a significant sensation of pain.’ | When performing discography according to Walsh’s criteria (IASP criteria was NOT used) the rate of false-positive findings may be low in patients without chronic pain conditions and normal psychometric profiles. However, when performing discography in patients with annular disruption, chronic pain, or abnormal psychometric testing, concordant injections are very common. |
| Lumbar high-intensity zone and discography in subjects without low back problems. Spine 2000; 25(23):2987–2992. | To investigate the prevalence and significance of HIZ in symptomatic and asymptomatic patients and compare discography results between the two groups. | The presence of a HIZ does not represent a diagnosis of internal disc disruption, while the same percentages of discs with HIZs were found to be painful during discography in both symptomatic and asymptomatic populations. |
| Provocative discography in patients after limited lumbar discectomy: a controlled, randomized study of pain response in symptomatic and asymptomatic subjects. Spine 2000; 25(23):3065–3071. | To investigate the intensity of pain after lumbar discectomy in both symptomatic and asymptomatic patients. | When performing discography according to Walsh’s criteria (IASP criteria was NOT used) the rate of false-positive findings were reported to be 40% in the asymptomatic group. In the symptomatic postsurgical group, 70% of patients experienced provoked pain during discography. |
| Prospective controlled study of the development of lower back pain in previously asymptomatic subjects undergoing experimental discography. Spine 2004; 29:1112–1117. | To determine if asymptomatic patients who underwent discography with positive findings would proceed to develop back pain after discography and up to 4 years later. | Independently, a positive discogram can be a poor indicator of developing low back pain. |
Initially, Carragee et al. presented case studies in which patients with positive lumbar discography were later found to have other painful processes such as sacroiliac joint abnormalities and posterior element neoplasm.36 With these in mind, they appropriately sought to test the validity of provocation discography and determine its false-positive rates among various subjects by replicating and extending Walsh et al.’s study. They reasoned that in order to check the validity of any clinical test, it is essential to know how many subjects without a given disease will test positive with a particular test for that disease. Also, the relative risk of certain subsets of subjects will affect the meaning of the test. Therefore, they took as their starting point the use of asymptomatic control subjects.35
Their first study applied ‘experimental disc injections’ to subjects with no previous history of low back pain to evaluate the pain responses and pain-related behaviors in the experimental setting. Its aim was to test the ‘first assumption in discography’ that ‘stimulation of a disc in an asymptomatic individual will not cause a significant sensation of pain.’37 Twenty-six volunteers with an mean age of 43 years were selected from three sources: patients being followed after cervical surgery with best results and pain free (n=10), patients from the same cervical surgery cohort but with the worst results and with cervical-related chronic pain(n=10), and finally patients meeting the DSM-IV criteria for somatization disorder (initial n=10). All were asymptomatic for low back pain. Provocation discography was performed according to the protocol of Walsh et al.33 with a ‘positive’ result scored if the pain response was greater than or equal to 3 out of 5, but only if accompanied by two or more pain behaviors (inter-rater agreement was 97.4%).37
They found that disc stimulation was ‘false positive’ in at least one disc in 10% of subjects in the pain-free group and 40% of those with chronic pain (cervical-related chronic pain). Of the somatization group, 40% (n=4) dropped out before discographic injection and two others stopped the procedure after only one or two disc levels were injected. Of those remaining in the somatization group who completed all disc injections, 75% (3 of 4 subjects) had a least one-level positive discogram. If the somatization subjects who had at least one disc injected were considered, then there was an 83% rate of subjects with false-positive pain provocation.
This study has been criticized on the basis that ‘concordant pain,’ paramount in provocation discography, cannot, by definition, be tested in asymptomatic individuals.34 In response, Tanner and Carragee point out that all clinical tests must be evaluated in part by the results obtained in asymptomatic or disease-free persons.35
Bogduk re-analyzed Carragee’s data in this study using IASP criteria (Table 94.2): that is, concordant pain with an intensity of 6/10, abnormal morphology, and at least one painless control level.38 Specifically, he imposed the criteria that the suspect disc(s) be surrounded by at least one painless adjacent disc. He also applied the manometric criteria for pressure of injection. When at least one adjacent disc was required to be painless in order to call a given level positive, the false positives in the chronic pain group fell from 40% to 20%. But the rate remained stable for the no-pain group (10%) and somatization group (75%). Bogduk then used two different manometric parameters to analyze Carragee’s data. Under the criterion that the pressure of disc injection be less than 50 psi, the false-positive rates of both the chronic pain and somatization groups fell. The false-positive rates for the chronic pain group decreased to 10% (original 40%) while the somatization group had a resultant 50% false-positive rate (original 75%). If the stricter criterion of disc injection pressure less than 15 psi (called the ‘chemically sensitive disc’ by some) is used, then the false-positive rates fall to 0% in the pain-free group, 0% in the chronic pain group, and 25% in the somatization group. Additionally, Bogduk stated that because of the small sample size, confidence intervals should be used, and with these adjustments found that the false-positive rates either became zero or the confidence intervals overlapped zero even in the somatization group. Based on this reanalysis of Carragee et al.’s data, Bogduk suggested using the criterion of 50 psi in general clinical practice to restore sensitivity but 15 psi in patients with suspected or known somatization.
Table 94.2 IASP criteria for positive discography
| P0 control level |
| Concordant locational pain |
| Pain intensity ≥6/10 |
| Morphological disc changes |
In order to evaluate false-positive rates of ‘concordant’ back and buttock pain, Carragee et al. devised a study in which patients who had never had low back pain prior to posterior iliac crest bone grafting for nonlumbar spinal reasons were evaluated with provocation discography for concordant bone graft donor site pain.39 Eighty-five percent of subjects (7 of 8) experienced similar or exact pain. Sixty-four percent of discs caused similar or exact pain. Of the discs with annular tears, 70% (7 of 10) caused similar or exact pain reproduction of the patient’s usual iliac crest bone graft harvest site. In this small sample of 8 patients and 24 discs, 50% of subjects had false-positive concordant donor site pain on disc stimulation if pain magnitude, concordancy, and demonstration of pain behavior are all considered. Carragee et al., again, did not use the IASP criteria. If these data are reanalyzed with IASP criteria, 25% of subjects would have false-positive findings if disc injection pressure was less than 50 psi, or a 12.5% false-positive rate for less than 15 psi. Still, these results call into question whether a patient can reliably distinguish pain from discogenic versus nondiscogenic sources.
After the rates of false positives in subjects without previous history of low back and/or buttock pain due to spinal pathology were evaluated, Carragee et al. next sought to determine the rate of positive disc injection in patients who had a previous history of lumbar-related complaints.40 They no longer called these ‘false positive,’ presumably to eliminate the association with concordancy of pain response. They performed provocative discography on 20 patients from a cohort who had a previous history of symptomatic single-level lumbar pathology, underwent subsequent limited posterior discectomy 2–10 years prior to the study, but were now asymptomatic. They compared the rates of positive injection in this group to a control group of 27 subjects who were symptomatic with persistent or recurrent lumbar or lower limb symptoms after similar surgery 14 months to 6 years prior to the study. Twenty-six percent of these symptomatic patients had normal psychometric scores.
In summary, the Carragee et al.40 studies point out the fact that false-positive results can occur in discography as with any clinical test. These false positives are more likely in those with abnormal psychometric scores, specifically somatization disorder, and in previously operated discs. Bogduk has pointed out that adherence to the IASP criteria can decrease the false-positive results to an acceptable level.
O’Neill and Kurgansky published a retrospective study of 253 patients in an attempt to further delineate false-positive rates and offer suggestions to increase specificity.41 Particularly, they wanted to determine if the distribution of disc pain thresholds would organize into subgroups to help identify false positives. To accomplish this, they incorporated pressure-controlled discography through manometry. By correlating the manometry information with false-positive findings from Carragee’s asymptomatic populations,36,37,39,40,42 they were able to select out for false positives. They concluded that there was a 100% chance of false positives above 50 psi. Pressures ranging 10–25 psi had a 50% chance of being a false positive. However, discs with pain responses at 0–10 psi were most likely true positives. Based on these data, there appears to be a bimodal distribution of true positives. One population of true positive were those who had positive pain responses with cut-off values above 25 psi and below 50 psi; the other population of patients were those who had pain responses at less than 10 psi. However, it was difficult to confirm that the latter are true positive due to testing limitations.
DISCOGRAPHY COMPLICATIONS
The most serious potential complication is disc space infection. Before antibiotic prophylaxis became routine, the reported rate of discitis ranged from 2.3% per patient and 1.3% per disc to 0.1% per patient and 0.05% per disc.43 The most common causative organisms are S. aureus and S. epidermidis. The reported incidence of discitis may be reduced by using a double-needle techniques and preprocedural antibiotics.44 In 1990, Osti et al.45 designed an experimental discography model using sheep. They added cefalozin to the intradiscal suspension or administered it intravenously 30 minutes prior to intradiscal inoculation of bacteria. The prophylactic treatment prevented any radiographic, macroscopic, or histological signs of discitis. In a follow-up study of 127 patients this protocol also prevented disc space infection following discography and became the basis of the routine use of intravenous antibiotics (e.g. 1 g of cefalozin) prior to discography, adding antibiotics to the injected contrast, or the use of both intravenous and intradiscal antibiotics.
CONTROVERSIES
Sources for false-positive results
Pressurizing an adjacent symptomatic disc is also a potential cause of false-positive results. There is an assumption that when injecting an intervertebral disc (IVD) and checking its pain response, adjacent intervertebral discs are not pressurized. Therefore, any pain response is believed to be solely attributed to the IVD level injected. Some practitioners have anecdotally observed that pressurizing IVDs with normal anatomy occasionally results in significant pain when there is an immediately adjacent nonruptured pathologic IVD. These practitioners believe that if this adjacent pathologic IVD is later anesthetized, the original normal-appearing IVD will no longer be painful with IVD injection. If validated, such a response supports the theory that a positive pain response may be caused by pressurizing an adjacent pathologic IVD and not from the injected IVD. On the other hand, preliminary data suggest that pressurizing an intact lumbar disc to pressures exceeding 100 psi will not result in any measurable pressure changes in the adjacent discs.45a
Does needle insertion site affect discography results?
Discogenic pain often lateralizes to one side. Some discographers, therefore, advocate approaching the target disc contralateral to the patient’s more painful side to theoretically differentiate index pain from needle insertion pain on nondiscal structures.46 For example, a patient with predominantly right-sided back pain (index pain) would be investigated with needle entry left of midline. Needle insertion ipsilateral to the patient’s index pain has been speculated to increase the false-positive rate. False-positive pain reproduction could occur by stimulation of the adjacent spinal nerve, soft tissue, or osseous structures. Stimulation of a nerve root usually causes a characteristic lancinating pain that is different than the dull, aching pain provoked by contrast injection. However, residual pain after needle repositioning may still cause interpretive challenge to the patient and physician.
Cohen et al.47 attempted to determine if needle insertion affected discography results. Retrospective analysis of 127 discography patients who all had a right-sided approach due to limitations of their fluoroscopic unit revealed no significant difference in the rate of positive results among patients with midline, left-sided, or right-sided pain. Unfortunately, one limitation of the study was the lack of any correlation to radiological findings. There was no analysis of left- or right-sided MRI findings and how those results may have factored in on the outcome of discography. The authors concluded that the side from which discography is performed had no effect on results of provocation discography. No ‘gold standard’ or postdiscography treatment outcomes were correlated. Instead, they based their conclusion on the assumption that their population should theoretically have an anticipated equal incidence of right- and left-sided pain source.
Slipman et al.48 investigated the commonly held notion that the site of pain reproduced during discography should correspond to the side of their annular tear in one-level positive discography. In their retrospective study, they found a random correlation between the side of a concordantly painful, CT visualized annular tear and the lateralization of one’s perceived pain. Slipman et al. postulated that there are two possible theories to describe this finding. There may be a misperception of the origin of the somatic referred signal to the brain occurring via a convergent sensory pathway or possibly a remote pain source independent from the stimulated disc.
Does needle insertion into a normal or abnormal morphological disc result in damage?
One of the more elusive topics concerns the potential for transitory or permanent iatrogenic disc injury secondary to disc puncture or disc pressurization. Carragee et al.42 published a prospective, controlled study to determine whether asymptomatic subjects develop low back pain after discography. They performed discography on 50 asymptomatic patients. The attempt of the study was to determine if asymptomatic patients with positive LBP on discography were not actually false positives but possible true positives predicting ‘near-term future chronic LBP.’ All 50 patients were followed for up to 4 years. There was no conclusive evidence that a painful injection was an independent predictor of developing low back pain in patients without any abnormal psychometric scores. They also determined whether the presence of high-intensity zones (HIZs) or annular fissures seen on MRI and discographic nucleograms were predictive factors for developing LBP. They compared their findings to the previous studies that demonstrated that an area of HIZ in the outer anulus is an independent finding and not necessarily directly related to LBP.14 Caragee et al. found a weak association with late-onset LBP episodes with HIZ and annular fissured nucleograms subsequent to discography. These two studies suggest that the late onset of permanent disc injury in previously asymptomatic patients is purely coincidental or, at best, a subclinical finding.
Studies performed in the 1940s evaluated the potential of disc punctures to cause a disc herniation.49 Hirsch could not alter a normal disc to any structural pathology from needle penetration. In 1984, Kahanovitz et al. looked at the histological effect of discography in dogs.50 They injected the L1 through L6 discs. The first intervertebral disc was used as a control without any needle perforation or intradiscal substance introduction. The next level was punctured without any infusion of an injectate. The third level underwent injection of saline, while the fourth and fifth discs underwent injection of Hypaque and metrizamide contrast agents. All 10 dogs were eventually sacrificed at 2, 4, 6, 8, and 10 weeks postdiscography. The discs underwent gross examination as well as saffranin-O mucopolysaccharide staining during histological examination. There was no discernable histological difference in any dog at any level, nor was there evidence of any inflammatory response or annular necrosis.
In 1989, Robert Johnson published results from 34 patients who underwent a second discogram.51 The purpose of the study was to determine whether previously normal nucleograms became abnormal within a 2–28-month period of time. He hypothesized that discography does not cause disc herniation or other types of disc damage. Unfortunately, the methodology was flawed. Discography was not performed according to prescribed IASP and ISIS standards (Tables 94.2, 94.3). Furthermore, limited information could be gathered from the outcome because of inadequate statistical analysis of data, the limited number of discs reported, and the constrained means of data collection. Despite these shortcomings, this study demonstrates that within the 42 discs that were initially normal, eight of the discs were fissured on follow-up discograms. The pain was reported as similar or concordant within seven discs, while one disc did not provoke pain. Within all 42 discs with normal nucleograms, there was no evidence of herniation of nuclear material. Three of eight patients with abnormal discs underwent fusions subsequent to the primary discogram. The initially normal discs, now adjacent to the level of fusion, developed abnormal nucleograms. However, the mechanism for these segment changes are not necessarily from the initial discogram, but could be caused by altered biomechanics, surgical trauma, or another unknown cause.
Does antibiotic use mitigate complication rates?
Before antibiotic prophylaxis became a routine component of disc stimulation, reported rates of discitis varied. Preprocedural antibiotics are now the standard of care. Osti et al.’s landmark 1990 publication presented the most compelling evidence to date supporting the use of prophylactic antibiotics.45 We are unaware of any recent studies that have compared infection rates with and without prophylactic antibiotics.
Should psychometrics be routinely performed prior to discography?
Caragee demonstated that individuals with primary somatization disorders are likely to have positive discograms regardless of disc architecture.37 In addition, Block et al. previously showed that patients with elevation of select scales in the Minnesota Mutiphasic Personality Inventory were more likely to over-report pain during discography.52 Both studies suggest that psychometrics should be performed prior to discography. If psychometrics demonstrate concomitant anxiety or depression, the results of discography should be more strictly evaluated.
Are the current standards reliable? When is a disc ‘positive?’
Likewise, any unexpected behavioral responses should be recorded. Examples include concordant pain response during local skin anesthetic injection and hysterical reactions during the procedure.
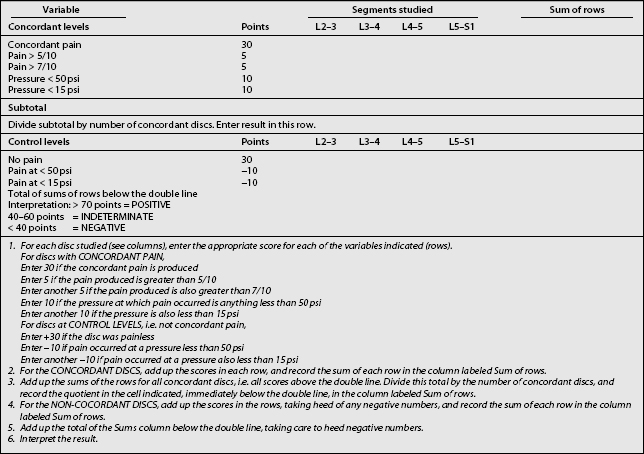
Current IASP and ISIS discography criteria are outlined in Tables 94.2 and 94.3. IASP standards are concrete. ISIS standards further objectify the results by including manometry and attempt to interpret a questionably positive disc through an elaborate scoring system. To their credit, they attempt to objectify factors which are measurable. However, neither criterion takes into account factors which would compromise data interpretation, such as awareness of a pain response to sham injections or reproducibility of pain with repeat pressurization of a specific disc.
1 Nachemson A. Lumbar discography – Where are we today? [Editorial comment]. Spine. 1989;14(6):555-557.
2 Simmons EH, Segil CM. An evaluation of discography in the localization of symptomatic levels in discogenic disease of the spine. Clin Orthopaed Rel Res. 1975;108:57-69.
3 Schwarzer AC, et al. The prevalence and clinical features of internal disc disruption in patients with chronic low back pain. Spine. 1995;20(17):1878-1883.
4 Young S, Aprill C, Laslett M. Correlation of clinical examination characteristics with three sources of chronic low back pain. Spine J. 2003;3:460-465.
5 Donelson R, et al. A prospective study of centralization of lumbar and referred pain: a predictor of symptomatic discs and annular competence. Spine. 1997;22(10):1115-1122.
6 Yrjama M, Vanharanta H. Bony vibration stimulation: a new, non-invasive method for examining intradiscal pain. Eur Spine J. 1994;3:233-234.
7 Yrjama M, Tervonen O, Vanharanta H. Ultrasonic imaging of lumbar discs combined with vibration pain provocation compared with discography in the diagnosis of internal annular fissures of the lumbar spine. Spine. 1996;21(5):571-574.
8 Yrjama M, Tervonen O, Kurunlahti M, et al. Bony vibration stimulation test combined with magnetic resonance imaging: Can discography be replaced ? Spine. 1997;22(7):808-813.
9 Quinnell RC. Pressure standardized lumbar discography. Br J Radiol. 1980;53(635):1031-1036.
10 Adams MA, Dolan P, Hutton WC. The stages of disc degeneration as revealed by discograms. J Bone Joint Surg [Br]. 1986;68:36-41.
11 Bernard TN. Lumbar discography followed by computed tomography: refining the diagnosis of low-back pain. Spine. 1990;15:690-707.
12 Sachs BL, Vanharanta H, Spivey MA, et al. Dallas discogram description: a new classification of CT/discography in low-back disorders. Spine. 1987;12:287-298.
13 Aprill C, Bogduk N. High-intensity zone: a diagnostic sign of painful lumbar disc on magnetic resonance imaging. Br J Radiol. 1992;65(773):361-369.
14 Schellhas KP, Pollei SR, Gundry CR, et al. Lumbar disc high-intensity zone: correlation of magnetic resonance imaging and discography. Spine. 1996;21:79-86.
15 Boden SD, Davis DO, Dina TS, et al. Abnormal magnetic-resonance scans of the lumbar spine in asymptomatic subjects. J Bone Joint Surg [Am]. 1990;72:403-408.
16 Boos N, et al. Volvo Award in Clinical Science: the diagnostic accuracy of MRI. Spine. 1995;20(24):2613-2625.
17 Weishaupt D, et al. MR imaging of the lumbar spine: prevalence of intervertebral disk extrusion and sequestration, nerve root compression, end plate abnormalities, and osteoarthritis of the facet joints in asymptomatic volunteers. Radiology. 1998;209:661-666.
18 Kokkonen S, et al. Endplate degeneration observed on magnetic resonance imaging of the lumbar spine: correlation with pain provocation and disc changes observed on computed tomography discography. Spine. 2002;27:2274-2278.
19 Smith BM, Hurwitz EL, Solsberg D, et al. Interobserver reliability of detecting lumbar intervertebral disc high-intensity zone on magnetic resonance imaging and association of high-intensity zone with pain and annular disruption. Spine. 1998;23:2074-2080.
20 Rankine JJ, et al. The clinical importance of the high-intensity zone on lumbar magnetic resonance imaging. Spine. 1999;24(18):1913-1920.
21 Modic MT, et al. Degenerative disc disease: assessment of changes in vertebral body marrow with MR imaging. Radiology;. 1988;166:193-199.
22 Miller G. The spine. In Berquist T, editor: MRI of the musculoskeletal system, 2nd edn., New York: Raven Press, 1990.
23 Brodsky AE, Binder WF. Lumbar discography: its value in diagnosis and treatment of lumbar disc lesions. Spine. 1979;4(2):110-120.
24 Calhoun E, et al. Provocation discography as a guide to planning operations on the spine. J Bone Joint Surg [Br]. 1988;70(2):267-271.
25 Blumenthal SL, et al. The role of anterior lumbar fusion for internal disc disruption. Spine. 1988;13(5):566-569.
26 Wetzel FT, et al. The treatment of lumbar spinal pain syndromes diagnosed by discography: lumbar arthrodesis. Spine. 1994;19(7):792-800.
27 Derby R, et al. The ability of pressure-controlled discography to predict surgical and non-surgical outcomes. Spine. 1999;24(4):364-372.
28 Carragee EJ. Point of view. Spine. 1999;24(4):371-372.
29 Derby R, Eek B, Chen Y, et al. Intradiscal electrothermal annuloplasty (IDET): a novel approach for treating chronic discogenic back pain. Neuromodulation. 2000;3(2):82-88.
30 Rhyne ALIII, et al. Outcome of unoperated discogram-positive low back pain. Spine. 1995;20(18):1997-2001.
31 Holt EP. The question of lumbar discography. J Bone Joint Surgery [Am]. 1968;50:720.
32 Simmons JW, et al. A reassessment of Holt’s data on ‘The question of lumbar discography.’. Clin Orthopaed Rel Res. 1988;237:120-123.
33 Walsh TR, Weinstein JN, Spratt KF, et al. Lumbar discography in normal subjects: a controlled, prospective study. J Bone Joint Surg [Am]. 1990;72(7):1081-1088.
34 Wetzel FT. Point of view. Spine. 2000:1381.
35 Tanner C, Carragee EJ. Letter to editor in response. Spine. 2001;26(8):995-996.
36 Carragee E, Tanner C, Vittum D, et al. Positive provocation discography as a misleading finding in the evaluation of low back pain. Chicago, IL: North American Spine Society, 1997.
37 Carragee EJ, Tanner CM, Khurana S, et al. The rates of false-positive lumbar discography in select patients without low back pain symptoms. Spine. 2000;25:1373-1381.
38 Bogduk N. An analysis of the Carragee data on false-positive discography. International Spinal Injection Society Scientific Newsletter Summer. 2001;4(2):3-10.
39 Carragee EJ, Tanner CM, Yang B, et al. False-positive findings on lumbar discography: reliability of subjective concordance assessment during provocative disc injection. Spine. 1999;24(23):2542-2547.
40 Carragee EJ, Chen Y, Tanner CM, et al. Provocative discography in patients after limited lumbar discectomy: a controlled, randomized study of pain response in symptomatic and asymptomatic subjects. Spine. 2000;25(23):3065-3071.
41 O’Neill C, Kurgansky M. Subgroups of positive discs on discography. Spine. 2004;29(19):2134-2139.
42 Carragee EJ, et al. Prospective controlled study of the development of lower back pain in previously asymptomatic subjects undergoing experimental discography. Spine. 2004;29:1112-1117.
43 Bogduk N, Aprill C, Derby R. Discography. White AH, editor. Spine care, vol. 1.. Mosby, St Louis, 1995;219-238.
44 Fraser RD, Osti OL, Vernon-Roberts B. Discitis after discography. J Bone Joint Surg [Br]. 1987;69:26-35.
45 Osti OL, Fraser Rd, Vernon-Robers B. Discitis after discography: the role of prophylactic agents. J Bone Joint Surg [Br]. 1990;72:271-274.
45a Furman MB, Lee TS, Puttlitz KM et al. Lumbar provocative discography: evaluation of possible disc pressurization. Proceedings of the North American Spine Society Mid Year Meeting – Meeting of the Americas II, 2002 [abstract].
46 Endres S, Bogduk N. Practice guidelines and protocols: lumbar disc stimulation. ISIS 9th Annual Scientific Meeting Syllabus. Sep. 2001:1456-1475.
47 Cohen SP, Larkin T, Fant GV, et al. Does needle insertion site affect discography results? A retrospective analysis. Spine. 2002;27(20):2279-2283.
48 Slipman CW, Patel RK, Zhang L, et al. Side of symptomatic annular tear and site of low back pain: is there a correlation ? Spine. 2001;26(8):E165-E169.
49 Hirsch C. An attempt to diagnose the level of disc lesion clinically by disc puncture. Acta Orthop Scand. 1948;18:131-140.
50 Kahanovitz N, et al. The effect of discography on the canine intervertebral disc. Spine. 1986;11:26-27.
51 Johnson RG. Does discography injure normal discs? An analysis of repeat discograms. Spine. 1989;14:424-426.
52 Block AR, Vanharanta H, Ohnmeiss DD, et al. Discographic pain report: influence of psychological factors. Spine. 1996;21:334-338.