[level-membership-for-radiology-category]
CHAPTER 9 Liver Metastases
MODALITY CHOICES AND TECHNIQUES
Computed Tomography
Generally, most metastases (any primary) are hypovascular and are best depicted on PV phase CT. Metastases that are considered hypervascular include renal cell carcinoma, carcinoid, neuroendocrine tumors, thyroid carcinoma, and melanoma and have been shown to be better seen on HA phase imaging. Breast carcinoma hepatic metastases can be hypervascular, but these represent a small minority of breast cancer liver metastases.
Triple-phase technique is desirable at initial imaging (referral for staging or clinical suspicion of liver metastases) to accurately characterize any lesions, benign or malignant, which may be encountered. However, follow-up of patients with known liver metastases with PV phase enhanced CT alone is generally sufficient and will avoid unnecessary radiation exposure. Support for this approach comes from work by Frederick and colleagues, who looked retrospectively at a series of 84 consecutive triple-phase CT scans in 80 women who were known or suspected to have breast cancer liver metastases.1 They evaluated each phase independently for focal liver lesions and found that the PV phase outperformed noncontrast and HA phases for lesion detection and identified more malignant lesions than the other phases. Importantly, no CT interpretation was converted from negative to positive for the presence of liver lesions based on the addition of either noncontrast or HA phase images. The authors noted that noncontrast and HA phase imaging added additional information in some cases, but found it difficult to justify their routine use when the clinical question was the presence or absence of metastatic disease.
The same group subsequently published a larger, prospective study of liver metastases detection in 300 consecutive triple-phase helical CT examinations in breast cancer patients.2 PV phase images were reviewed alone for the number and size of focal liver lesions. PV images were then reviewed in conjunction with noncontrast images, and again in conjunction with HA phase images. Little improvement in sensitivity for lesion detection was noted when comparing PV phase alone with PV phase in conjunction with noncontrast imaging (97% to 100%) or HA phase (96% to 98%), suggesting little additional benefit was derived from the addition of noncontrast or HA phases. Two to 4% of lesions were seen on HA phase imaging only. These represented either false-positive cases or were seen in conjunction with other metastases on the PV phase. The authors concluded that routine triple-phase imaging of breast cancer patients in whom liver metastases were suspected was not warranted, except at the time of initial examination when triple-phase technique is useful for characterizing focal lesions (e.g., cysts, hemangiomas, focal nodular hyperplasia) that may be encountered.
Magnetic Resonance Imaging
The PV phase occurs 45 to 75 seconds after the start of bolus contrast injection, and during this phase, the liver parenchyma is maximally enhanced, as well as the portal and hepatic veins. This phase is optimal for depiction of most hypovascular liver lesions, including most metastases.
FINDINGS OF LIVER METASTASES
Ultrasound
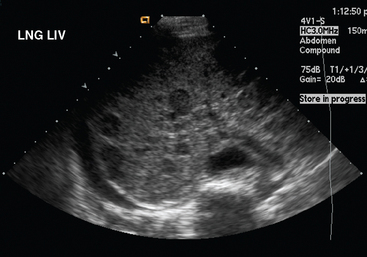
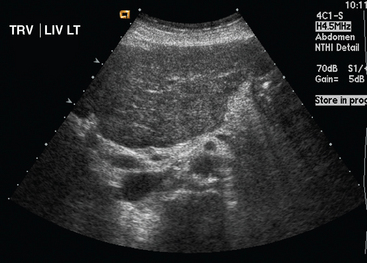
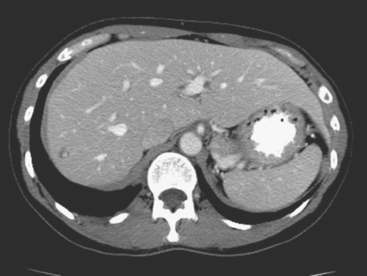
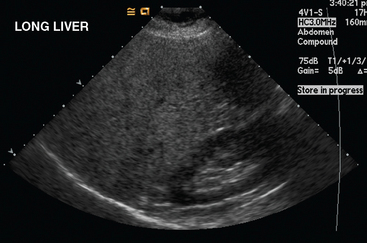
Liver metastases on ultrasound may manifest as solitary or multiple lesions, which most commonly are hypoechoic compared with the normal liver (Figure 1), or as diffuse inhomogeneity of the liver parenchyma (Figure 2).
Computed Tomography
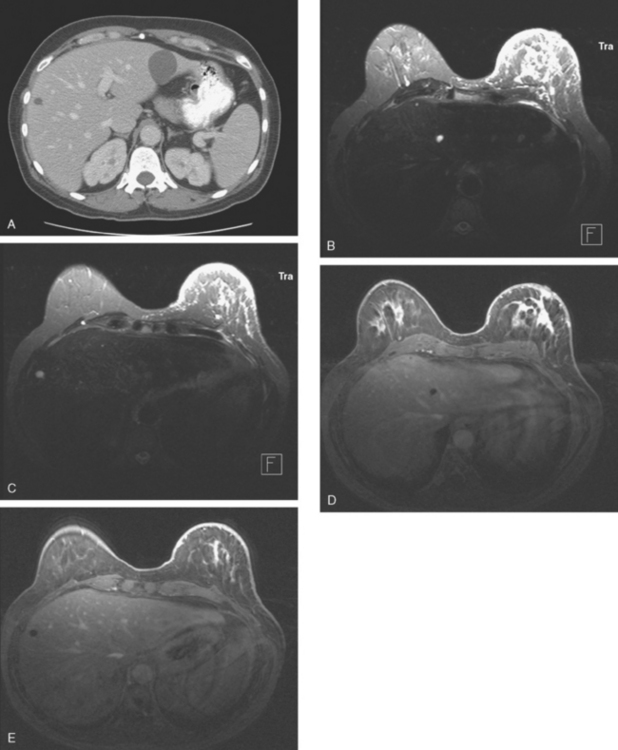
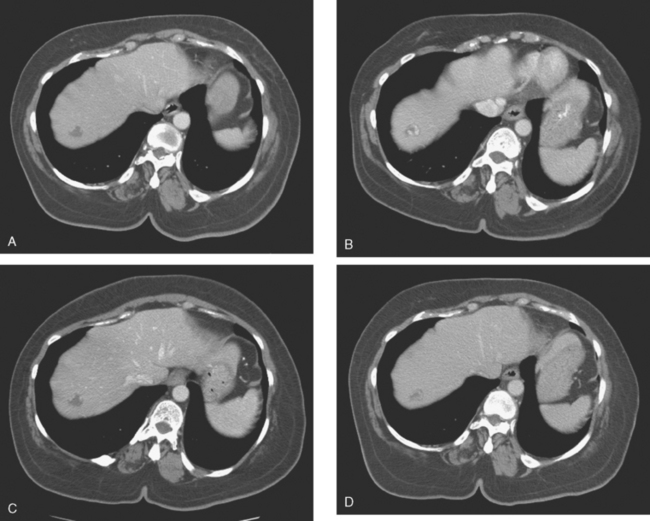
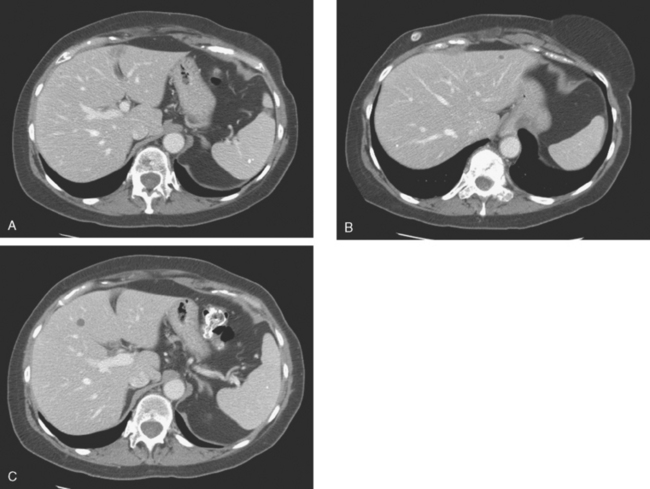
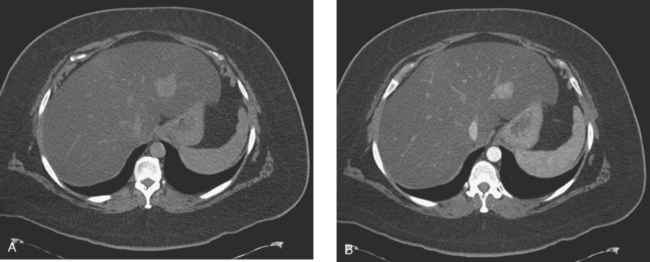
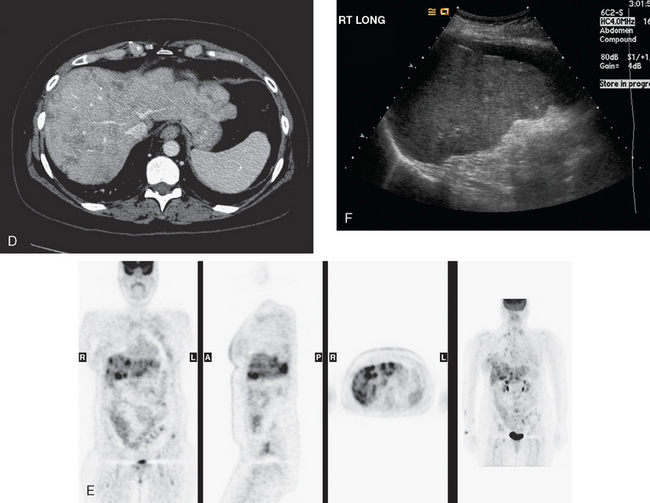
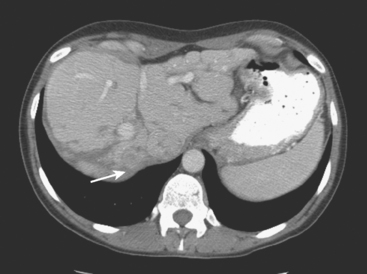
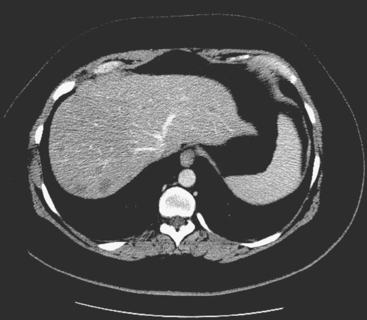
On CT, breast cancer liver metastases typically are hypodense relative to normal liver on noncontrast series, may display rim enhancement or be hypervascular compared with the poorly enhanced liver on the hepatic arterial phase of enhancement, and on the portal venous phase, are hypodense relative to the enhancing liver (Figure 3).
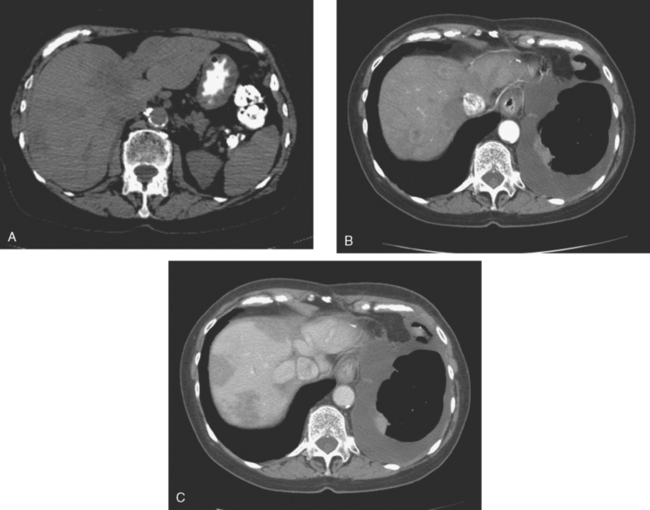
FIGURE 3 CT images of liver metastases from an 83-year-old woman (same patient as in Figure 2) who developed a malignant pleural effusion and liver metastases 20 years after undergoing mastectomy for breast cancer. At the time of this study, the patient had known metastatic breast cancer for 3 years and had been relatively asymptomatic, first on letrozole (Femara) and then on fulvestrant (Faslodex), but progressive disease was suspected based on rising tumor markers. A, Unenhanced abdominal CT scan (acquired with arms at sides during tidal respiration for attenuation correction of PET) shows liver metastases as hypodense lesions compared with rest of the liver. B, Arterial phase enhanced CT scan shows three similar-appearing metastases, with thick peripheral enhancement and central hypodensity. The large hepatic veins are not enhanced during the HA phase of enhancement. C, PV phase enhanced CT image, same level, shows the lesions as larger hypodense regions, and an additional hypovascular metastasis is now seen in the peripheral right lobe, anterior segment, which was not previously seen on unenhanced or HA phase enhanced CT scans.
Magnetic Resonance Imaging
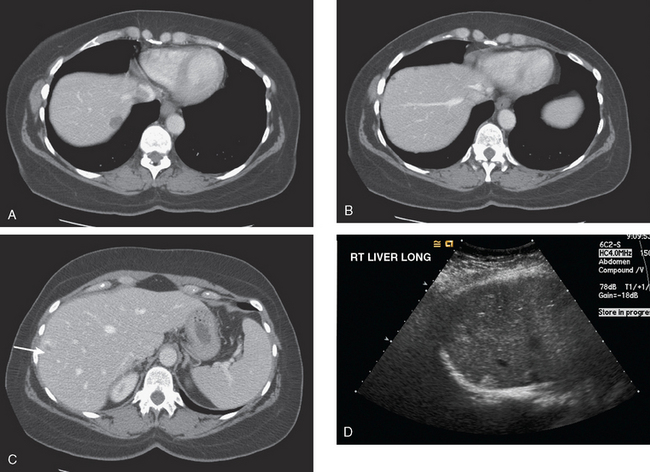
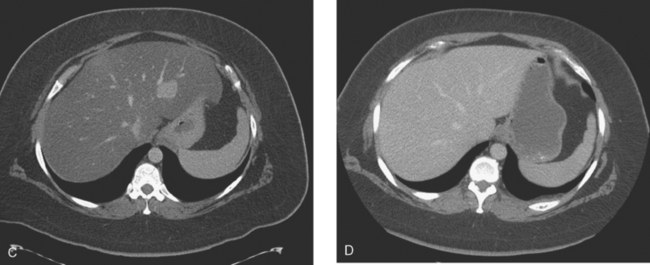
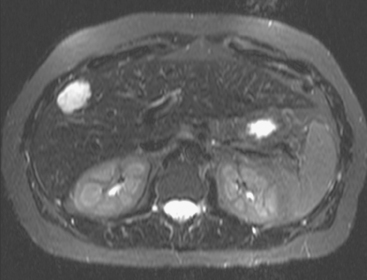
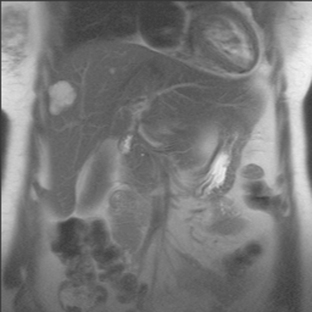
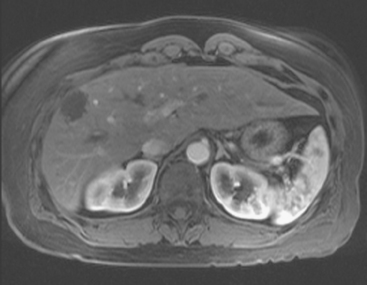
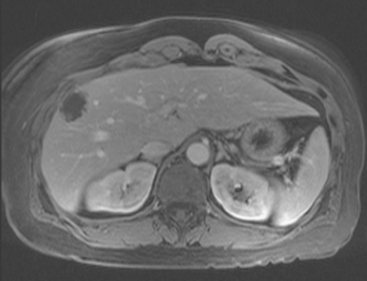
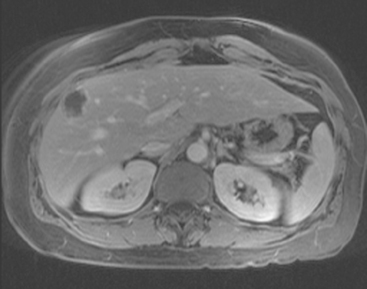
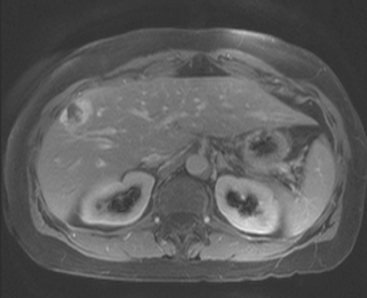
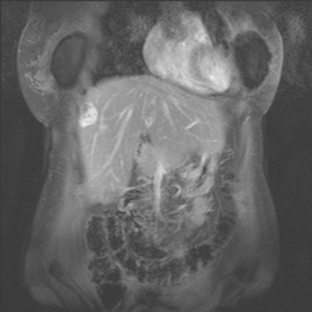
On T1-weighted sequences, the liver normally is brighter than the spleen. Most liver lesions that are not of hepatocellular origin (including the most commonly encountered liver lesions, namely cysts, hemangiomas, and metastases), are hypointense compared with the liver parenchyma on T1-weighted sequences. Lesions that are of hepatocellular origin (such as hepatocellular carcinoma, adenomas, and focal nodular hyperplasia) are often isointense or hyperintense to liver parenchyma on T1-weighted sequences. A variety of T1-weighted sequences are available, including conventional spin echo, turbo or fast spin echo (depending on the manufacturer), and gradient echo. Gradient echo T1-weighted sequences may be acquired with the echo time (TE) varied so that fat and water protons are in or out of phase. Such acquisitions are sensitive to the presence of microscopic fat and are very useful for identifying fatty infiltration, focal areas of fat deposition or sparing, and nodular forms of steatosis (Figures 4 and 5). On in-phase imaging, water and fat signal in the same voxel are additive, whereas on out-of-phase images, water and fat signal in the same voxel are opposed, leading to a loss of signal, which identifies fat-containing regions. The same principle is applied in the use of in-phase and out-of-phase imaging to confirm the identity of lipid-rich adrenal adenomas.
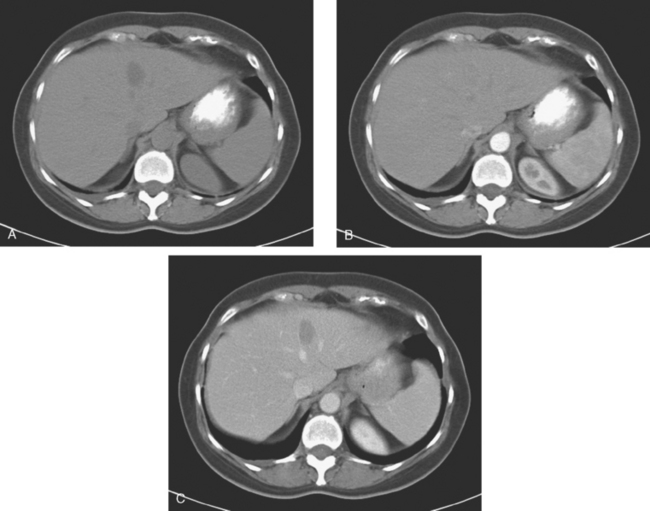
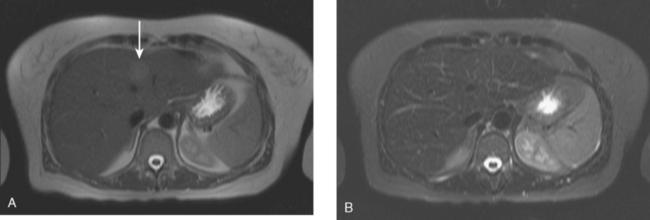
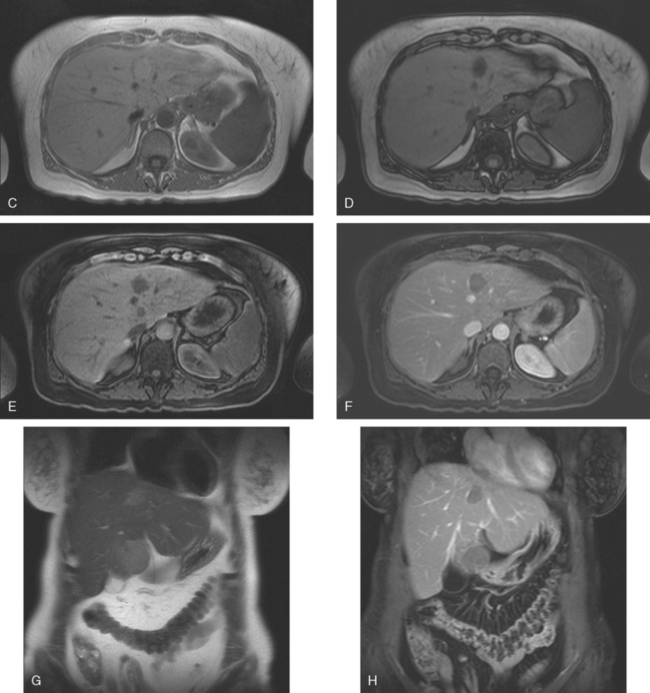
FIGURE 5 Abdominal MRI was then obtained to further assess the indeterminate liver lesions seen on CT in Figure 4. A, Axial half-Fourier acquisition single shot turbo spin echo (HASTE) (T2-weighted) shows the lesion to be brighter than the liver, similar to the spleen (arrow). B, Axial STIR does not clearly show the lesion. C, In-phase, T1-weighted axial image shows the lesion to be slightly hyperintense compared with the rest of the liver. D, Out-of-phase, T1-weighted axial image shows the pivotal observation: there is a marked loss of signal of the lesion, indicating fat content. The other lesions behaved in a similar fashion. E, Axial fat-saturated, T1-weighted, gradient echo image before contrast administration shows the lesion as hypointense. F, PV phase, enhanced, fat-saturated, T1-weighted, gradient echo image shows the lesion as hypointense compared with the liver. No vascular displacement is evident. G, Coronal HASTE (T2-weighted) image shows two of the four similar-appearing lesions in the left lobe. H, Coronal fat-saturated, T1-weighted, gradient echo image of the same two lesions. Hyperechoic ultrasound lesions most commonly represent hemangiomas, but focal fat is also in the sonographic differential diagnosis. These lesions show none of the characteristic imaging features of hemangiomas on CT or MRI. The critical observation to make is the loss of signal of the lesions between in-phase and out-of-phase, T1-weighted, gradient echo imaging, confirming mass-like accumulations of focal fat. This was biopsy-confirmed macrovesicular steatosis.
Fluid-sensitive sequences include T2-weighted and STIR sequences, which can be performed with or without fat saturation. Most liver lesions are hyperintense compared with liver parenchyma. The degree of hyperintensity is helpful in characterization of lesions, with cysts and hemangiomas more hyperintense and “fluid” in signal intensity than metastases and other more “solid” neoplasms. A good rule of thumb: the signal intensity of cysts and hemangiomas should be analogous to the cerebrospinal fluid (CSF) signal, whereas that of metastases and other neoplasms will approximate the signal intensity of the normal spleen.
Dynamic, enhanced imaging consists of repetitive performance of breath-hold, three-dimensional, fat-saturated, T1-weighted, gradient echo volumetric sequences, before, at 25 seconds, at 60 to 70 seconds, and at 2 or more minutes after bolus administration of gadolinium chelate contrast media. The presence or absence of contrast enhancement and the pattern and timing of enhancement generally enable reliable differentiation of benign cysts and hemangiomas from metastases.3
As previously noted, breast cancer metastases have been variably considered in the literature to be hypervascular metastases. Danet and associates looked at a series of liver MRIs obtained on 165 consecutive patients with untreated liver metastases, from a variety of primary tumors, including 16 patients with breast cancer.4 In this series, 69% of the breast cancer patients (11 of 16 patients) had metastases that were hypervascular, defined as enhancement greater than the liver on HA phase of enhancement, comparable to the pancreas. Smaller lesions (<1.5 cm) showed homogeneous hypervascular enhancement, whereas larger lesions (>3 cm) tended to show a peripheral ring of enhancement during the HA phase. In this series, 31% of the breast cancer patients (5 of 16) showed a hypovascular pattern of enhancement of liver metastases. Even for hypovascular metastases, the most common enhancement pattern seen during arterial dominant imaging was a faint peripheral ring of enhancement. The peripheral ring of enhancement was the most common enhancement pattern seen for all untreated metastases during arterial phase imaging in this series, and was seen in both hypervascular and hypovascular metastases and in 72% of the patients overall. This is considered a specific enhancement pattern for metastases. Incomplete central progression of enhancement was the most common pattern seen on delayed imaging in both hypervascular and hypovascular metastases, and was seen in 63% of the patients in this series of untreated metastases from a variety of primaries.
FREQUENCY OF LIVER INCIDENTALOMAS
On imaging of the liver for suspected metastases, a variety of benign “incidentalomas” will be encountered. These must be accurately characterized, reported, then dismissed. It is useful to gain perspective on the scope of this issue by reviewing series from the literature that address the incidence and significance of small focal liver incidentalomas. Depending on the series, small focal liver lesions have been variably defined as less than 10 or 15 mm. Jones and colleagues demonstrated that small focal liver lesions (<15 mm in this series) are common, found in 17% of 1454 consecutive outpatients undergoing contrast-enhanced abdominal CT over a 1-year period.5 Eighty-two percent of the patients with small focal liver lesions had a malignancy history. Of these, lesions were found to be benign in 51%. This report found that in patients with no cancer history, small focal liver lesions are almost invariably benign.
Even in patients with a malignancy history, small focal liver lesions (<10 mm in the series of 2978 cancer patients undergoing CT over a 2-year period by Schwartz and associates) were benign 80% of the time.6 In this series, focal liver lesions proved to be metastases in about 12% of patients overall and in 22% of patients when the malignancy history was breast cancer. However, this series did not include a control group of breast cancer patients without such lesions.
Krakora and colleagues evaluated the prognostic significance of the presence of small (<15 mm), hypoattenuating liver lesions on CT in breast cancer patients.7 This was a retrospective review of 153 breast cancer patients who underwent serial abdominal CT, who did not have definite liver metastases at initial CT. Of these patients, 35% (54 of 153) had one or more small hypoattenuating liver lesions on initial CT. Twenty-eight percent (43 of 153) developed definite liver metastases on subsequent CT. These included 28% of patients (15 of 54) with hypoattenuating liver lesions on initial CT and 28% (28 of 99) without such lesions. No association was demonstrated between the presence, size, or number of small hypodense liver lesions on initial CT and the subsequent development of liver metastases. The authors concluded that in breast cancer patients, the presence of small, hypoattenuating liver lesions on CT, without other evidence of hepatic metastases, was not associated with an increased risk for subsequently developing liver metastases.
Khalil and associates looked at the prevalence and significance of hepatic lesions considered to be too small to characterize (TSTC), which were identified on contrast-enhanced CT obtained in breast cancer patients.8 At least one hepatic lesion considered TSTC (and no definite metastasis) was identified in 29% (277 of 941) of their patients. Subsequent imaging in 69% of patients (191 of 277) showed no change in 92% (175 of 191) or lesion nonvisualization in 4% (8 of 191). Interval enlargement of a lesion previously considered TSTC was noted in 6 of 191 patients (3%). Of these 6, 3 were metastatic breast cancer, 1 was metastatic pancreatic cancer, 1 was a growing cyst, and the final lesion was indeterminate. In this series, liver lesions that were initially TSTC were benign 93% to 97% of the time.
Similar series have looked at the incidence of benign liver incidentalomas detected on liver imaging by MRI in patients with breast cancer. An interesting series was reported by Noone and associates, who looked at 34 patients referred for liver MRI evaluation for suspected metastases at the time of initial breast cancer diagnosis.9 The patients were referred for characterization of liver lesions noted on CT or ultrasound, or for liver function test abnormalities. A full third of the patients had benign lesions identified, including 11 (32%) with benign lesions only and an additional 2 patients with benign lesions coexisting with malignant lesions. The benign lesions were hemangiomas (7), cysts (5), adenomas (2), and one case each of focal fat deposition and focal fatty sparing. Three of 34 patients (9%) had multiple types of benign liver lesions.
Even when not directly evaluating the liver, it may be partially visualized during breast MRI (depending on the coil coverage). Accordingly, even the full-time breast imager needs to be familiar with focal liver lesions (Figure 6). In this setting, the imaging information will not be as complete as with a dedicated abdominal examination. It is important to have an understanding of when there is sufficient information to characterize a liver lesion or not. Similarly, not infrequently, focal liver lesions may have to be assessed based on a single phase of CT enhancement (usually portal venous), such as in metastases screening CT in patients with new diagnoses of locally advanced breast cancer (Figure 7).
IMAGING FEATURES OF COMMONLY ENCOUNTERED BENIGN LIVER INCIDENTALOMAS
Cysts
Liver cysts are common, seen in 5% to 14% of the general population. They are thought to arise from bile duct epithelium. On ultrasound, cysts in the liver are anechoic, with sharp margins and enhanced through-transmission, analogous to breast cysts. On both CT and MRI, they are homogeneous, are near-water in density or signal intensity, have circumscribed margins and an imperceptible wall, and do not enhance (see Figures 6, 11B, and 11C). On CT, the density should be less than 20 HU, with the caveat that very small cysts may be volume-averaged with adjacent tissue and will have density greater than 20 HU. Readily visualizing a small, hypodense lesion on CT suggests it is cystic, because of the greater attenuation difference between a fluid density cyst and liver parenchyma than between a small metastasis and liver. On MRI, cyst signal intensity will approximate CSF on all sequences.
Rarely, cysts may be difficult to differentiate from cystic metastases. Identification of thick or irregular walls, internal septations, and any enhancement or density greater than 20 HU on CT usually allows cystic neoplasms to be distinguished from simple cysts.
Hemangiomas
Hemangiomas are the most commonly encountered benign liver tumor, seen in 7% of the normal adult population and 20% of autopsy specimens. Composed of communicating endothelium-lined vascular channels within a loose fibroblastic stroma, they are supplied by HA branches but have slow internal circulation. This structure is reflected in their characteristic enhancement pattern, with peripheral nodular or globular puddling enhancement, progressing centripetally to partially or completely fill in on delayed imaging. Larger lesions in particular may not fill in entirely, and complete fill-in is not necessary to confirm the diagnosis. The enhancement intensity should follow the aorta throughout all phases of imaging. Small hemangiomas may be completely opacified by the time of initial enhanced imaging, so-called flash filling. Hemangiomas are sharply marginated and may have internal septa that can be visualized, especially on MRI. On noncontrast CT, hemangiomas are hypodense to normal liver and isodense to the blood pool. On unenhanced MRI, hemangiomas are hypointense to liver on T1-weighted sequences and markedly hyperintense to liver (similar to CSF) on fluid-sensitive sequences (T2-weighted and STIR). On ultrasound, small hemangiomas are generally uniformly hyperechoic. Echogenicity of larger hemangiomas is more variable. For examples of the imaging features of hemangiomas, see Figures 7, 8, 12C and 12D, and Case 1 in this chapter.
Fatty Change of the Liver
Fatty infiltration of the liver can be diffuse, geographic, focal or multifocal, and nodular, termed nodular steatosis.10 Fatty liver is commonly associated with alcoholic liver disease, metabolic syndrome (insulin resistance, obesity, and hyperlipidemia), viral infections or hepatitis, and drug exposure to steroids or prior chemotherapy. On ultrasound, fatty change is generally recognized by increased liver parenchymal echogenicity compared with normal renal cortex (Figure 9). The normal liver approximates or is minimally more echogenic than the normal kidney. The liver may be enlarged. With increasing degrees of fatty change, intrahepatic vessel visualization is hampered, as well as visualization of the diaphragm.
On CT, fatty change of the liver is recognized best on noncontrast images as reduced liver attenuation compared with the spleen (Figure 10). With marked degrees of fatty change, conspicuity of vessels and lesions is increased in comparison with the hypodense liver parenchyma, with the fatty change serving as a form of natural contrast. The liver density is normally 8 HU higher than the spleen. The diagnosis of fatty liver can be confirmed when the attenuation of the liver is at least 10 HU less than the spleen on unenhanced CT, or if the liver attenuation is less than 40 HU on enhanced CT.
Focal fat deposition is recognized as geographic or non-mass-like reduced attenuation and is commonly noted adjacent to the ligamentum teres (Figure 11A), as well as the porta hepatis and the gallbladder fossa. The location and appearance are usually sufficiently characteristic to enable recognition. Occasionally, focal fat deposition may be mass-like and will require further workup. If further characterization is needed, in-phase and out-of-phase T1-weighted, gradient echo MRI will show loss of signal in fat-containing regions on the out-of-phase images (see Figure 5).
CHARACTERIZING SMALL FOCAL LESIONS
Ultrasound is very operator dependent, and its sensitivity for identification of small liver lesions is greatly affected by a patient’s body habitus. Eberhardt and colleagues looked retrospectively at the performance of sonography in evaluating small, indeterminate liver lesions found on CT in cancer patients.11 In their series of 76 patients with 124 indeterminate, CT-identified, small (<1.5 cm) liver lesions, less than half (48%) of the lesions were found on ultrasound. The detection rate was influenced both by the size of the lesions and whether the sonographer was aware of the CT result and specifically sought an ultrasound correlate. Two thirds (66%) of lesions were found when the CT data were referenced, compared with only about one third (32%) when it was not. Lesion size was the other major factor influencing detection, with 67% of lesions measuring 0.6 to 1.5 cm found, compared with 19% of lesions smaller than 0.5 cm. Patient body habitus was also a significant factor affecting lesion detection with ultrasound. The lesions ultrasound did find were successfully characterized in most cases (93%).
The authors concluded that ultrasound may be useful to characterize 0.6- to 1.5-cm indeterminate liver lesions found on CT in cancer patients of average body habitus. The opposite conclusion could be drawn in reference to the same material: that ultrasound is too operator and patient body habitus dependent, as well as too limited for evaluation of very small (<0.5 cm) lesions to be routinely advocated to characterize small, indeterminate, CT-identified lesions, which are statistically highly likely to be benign (Figure 12).
Such a conclusion was drawn by Patterson and associates, who looked at evaluating small (TSTC) CT liver lesions in breast cancer patients with MRI.12 Their study population consisted of 38 women with breast cancer who underwent abdominal MRI at or after initial diagnosis of breast cancer and who had at least one TSTC liver lesion previously identified on CT. In 11 patients (30%), indeterminate lesions on CT remained indeterminate on MRI. Follow-up imaging, biopsy, or both in 8 of these 11 patients confirmed benignity of the indeterminate lesions. In 8 patients (21%), no lesion was confirmed on MRI at the site questioned on CT. Metastatic lesions were identified in 2 patients, and benign diagnoses were confirmed by MRI in 22. The authors concluded that only marginal benefit was derived from using MRI to characterize TSTC liver lesions found on CT in newly diagnosed breast cancer patients, if their initial CT did not show definite liver metastases. In this series, only about 5% of such TSTC lesions on CT proved on MRI to be metastases.
TREATMENT EFFECTS: IMAGING MANIFESTATIONS
A variety of morphologic changes can be seen in the liver after treatment with chemotherapy. These changes can be diffuse, such as fatty change (see Figure 10), or local changes may be seen at the site of treated liver metastases. Liver metastases may shrink, or largely resolve, in response to successful systemic therapy. A hypodense, scar-like residual may remain at the site of a treated lesion, and either growth or shrinkage of breast cancer metastases has been shown to induce changes in the overlying liver contour, resulting either from capsular retraction or nodular regeneration of uninvolved areas. The end result can on occasion mimic cirrhosis, with lobularity of the liver contour, atrophy of heavily involved lobes, enlargement of the caudate lobe, and even development of ascites on occasion (Figures 13 and 14). This appearance developing in response to chemotherapy for breast liver metastases has been termed pseudocirrhosis and is illustrated in Case 3 in this chapter.
Rarely, treated metastases may regress to leave cyst-like residuals (see Case 6 in this chapter).
1 Frederick MG, Paulson EK, Nelson RC. Helical CT for detecting focal liver lesions in patients with breast carcinoma: comparison of noncontrast phase, hepatic arterial phase, and portal venous phase. J Comput Assist Tomogr. 1997;21:229-235.
2 Sheafor DH, Frederick MG, Paulson EK, et al. Comparison of unenhanced, hepatic arterial-dominant, and portal venous-dominant phase helical CT for the detection of liver metastases in women with breast carcinoma. AJR Am J Roentgenol. 1999;172:961-968.
3 Semelka RC. Hepatic imaging. Radiol Clin North Am. 43(5), 2005.
4 Danet I-M, Semelka RC, Leonardou P, et al. Spectrum of MRI appearances of untreated metastases of the liver. AJR Am J Roentgenol. 2003;181:809-817.
5 Jones EC, Chezmar JL, Nelson RC, et al. The frequency and significance of small hepatic lesions (< 15 mm) detected by CT. AJR Am J Roentgenol. 1992;158:535-539.
6 Schwartz LH, Gandras EJ, Colangelo SM, et al. Prevalence and importance of small hepatic lesions found at CT in patients with cancer. Radiology. 1999;210:71-74.
7 Krakora GA, Coakley FV, Williams G, et al. Small hypoattenuating hepatic lesions at contrast-enhanced CT: prognostic importance in patients with breast cancer. Radiology. 2004;233:667-673.
8 Khalil HI, Patterson SA, Panicek DM. Hepatic lesions deemed too small to characterize at CT: prevalence and importance in women with breast cancer. Radiology. 2005;235(3):872-878.
9 Noone TC, Semelka RC, Balci NC, et al. Common occurrence of benign liver lesions in patients with newly diagnosed breast cancer investigated by MRI for suspected liver metastases. J Magn Reson Imaging. 1999;10(2):165-169.
10 Hamer OW, Aguirre DA, Casola G, et al. Fatty liver: imaging patterns and pitfalls. RadioGraphics. 2006;26:1637-1653.
11 Eberhardt SC, Choi PH, Bach AM, et al. Utility of sonography for small hepatic lesions found on computed tomography in patients with cancer. J Ultrasound Med. 2003;22:335-343.
12 Patterson SA, Khalil HI, Panicek DM. MRI evaluation of small hepatic lesions in women with breast cancer. Am J Roentgenol. 2006;187:307-312.
CASE 1 Workup of indeterminate liver lesion with MRI (hemangioma)
A 57-year-old woman with a remote history of treated breast cancer developed mild liver function test elevations while on statin therapy for elevated low-density lipoprotein cholesterol. Her breast cancer history was 17 years before at age 40 years, and was an early-stage, T1N0M0, 1.1-cm infiltrating ductal carcinoma, with negative lymph nodes and margins. She had been treated with lumpectomy, radiation therapy, and 5 years of tamoxifen. A triple-phase liver CT scan was obtained to further evaluate the liver. A hypovascular mass was identified, with rim enhancement, with subtle suggestion of rim nodularity (Figure 1). No delayed images were obtained. The findings were regarded as indeterminate and not diagnostic of a hemangioma. MRI was recommended for additional characterization, and confirmed signal intensity and enhancement characteristics of a hemangioma (Figures 2, 3, 4, 5, 6, 7, 8, 9, and 10).
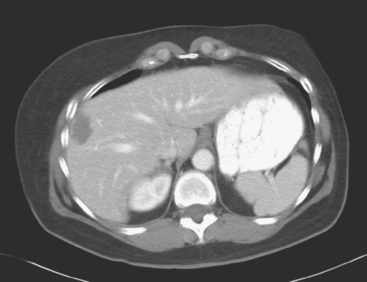
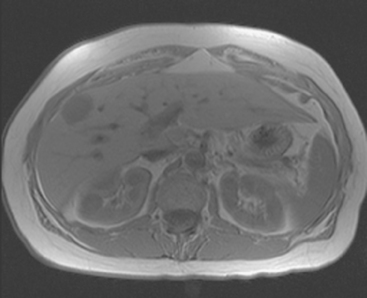
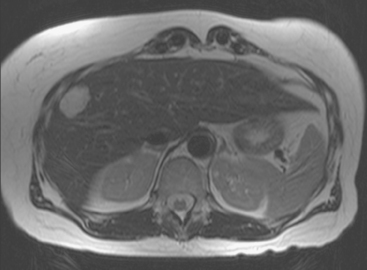
FIGURE 3 Axial T2-weighted MR image (HASTE) shows the lesion to be hyperintense, with thin septa within.
TEACHING POINTS
Imaging of the liver in patients with a history of breast cancer will frequently identify benign focal liver lesions, which will need to be accurately characterized in order to exclude liver metastatic disease. Most commonly encountered are liver cysts and hemangiomas. This case is an example of the most common benign liver tumor, the cavernous hemangioma, which can be seen in up to 7% of the normal adult population and in up to 20% of autopsy specimens. The lesion consists of interconnected, endothelium-lined, vascular channels within a loose fibroblastic stroma. Fed by branches of the hepatic artery, the lesion has slow internal circulation, leading to its characteristic enhancement pattern, which enables these lesions to be recognized and confidently characterized on CT and MRI. Early enhancement consists of peripheral puddling, with nodular or globular enhancement on the rim of the lesion. This progresses centripetally until most or all of the lesion is enhanced. On all phases of enhancement, the intensity of contrast enhancement should approximate that of the aorta. The lesions are sharply marginated. On MRI, the lesions are quite hyperintense or fluid in signal intensity on fluid-sensitive sequences, such as T2-weighted and STIR sequences, similar in intensity to cerebrospinal fluid. Internal septations can be seen, as in this case, and larger hemangiomas may not completely fill in. Small hemangiomas may completely fill in early in enhancement, termed flash filling.
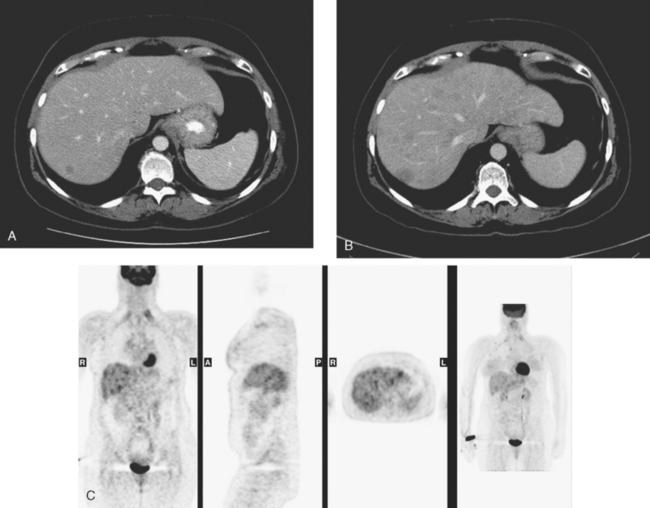
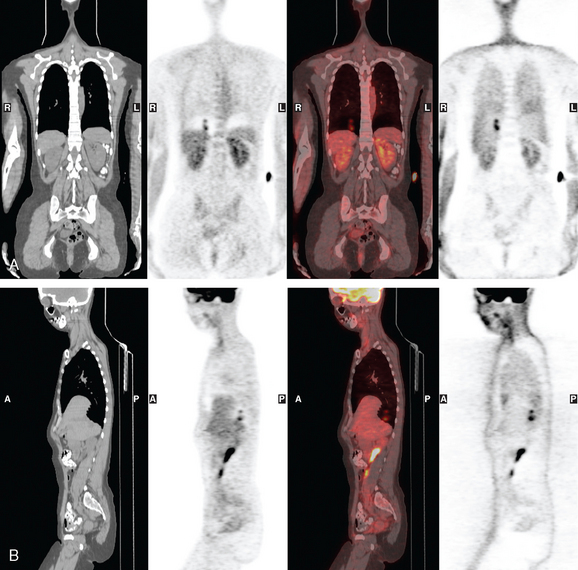
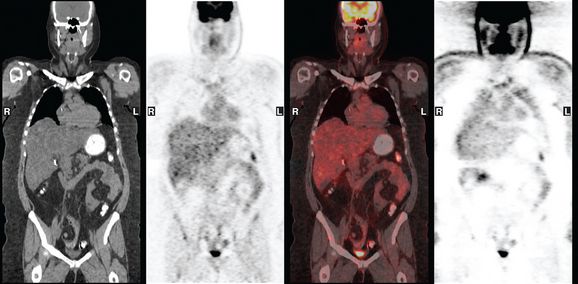
CASE 2 Progression of liver metastases on CT and PET
A 37-year-old woman with extensive bony metastatic breast cancer known for 1 year developed increased aching, weight loss, depressed appetite, and rising tumor markers while on goserelin acetate (Zoladex), zoledronic acid (Zometa), and exemestane (Aromasin). Positron emission tomography (PET)/CT and enhanced body CT scans showed new liver metastases (Figures 1 and 2). Chemotherapy was recommended but declined by the patient. She was started on fulvestrant (Faslodex) and restaged 2 months later, at which time fatigue, shortness of breath, and rising tumor markers were noted. Repeat PET/CT and enhanced body CT scans showed progression of liver metastases (Figures 3 and 4), as well as new lung involvement (see Case 13 in Chapter 10). One month later, the patient was admitted with mental confusion, thought to be hepatic encephalopathy due to the progressive and extensive liver metastases. Workup for alternative etiologies, including abdominal ultrasound and head CT, showed only the known disease, with no additional abnormality.
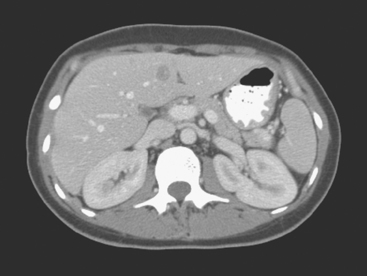
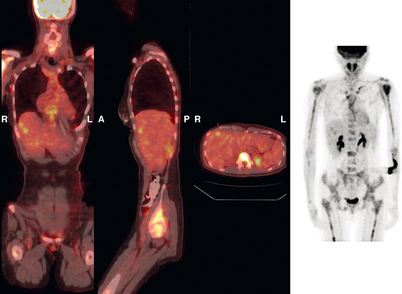
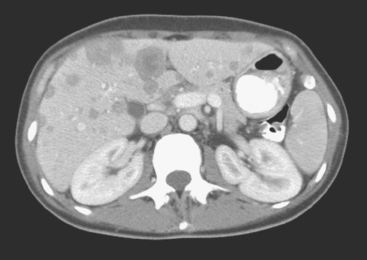
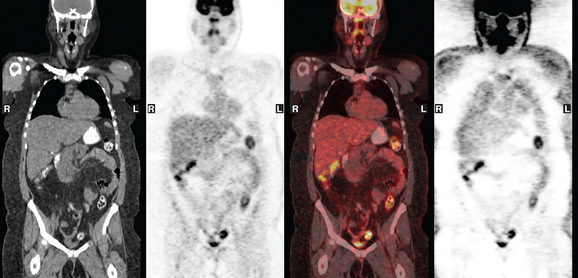
FIGURE 3 Repeat CT scan, 2 months later. Chemotherapy was declined by the patient, and 2 months of treatment with Faslodex was given instead. Marked progression of liver metastases is seen. The index left lobe lesion pictured in Figure 1 has grown, and innumerable additional metastases are seen.
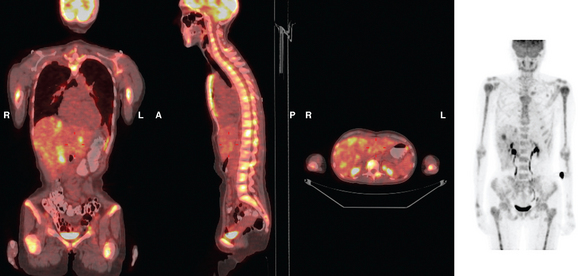
FIGURE 4 Repeat PET/CT, 2 months after study in Figure 2 and concurrent with CT in Figure 3. Fused PET/CT images show marked progression of liver metastases. Many more hypermetabolic liver foci are identifiable and correlate with the progressive CT findings.
Her original tumor was diagnosed 5 years before and was an estrogen receptor– and progesterone receptor–positive, T1cN1b(4) infiltrating ductal carcinoma. It was treated with breast conservation and axillary dissection, with 4 of 20 lymph nodes positive. Additional treatment included chemotherapy (four cycles of doxorubicin [Adriamycin] plus cyclophosphamide [Cytoxan] [AC] and four of paclitaxel [Taxol]); right breast, supraclavicular, and axillary radiation therapy; and tamoxifen. One year before liver metastases were discovered, diffuse bone metastases were found when the patient sought orthopedic advice for low back and right leg pain. See Case 3 in Chapter 8 for discussion of the imaging manifestations of this patient’s bone metastases.
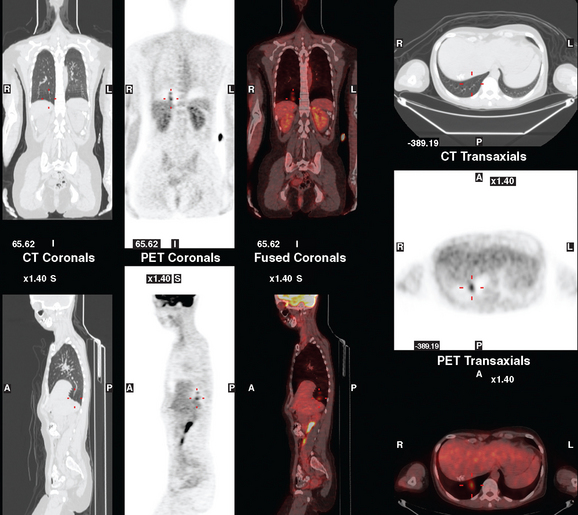
CASE 3 Pseudocirrhotic appearance of treated breast cancer liver metastases; mislocalization of right liver metastases into right lung base on PET/CT
When the patient developed constitutional symptoms, she was restaged with CT scans, showing extensive hepatic metastases. Chemotherapy with carboplatin, docetaxel (Taxotere), and trastuzumab (Herceptin) was initiated, with good response. Follow-up surveillance CT scans showed resolution of the bulk of the liver metastases, with development of a progressively scarred liver, which has been termed pseudocirrhosis. Her disease status was periodically assessed while on vinorelbine tartrate (Navelbine) with enhanced abdominal CT scans and positron emission tomography (PET)/CT (Figures 1, 2, 3, 4, and 5).
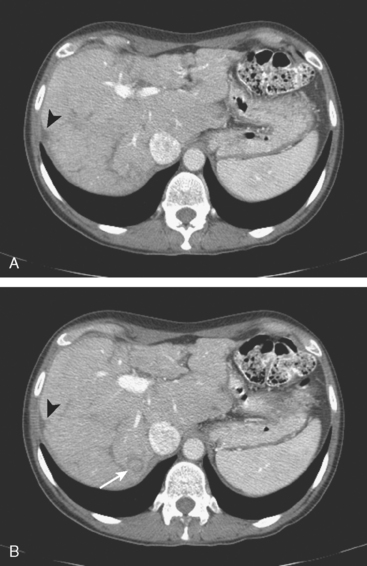
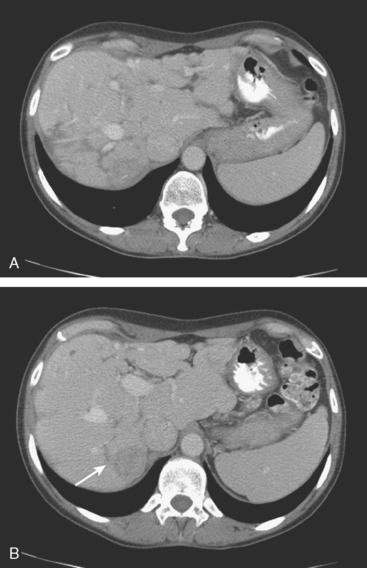
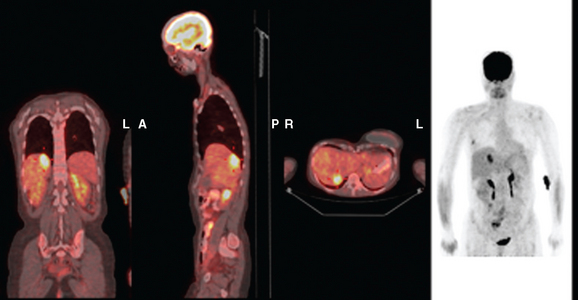
FIGURE 3 Fused PET/CT images (left to right: coronal, sagittal, axial, and coronal projection PET volume image), concurrent with CT scans in Figure 2, show the growing posterior segment right lobe liver metastasis at the dome to be intensely hypermetabolic. The coronal projection image shows a separate focus of activity in the right hemithorax, which proved to be a rib fracture. See Case 8 in Chapter 8 for a discussion of bone findings in this same patient.
TEACHING POINTS
This case also illustrates a recognized misregistration artifact seen in PET/CT. In a series of 300 patients reported by Osman and colleagues, 2% of cases had mislocalization of liver dome lesions into the right lung base when CT was used for attenuation correction of PET. This occurs presumably because of respiratory variation between PET and CT. PET images, requiring several minutes of acquisition per position, are averaged over many respiratory cycles, as opposed to the more rapid CT acquisition. When such misregistration is suspected, review of the non-attenuation-corrected images (Figure 6) can be helpful in confirming this artifact.
Osman MM, Cohade C, Nakamoto Y, et al. Mislocalization of lesions with PET/CT. J Nucl Med. 2003;44:240-243.
Young ST, Paulson EK, Washington K, et al. CT of the liver in patients with metastatic breast carcinoma treated by chemotherapy: findings simulating cirrhosis. AJR Am J Roentgenol. 1994;163:1385-1388.
CASE 4 Progressive liver metastases on CT and PET
A 64-year-old woman, 3 years after right mastectomy, chest wall and supraclavicular radiation, and chemotherapy for breast cancer, was found to have an abnormally elevated tumor marker (CA 27.29). Her tumor was a 2.8-cm infiltrating ductal carcinoma, estrogen receptor and progesterone receptor positive, HER-2/neu positive, with 1 of 15 lymph nodes involved.
Periodic PET and CT evaluations were obtained over the next 3 years, to assess treatment responses, especially when tumor progression was suggested by rising tumor markers and liver function abnormalities (Figures 1 and 2). These showed a waxing and waning CT response of the liver metastases to adjustments in therapy, but there was an overall progression of her liver metastases. Her treatment regimen was adjusted numerous times, with multiple regimens utilized, including trastuzumab (Herceptin) and exemestane (Aromasin), Herceptin and vinorelbine tartrate (Navelbine), then capecitabine (Xeloda), followed by fulvestrant (Faslodex), and ultimately, bevacizumab (Avastin) and paclitaxel (Taxol). Over this time period, the patient remained relatively asymptomatic.
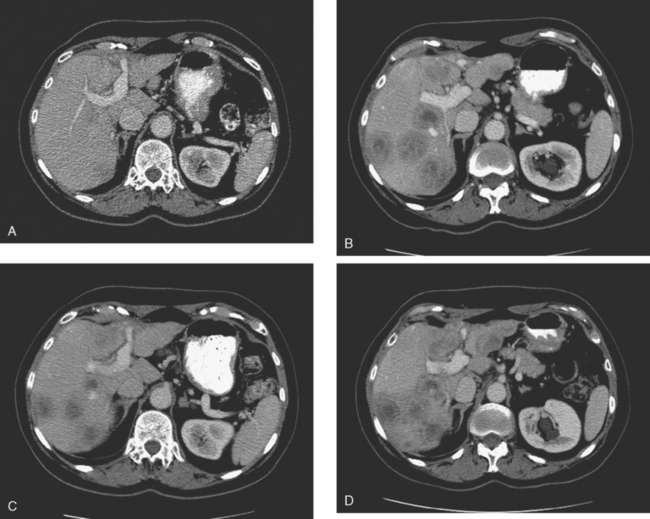
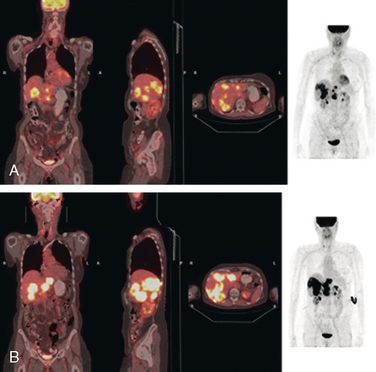
FIGURE 2 Three plane PET/CT fused images. A, This study is concurrent with Figure 1C. Multiple hypermetabolic liver lesions are seen, which were not clearly changed by PET compared with 5 months earlier. The patient had been on Xeloda during this time interval. On CT, the lesions were more ill-defined. B, Repeat study, 4 months later, concurrent with CT in Figure 1D. Clear progression of liver metastases is demonstrated by PET, correlating with the change in size and appearance of the liver lesions on CT. The patient’s therapy was changed from Faslodex to Avastin and Taxol.
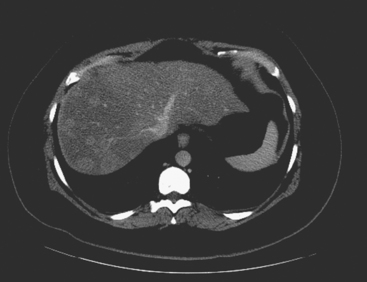
CASE 5 Liver metastases arising in fatty liver, better seen on CT than PET
PET/CT and contrast-enhanced body CT scans obtained to restage the patient showed new liver metastases. These were readily seen on CT as relatively hyperdense lesions against a background of a markedly fatty liver (Figure 1). The corresponding PET/CT scan, although abnormal and changed from a prior study, showed only subtle corresponding abnormalities, manifested as increased liver inhomogeneity (Figure 2).
Repeat staging studies, 2 months later, confirmed the clinical and biochemical improvement (Figures 3 and 4).
TEACHING POINTS
This is an unusual case in which new liver metastases are more convincingly diagnosed on CT than from the PET scan. We are reminded of the complementary nature of anatomic (CT and MRI) and functional (PET) imaging. In this case, the extensive fatty change of the liver serves as an intrinsic contrast on CT, against which the new, solid, relatively hyperdense lesions are easily seen. We can speculate as to why these liver metastases are not more obvious on the PET study. Size likely is a contributing factor. The largest lesion by CT was 2 cm, but most of the lesions were on the order of 1 cm in diameter, about the lower limit to identify liver metastases on PET. Although the lower limit of resolution for PET scanners today is about 6 mm, what can be seen at this size depends on the intrinsic metabolic activity of the particular tumor and its location. The liver itself has a standardized uptake value (SUV) of about 2.5, so a small metastasis within it has to be that much more metabolically active to be visualized.
CASE 6 Evolution of liver metastases with treatment to cyst-like residuals
By the time liver metastases were identified, the patient had progressive bone metastases for 6 years. In addition to the systemic therapies, she had been treated with radiation to the lumbar spine for painful epidural disease and with samarium for recurrent back pain. See Case 4 in Chapter 8 for a discussion of imaging manifestations of this patient’s bone metastases and neural consequences.
Enhanced CT scan of the abdomen showed new, peripherally enhancing, centrally necrotic liver masses, with typical CT findings of liver metastases (Figures 1 and 2). After treatment with chemotherapy (docetaxel [Taxotere]), an interesting evolution in appearance of the liver lesions was seen on CT (Figures 3, 4, and 5).
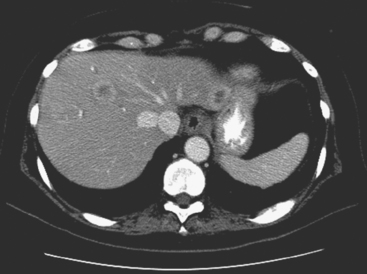
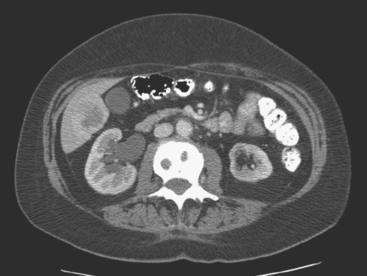
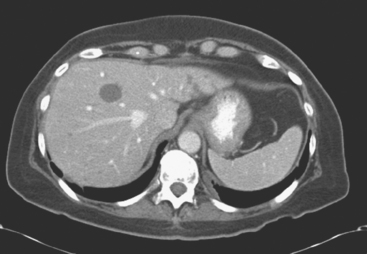
FIGURE 3 Repeat enhanced, PV phase abdominal CT, 3 months later, after treatment with Taxotere chemotherapy, shows the index lesion in segment 8 to have changed in appearance (compare with Figure 1). It now appears cystic, although careful inspection shows a thin, enhancing rim. Irregular, linear hypodensity is now seen at the level of the previously seen lesion in the lateral segment of left lobe (segment 2). Tiny hypodensities are also suggested in the posterior right lobe.
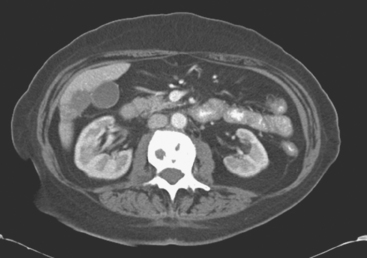
FIGURE 4 Three-month follow-up enhanced, PV phase abdominal CT scan through the lesion in segment 6 (compare with Figure 2) shows a hypodense residual, with resolution of the associated enhancement. Note development of capsular contraction at this level.
TEACHING POINTS
Ideally, treated metastases would respond unambiguously, with complete resolution. In reality, responding liver metastases can show a host of responses, ranging from complete resolution to shrinkage in size to morphologic alterations, generally with a decrease in size. Not only can treated liver metastases change in appearance but also treatment can induce changes in the liver. Capsular contraction, such as seen at the level of the largest metastasis in this case, is a frequently observed finding. The pretreatment appearance of these metastases is typical, with central necrosis and peripheral enhancement of the viable rim. A variety of post-treatment appearances are demonstrated here. The largest lesion in the inferior right lobe is smaller, with retraction of the adjacent capsule. Other lesions show a pseudocystic appearance. A larger lesion in the anterior right lobe in Figure 3 resembles a cyst at first glance. However, the presence of any enhancement, such as this thin, enhancing rim, differentiates it from a cyst.
[/level-membership-for-radiology-category][not-level-membership-for-radiology-category]
CHAPTER 9 Liver Metastases
MODALITY CHOICES AND TECHNIQUES
Computed Tomography
Generally, most metastases (any primary) are hypovascular and are best depicted on PV phase CT. Metastases that are considered hypervascular include renal cell carcinoma, carcinoid, neuroendocrine tumors, thyroid carcinoma, and melanoma and have been shown to be better seen on HA phase imaging. Breast carcinoma hepatic metastases can be hypervascular, but these represent a small minority of breast cancer liver metastases.
Triple-phase technique is desirable at initial imaging (referral for staging or clinical suspicion of liver metastases) to accurately characterize any lesions, benign or malignant, which may be encountered. However, follow-up of patients with known liver metastases with PV phase enhanced CT alone is generally sufficient and will avoid unnecessary radiation exposure. Support for this approach comes from work by Frederick and colleagues, who looked retrospectively at a series of 84 consecutive triple-phase CT scans in 80 women who were known or suspected to have breast cancer liver metastases.1 They evaluated each phase independently for focal liver lesions and found that the PV phase outperformed noncontrast and HA phases for lesion detection and identified more malignant lesions than the other phases. Importantly, no CT interpretation was converted from negative to positive for the presence of liver lesions based on the addition of either noncontrast or HA phase images. The authors noted that noncontrast and HA phase imaging added additional information in some cases, but found it difficult to justify their routine use when the clinical question was the presence or absence of metastatic disease.
The same group subsequently published a larger, prospective study of liver metastases detection in 300 consecutive triple-phase helical CT examinations in breast cancer patients.2 PV phase images were reviewed alone for the number and size of focal liver lesions. PV images were then reviewed in conjunction with noncontrast images, and again in conjunction with HA phase images. Little improvement in sensitivity for lesion detection was noted when comparing PV phase alone with PV phase in conjunction with noncontrast imaging (97% to 100%) or HA phase (96% to 98%), suggesting little additional benefit was derived from the addition of noncontrast or HA phases. Two to 4% of lesions were seen on HA phase imaging only. These represented either false-positive cases or were seen in conjunction with other metastases on the PV phase. The authors concluded that routine triple-phase imaging of breast cancer patients in whom liver metastases were suspected was not warranted, except at the time of initial examination when triple-phase technique is useful for characterizing focal lesions (e.g., cysts, hemangiomas, focal nodular hyperplasia) that may be encountered.
Magnetic Resonance Imaging
The PV phase occurs 45 to 75 seconds after the start of bolus contrast injection, and during this phase, the liver parenchyma is maximally enhanced, as well as the portal and hepatic veins. This phase is optimal for depiction of most hypovascular liver lesions, including most metastases.
FINDINGS OF LIVER METASTASES
Ultrasound
Liver metastases on ultrasound may manifest as solitary or multiple lesions, which most commonly are hypoechoic compared with the normal liver (Figure 1), or as diffuse inhomogeneity of the liver parenchyma (Figure 2).
Computed Tomography
On CT, breast cancer liver metastases typically are hypodense relative to normal liver on noncontrast series, may display rim enhancement or be hypervascular compared with the poorly enhanced liver on the hepatic arterial phase of enhancement, and on the portal venous phase, are hypodense relative to the enhancing liver (Figure 3).
FIGURE 3 CT images of liver metastases from an 83-year-old woman (same patient as in Figure 2) who developed a malignant pleural effusion and liver metastases 20 years after undergoing mastectomy for breast cancer. At the time of this study, the patient had known metastatic breast cancer for 3 years and had been relatively asymptomatic, first on letrozole (Femara) and then on fulvestrant (Faslodex), but progressive disease was suspected based on rising tumor markers. A, Unenhanced abdominal CT scan (acquired with arms at sides during tidal respiration for attenuation correction of PET) shows liver metastases as hypodense lesions compared with rest of the liver. B, Arterial phase enhanced CT scan shows three similar-appearing metastases, with thick peripheral enhancement and central hypodensity. The large hepatic veins are not enhanced during the HA phase of enhancement. C, PV phase enhanced CT image, same level, shows the lesions as larger hypodense regions, and an additional hypovascular metastasis is now seen in the peripheral right lobe, anterior segment, which was not previously seen on unenhanced or HA phase enhanced CT scans.
Magnetic Resonance Imaging
On T1-weighted sequences, the liver normally is brighter than the spleen. Most liver lesions that are not of hepatocellular origin (including the most commonly encountered liver lesions, namely cysts, hemangiomas, and metastases), are hypointense compared with the liver parenchyma on T1-weighted sequences. Lesions that are of hepatocellular origin (such as hepatocellular carcinoma, adenomas, and focal nodular hyperplasia) are often isointense or hyperintense to liver parenchyma on T1-weighted sequences. A variety of T1-weighted sequences are available, including conventional spin echo, turbo or fast spin echo (depending on the manufacturer), and gradient echo. Gradient echo T1-weighted sequences may be acquired with the echo time (TE) varied so that fat and water protons are in or out of phase. Such acquisitions are sensitive to the presence of microscopic fat and are very useful for identifying fatty infiltration, focal areas of fat deposition or sparing, and nodular forms of steatosis (Figures 4 and 5). On in-phase imaging, water and fat signal in the same voxel are additive, whereas on out-of-phase images, water and fat signal in the same voxel are opposed, leading to a loss of signal, which identifies fat-containing regions. The same principle is applied in the use of in-phase and out-of-phase imaging to confirm the identity of lipid-rich adrenal adenomas.
FIGURE 5 Abdominal MRI was then obtained to further assess the indeterminate liver lesions seen on CT in Figure 4. A, Axial half-Fourier acquisition single shot turbo spin echo (HASTE) (T2-weighted) shows the lesion to be brighter than the liver, similar to the spleen (arrow). B, Axial STIR does not clearly show the lesion. C, In-phase, T1-weighted axial image shows the lesion to be slightly hyperintense compared with the rest of the liver. D, Out-of-phase, T1-weighted axial image shows the pivotal observation: there is a marked loss of signal of the lesion, indicating fat content. The other lesions behaved in a similar fashion. E, Axial fat-saturated, T1-weighted, gradient echo image before contrast administration shows the lesion as hypointense. F, PV phase, enhanced, fat-saturated, T1-weighted, gradient echo image shows the lesion as hypointense compared with the liver. No vascular displacement is evident. G, Coronal HASTE (T2-weighted) image shows two of the four similar-appearing lesions in the left lobe. H, Coronal fat-saturated, T1-weighted, gradient echo image of the same two lesions. Hyperechoic ultrasound lesions most commonly represent hemangiomas, but focal fat is also in the sonographic differential diagnosis. These lesions show none of the characteristic imaging features of hemangiomas on CT or MRI. The critical observation to make is the loss of signal of the lesions between in-phase and out-of-phase, T1-weighted, gradient echo imaging, confirming mass-like accumulations of focal fat. This was biopsy-confirmed macrovesicular steatosis.
Fluid-sensitive sequences include T2-weighted and STIR sequences, which can be performed with or without fat saturation. Most liver lesions are hyperintense compared with liver parenchyma. The degree of hyperintensity is helpful in characterization of lesions, with cysts and hemangiomas more hyperintense and “fluid” in signal intensity than metastases and other more “solid” neoplasms. A good rule of thumb: the signal intensity of cysts and hemangiomas should be analogous to the cerebrospinal fluid (CSF) signal, whereas that of metastases and other neoplasms will approximate the signal intensity of the normal spleen.
Dynamic, enhanced imaging consists of repetitive performance of breath-hold, three-dimensional, fat-saturated, T1-weighted, gradient echo volumetric sequences, before, at 25 seconds, at 60 to 70 seconds, and at 2 or more minutes after bolus administration of gadolinium chelate contrast media. The presence or absence of contrast enhancement and the pattern and timing of enhancement generally enable reliable differentiation of benign cysts and hemangiomas from metastases.3
As previously noted, breast cancer metastases have been variably considered in the literature to be hypervascular metastases. Danet and associates looked at a series of liver MRIs obtained on 165 consecutive patients with untreated liver metastases, from a variety of primary tumors, including 16 patients with breast cancer.4 In this series, 69% of the breast cancer patients (11 of 16 patients) had metastases that were hypervascular, defined as enhancement greater than the liver on HA phase of enhancement, comparable to the pancreas. Smaller lesions (<1.5 cm) showed homogeneous hypervascular enhancement, whereas larger lesions (>3 cm) tended to show a peripheral ring of enhancement during the HA phase. In this series, 31% of the breast cancer patients (5 of 16) showed a hypovascular pattern of enhancement of liver metastases. Even for hypovascular metastases, the most common enhancement pattern seen during arterial dominant imaging was a faint peripheral ring of enhancement. The peripheral ring of enhancement was the most common enhancement pattern seen for all untreated metastases during arterial phase imaging in this series, and was seen in both hypervascular and hypovascular metastases and in 72% of the patients overall. This is considered a specific enhancement pattern for metastases. Incomplete central progression of enhancement was the most common pattern seen on delayed imaging in both hypervascular and hypovascular metastases, and was seen in 63% of the patients in this series of untreated metastases from a variety of primaries.
FREQUENCY OF LIVER INCIDENTALOMAS
On imaging of the liver for suspected metastases, a variety of benign “incidentalomas” will be encountered. These must be accurately characterized, reported, then dismissed. It is useful to gain perspective on the scope of this issue by reviewing series from the literature that address the incidence and significance of small focal liver incidentalomas. Depending on the series, small focal liver lesions have been variably defined as less than 10 or 15 mm. Jones and colleagues demonstrated that small focal liver lesions (<15 mm in this series) are common, found in 17% of 1454 consecutive outpatients undergoing contrast-enhanced abdominal CT over a 1-year period.5 Eighty-two percent of the patients with small focal liver lesions had a malignancy history. Of these, lesions were found to be benign in 51%. This report found that in patients with no cancer history, small focal liver lesions are almost invariably benign.
Even in patients with a malignancy history, small focal liver lesions (<10 mm in the series of 2978 cancer patients undergoing CT over a 2-year period by Schwartz and associates) were benign 80% of the time.6 In this series, focal liver lesions proved to be metastases in about 12% of patients overall and in 22% of patients when the malignancy history was breast cancer. However, this series did not include a control group of breast cancer patients without such lesions.
Krakora and colleagues evaluated the prognostic significance of the presence of small (<15 mm), hypoattenuating liver lesions on CT in breast cancer patients.7 This was a retrospective review of 153 breast cancer patients who underwent serial abdominal CT, who did not have definite liver metastases at initial CT. Of these patients, 35% (54 of 153) had one or more small hypoattenuating liver lesions on initial CT. Twenty-eight percent (43 of 153) developed definite liver metastases on subsequent CT. These included 28% of patients (15 of 54) with hypoattenuating liver lesions on initial CT and 28% (28 of 99) without such lesions. No association was demonstrated between the presence, size, or number of small hypodense liver lesions on initial CT and the subsequent development of liver metastases. The authors concluded that in breast cancer patients, the presence of small, hypoattenuating liver lesions on CT, without other evidence of hepatic metastases, was not associated with an increased risk for subsequently developing liver metastases.
Khalil and associates looked at the prevalence and significance of hepatic lesions considered to be too small to characterize (TSTC), which were identified on contrast-enhanced CT obtained in breast cancer patients.8 At least one hepatic lesion considered TSTC (and no definite metastasis) was identified in 29% (277 of 941) of their patients. Subsequent imaging in 69% of patients (191 of 277) showed no change in 92% (175 of 191) or lesion nonvisualization in 4% (8 of 191). Interval enlargement of a lesion previously considered TSTC was noted in 6 of 191 patients (3%). Of these 6, 3 were metastatic breast cancer, 1 was metastatic pancreatic cancer, 1 was a growing cyst, and the final lesion was indeterminate. In this series, liver lesions that were initially TSTC were benign 93% to 97% of the time.
Similar series have looked at the incidence of benign liver incidentalomas detected on liver imaging by MRI in patients with breast cancer. An interesting series was reported by Noone and associates, who looked at 34 patients referred for liver MRI evaluation for suspected metastases at the time of initial breast cancer diagnosis.9 The patients were referred for characterization of liver lesions noted on CT or ultrasound, or for liver function test abnormalities. A full third of the patients had benign lesions identified, including 11 (32%) with benign lesions only and an additional 2 patients with benign lesions coexisting with malignant lesions. The benign lesions were hemangiomas (7), cysts (5), adenomas (2), and one case each of focal fat deposition and focal fatty sparing. Three of 34 patients (9%) had multiple types of benign liver lesions.
Even when not directly evaluating the liver, it may be partially visualized during breast MRI (depending on the coil coverage). Accordingly, even the full-time breast imager needs to be familiar with focal liver lesions (Figure 6). In this setting, the imaging information will not be as complete as with a dedicated abdominal examination. It is important to have an understanding of when there is sufficient information to characterize a liver lesion or not. Similarly, not infrequently, focal liver lesions may have to be assessed based on a single phase of CT enhancement (usually portal venous), such as in metastases screening CT in patients with new diagnoses of locally advanced breast cancer (Figure 7).
